

Retrospective analysis assessing the spatial and temporal distribution of paediatric acute respiratory tract infections in Ho Chi Minh City, Vietnam
- PMID: 29358416
- PMCID: PMC5780701
- DOI: 10.1136/bmjopen-2017-016349
Retrospective analysis assessing the spatial and temporal distribution of paediatric acute respiratory tract infections in Ho Chi Minh City, Vietnam
Abstract
Background: Acute respiratory tract infections (ARIs) are the leading cause of morbidity and mortality in young children in low/middle-income countries. Using routine hospital data, we aimed to examine the spatial distribution, temporal trends and climatic risk factors of paediatric ARIs in Vietnam.
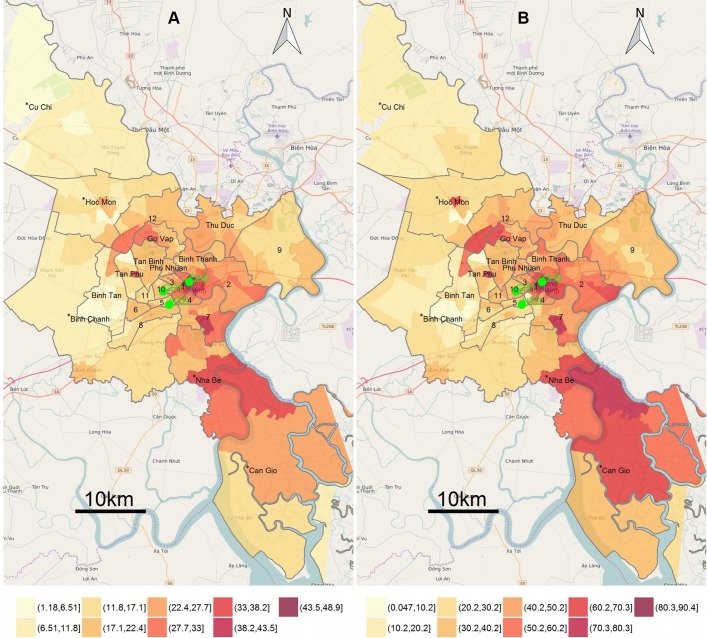
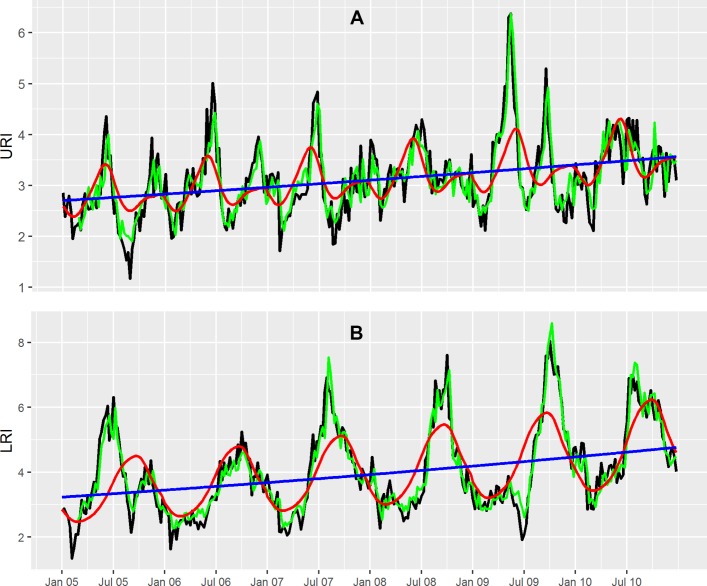
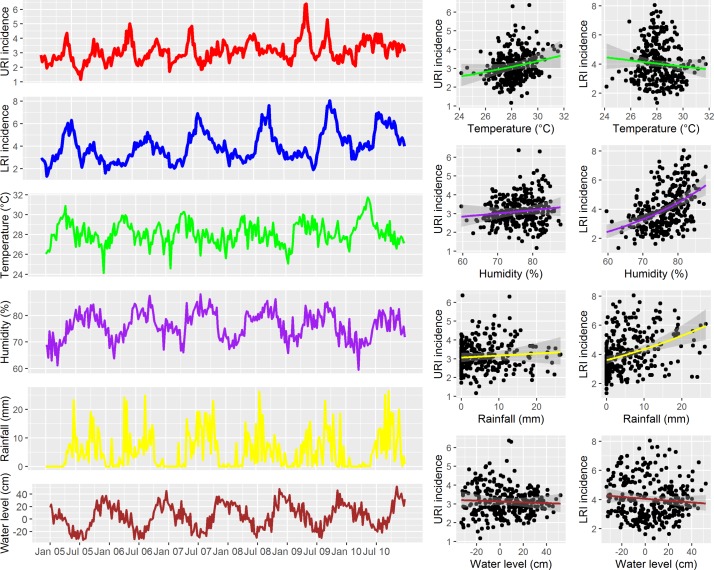
Methods: Data from hospitalised paediatric (<16 years) patients with ARIs residing in Ho Chi Minh City (HCMC) between 2005 and 2010 were retrieved from the two main Children's Hospitals and the Hospital for Tropical Diseases in HCMC. Spatial mapping and time series analysis were performed after disaggregating data into upper respiratory tract infections (URIs) and lower respiratory tract infections (LRIs).
Results: Over the study period, there were 155 999 paediatric patients admitted with ARIs (33% of all hospital admissions). There were 68 120 URIs (14%) and 87 879 LRIs (19%). The most common diagnoses were acute pharyngitis (28% of all ARI), pneumonia (21%), bronchitis (18%) and bronchiolitis (16%). A significant increasing trend over time was found for both URIs (mean weekly incidence per 1000 population, I=3.12), incidence rate ratio for 1-week increase in time (RR 1.0, 95% CI 1.02 to 1.17) for URI and (I=4.02, RR 1.08 (95% CI 1.006 to 1.16)) for LRI. The weekly URI incidence peaked in May-June and was significantly associated with lags in weekly URI incidence and the average humidity, rainfall and water level. The weekly LRI incidence exhibited significant seasonality (P<0.0001), with an annual peak in September-October and was significantly associated with lags in weekly LRI incidence and lags in weekly average temperature, rainfall and water level.
Conclusions: ARIs are a leading cause of childhood hospitalisation in HCMC, Vietnam. The incidence of ARIs was higher in the wet season and in specific HCMC districts. These results may guide health authorities in where and when to effectively allocate resources for the prevention and control of ARIs.
Keywords: acute respiratory infections; lower respiratory infections; pediatrics; spatial distribution; temporal patterns; upper respiratory infections.
© Article author(s) (or their employer(s) unless otherwise stated in the text of the article) 2018. All rights reserved. No commercial use is permitted unless otherwise expressly granted.
Conflict of interest statement
Competing interests: None declared.
Figures
References
-
- Simoes EAF, Cherian T, Chow J, et al. . Acute respiratory infections in children Disease control priorities in developing countries. 2nd edn Washington DC: World Bank, 2006.
-
- WHO/UNICEF. Ending preventable child deaths from Pneumonia and Diarrhoea by 2025: the Integrated Global Action Plan for Pneumonia and Diarrhoea (GAPPD). Geneva, 2013. - PubMed
Publication types
MeSH terms
Grants and funding
LinkOut - more resources
Full Text Sources
Other Literature Sources