

Economic impact of medication non-adherence by disease groups: a systematic review
- PMID: 29358417
- PMCID: PMC5780689
- DOI: 10.1136/bmjopen-2017-016982
Economic impact of medication non-adherence by disease groups: a systematic review
Abstract
Objective: To determine the economic impact of medication non-adherence across multiple disease groups.
Design: Systematic review.
Evidence review: A comprehensive literature search was conducted in PubMed and Scopus in September 2017. Studies quantifying the cost of medication non-adherence in relation to economic impact were included. Relevant information was extracted and quality assessed using the Drummond checklist.
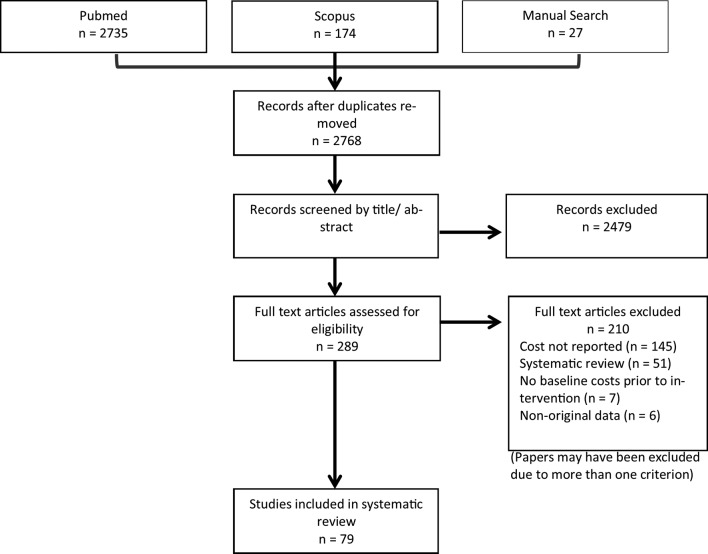
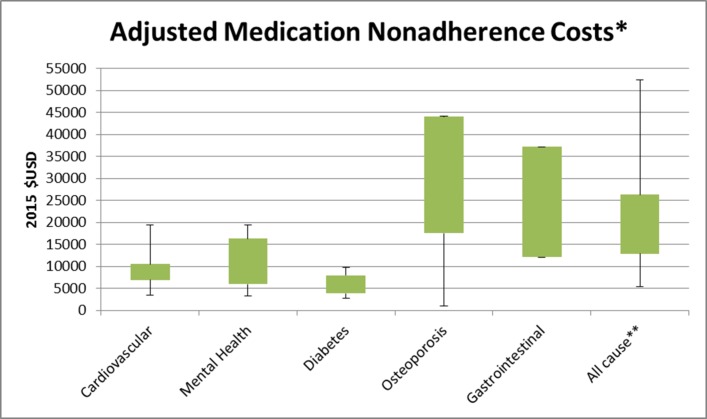
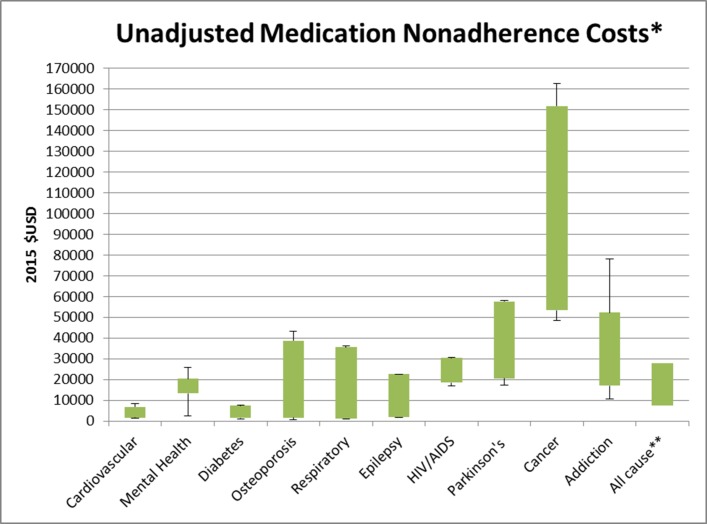
Results: Seventy-nine individual studies assessing the cost of medication non-adherence across 14 disease groups were included. Wide-scoping cost variations were reported, with lower levels of adherence generally associated with higher total costs. The annual adjusted disease-specific economic cost of non-adherence per person ranged from $949 to $44 190 (in 2015 US$). Costs attributed to 'all causes' non-adherence ranged from $5271 to $52 341. Medication possession ratio was the metric most used to calculate patient adherence, with varying cut-off points defining non-adherence. The main indicators used to measure the cost of non-adherence were total cost or total healthcare cost (83% of studies), pharmacy costs (70%), inpatient costs (46%), outpatient costs (50%), emergency department visit costs (27%), medical costs (29%) and hospitalisation costs (18%). Drummond quality assessment yielded 10 studies of high quality with all studies performing partial economic evaluations to varying extents.
Conclusion: Medication non-adherence places a significant cost burden on healthcare systems. Current research assessing the economic impact of medication non-adherence is limited and of varying quality, failing to provide adaptable data to influence health policy. The correlation between increased non-adherence and higher disease prevalence should be used to inform policymakers to help circumvent avoidable costs to the healthcare system. Differences in methods make the comparison among studies challenging and an accurate estimation of true magnitude of the cost impossible. Standardisation of the metric measures used to estimate medication non-adherence and development of a streamlined approach to quantify costs is required.
Prospero registration number: CRD42015027338.
Keywords: adherence; health economics; health policy; public health; quality in health care.
© Article author(s) (or their employer(s) unless otherwise stated in the text of the article) 2018. All rights reserved. No commercial use is permitted unless otherwise expressly granted.
Conflict of interest statement
Competing interests: RLC’s research is supported by an Australian Government Research Training Program Scholarship.
Figures
References
-
- Centres for Disease Control and Prevention. Chronic disease prevention and health promotion. http://www.cdc.gov/chronicdisease/overview (accessed 24 Jun 2016).
-
- World Health Organisation, National Institute of Aging, National Institute of Health and US Department of Health and Human Services. Global health and ageing. 2011. http://www.who.int/ageing/publications/global_health.pdf (accessed 24 Jun 2016).
-
- Congressional Budget Office. Offsetting effects of prescription drug use on medicare’s spending for medical services. Congressional budget office report. 2012. http://www.cbo.gov/sites/default/files/cbofiles/attachments/43741-Medica... (accessed 10 Aug 2017).
-
- World Health Organisation. Adherence to long term therapies; evidence for action. 2003. http://www.who.int/chp/knowledge/publications/adherence_full_report.pdf?... (accessed 6 Nov 2015).
-
- Horne RWJ, Barber N, Elliot R, et al. COncordance, adherence and compliance inmedicine taking. Report for the national coordinating centre for nhs service delivery and organization R & D (NCCSDO), 2005.
Publication types
MeSH terms
LinkOut - more resources
Full Text Sources
Other Literature Sources
Molecular Biology Databases