Comparative Study
. 2018 Jan 21;8(1):e017353.
doi: 10.1136/bmjopen-2017-017353.

Disparities in spread and control of influenza in slums of Delhi: findings from an agent-based modelling study

Affiliations
Comparative Study

Disparities in spread and control of influenza in slums of Delhi: findings from an agent-based modelling study

Abhijin Adiga et al. BMJ Open. .

Abstract

Objectives: This research studies the role of slums in the spread and control of infectious diseases in the National Capital Territory of India, Delhi, using detailed social contact networks of its residents.

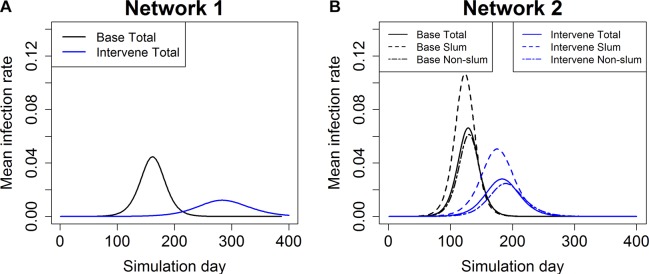
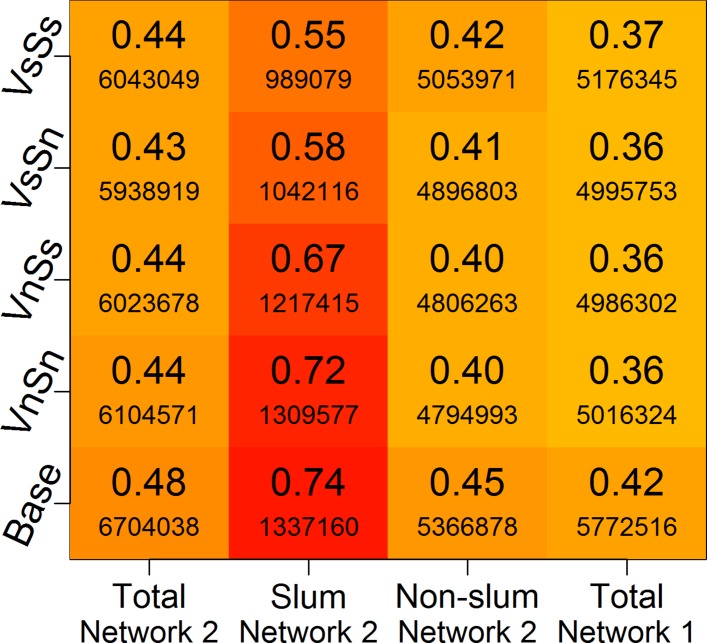
Methods: We use an agent-based model to study the spread of influenza in Delhi through person-to-person contact. Two different networks are used: one in which slum and non-slum regions are treated the same, and the other in which 298 slum zones are identified. In the second network, slum-specific demographics and activities are assigned to the individuals whose homes reside inside these zones. The main effects of integrating slums are that the network has more home-related contacts due to larger family sizes and more outside contacts due to more daily activities outside home. Various vaccination and social distancing interventions are applied to control the spread of influenza.

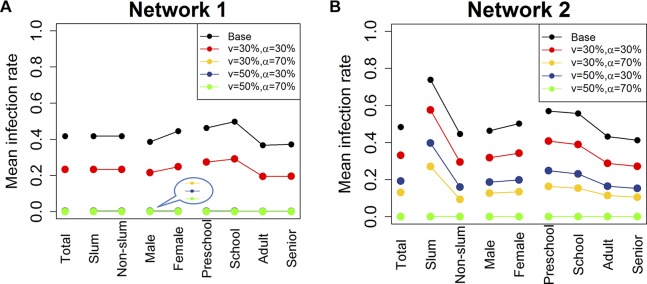
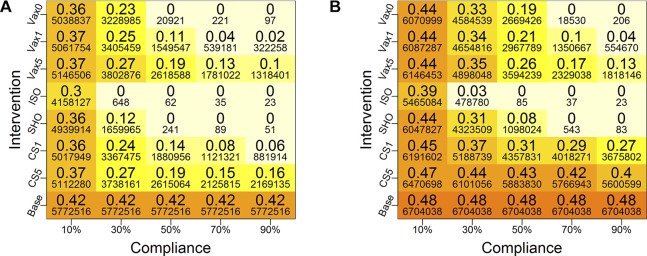
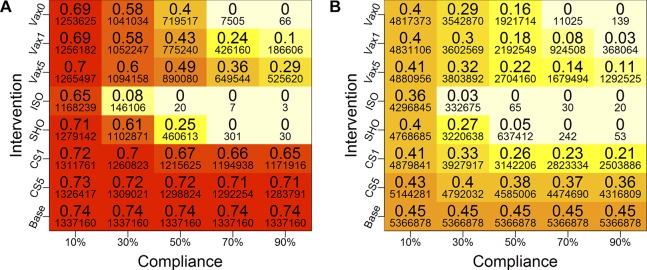
Results: Simulation-based results show that when slum attributes are ignored, the effectiveness of vaccination can be overestimated by 30%-55%, in terms of reducing the peak number of infections and the size of the epidemic, and in delaying the time to peak infection. The slum population sustains greater infection rates under all intervention scenarios in the network that treats slums differently. Vaccination strategy performs better than social distancing strategies in slums.

Conclusions: Unique characteristics of slums play a significant role in the spread of infectious diseases. Modelling slums and estimating their impact on epidemics will help policy makers and regulators more accurately prioritise allocation of scarce medical resources and implement public health policies.

Keywords: delhi; epidemic; interventions; slum population; synthetic social contact network.


Conflict of interest statement

Competing interests: None declared.

Figures

Figure 1
Figure 1
Epidemic curves for base case and vaccination case in (A) network 1 and (B) network 2. Each timepoint in the curve is an average over 25 replicates. The vaccines are given randomly to 30% of the entire population and the vaccine efficacy is 30%. For network 2, epidemic curves are shown for total population and slum and non-slum subpopulations. ‘Intervene Total’ refers to the epidemic curve of the entire Delhi population when the vaccine intervention is applied. ‘Intervene Slum’ refers to the epidemic curve for just the slum population, and ‘Intervene Non-slum’ refers to the epidemic curve for just the non-slum population for the intervention case. Epidemic curves for a variety of compliances and efficacies are reported in online supplementary figures 1 and 2. (A) Total Delhi network 1 and (B) Total Delhi network 2.
Figure 2
Figure 2
Mean cumulative infection rates for different subgroups in the two networks. Two vaccination rates (v=30%, 50%) and two vaccine efficacy rates (α=30%, 70%) are considered. Individuals are chosen at random in the entire network for vaccination on day 0. Mean infection rates are calculated within each group. The last several lines in the plot for network 1 are overlapping at the bottom because the mean infection rates are almost 0 under those scenarios. ‘Total’ refers to the entire population of Delhi. ‘Slum’ and ‘Non-slum’ refer to slum and non-slum regions, respectively. ‘Male’ and ‘Female’ denote the total number of men and women in Delhi, respectively. Age groups are denoted by ‘Preschool’, ‘School’, ‘Adult’ and ‘Senior’. (A) Total Delhi network 1 and (B) Total Delhi network 2.
Figure 3
Figure 3
Mean cumulative infection rates under different interventions for (A) network 1 and (B) network 2. The larger font numbers are fractions of populations that are infected and the smaller font numbers are counts of infected individuals. Colours of the boxes correspond to the values of the large numbers (ie, fractions of infected), and the same scheme is used for both plots for comparisons—and for all plots in this paper. Five different compliance rates are examined (10%, 30%, 50%, 70% and 90%), and four types of intervention strategies (vaccination (VAX), close-schools (CS), stay-home (SHO) and isolation (ISO)) are considered. For vaccines, three different trigger points are considered: when the cumulative infection rate reaches 0% (VAX0), 1% (VAX1) and 5% (VAX5) of the total population. The vaccine efficacy is set at 30%. For CS, two trigger points are used: when cumulative infection rate reaches 1% (CS1) and 5% (CS5). Compliant individuals are selected at random from the entire Delhi population, and the cumulative infection rates are calculated for each network. Base is the baseline case with no interventions. (A) Total Delhi network 1 and (B) Total Delhi network 2.
Figure 4
Figure 4
Heat map of cumulative infection rates in (A) slum and (B) non-slum regions of network 2 under different intervention conditions. The colours of boxes correspond to the larger numbers in the boxes—the cumulative infection rates—and the two plots use the same scheme for comparisons. Darker colours correspond to higher infection rates. The smaller font numbers are counts of infected individuals. The vaccination efficacy is fixed at 30%. Five different compliance rates (10%, 30%, 50%, 70% and 90%) and four types of intervention strategies (vaccination (VAX), close-schools (CS), stay-home (SHO) and isolation (ISO)) are considered. For vaccines, three different trigger points are considered: when cumulative infection rate reaches 0% (VAX0), 1% (VAX1) and 5% (VAX5). For CS, two trigger points are used: when the cumulative infection rate reaches 1% (CS1) and 5% (CS5). Compliant individuals are selected randomly from the entire Delhi population, and the mean infection rates are calculated separately for the slum and non-slum subpopulations. Although not reported here, qualitatively similar results are found for other transmission rates, as well as for higher vaccine efficacy (70%). Base is the baseline case with no interventions. (A) Slum region of network 2 and (B) Non-slum region of network 2.
Figure 5
Figure 5
Mean cumulative infection rates for each category listed on the x-axis, for network 2 and network 1, under four different intervention scenarios. The colour scheme of the boxes is based on the large values in the boxes—the cumulative infection rates. Darker colours correspond to higher infection rates. Smaller font values are the number of infected individuals. The vaccine efficacy is set at 30%. VsSs refers to the case when vaccines and social distancing are both applied to slum residents; VnSn refers to the case when vaccines and social distancing are applied to non-slum residents. Similarly, VsSn means vaccines are given to slums and stay-home is applied to non-slums; and VnSs means vaccines are given to non-slums and stay-home is applied to slums. Base refers to the case where no intervention is applied.

References

    1. Thompson WW, Shay DK, Weintraub E, et al. . Mortality associated with influenza and respiratory syncytial virus in the United States. JAMA 2003;289:179–86. 10.1001/jama.289.2.179 - DOI - PubMed
    1. Thompson WW, Shay DK, Weintraub E, et al. . Influenza-associated hospitalizations in the United States. JAMA 2004;292:1333–40. 10.1001/jama.292.11.1333 - DOI - PubMed
    1. Chandra N. Influenza viruses circulate in Delhi throughout the year, 2012. http://indiatoday.intoday.in/story/influenza-viruses-circulate-in-delhi-....
    1. Chen J, Chu S, Chungbaek Y, et al. . Effect of modelling slum populations on influenza spread in Delhi. BMJ Open 2016;6:e011699 10.1136/bmjopen-2016-011699 - DOI - PMC - PubMed
    1. Barrett C, Bisset K, Leidig J, et al. . Economic and social impact of influenza mitigation strategies by demographic class. Epidemics 2011;3:19–31. 10.1016/j.epidem.2010.11.002 - DOI - PMC - PubMed

Publication types

LinkOut - more resources