. 2018 Jan 22;8(1):1327.
doi: 10.1038/s41598-018-19460-5.

PI3K induces B-cell development and regulates B cell identity

Affiliations

PI3K induces B-cell development and regulates B cell identity

Hend Abdelrasoul et al. Sci Rep. .

Abstract

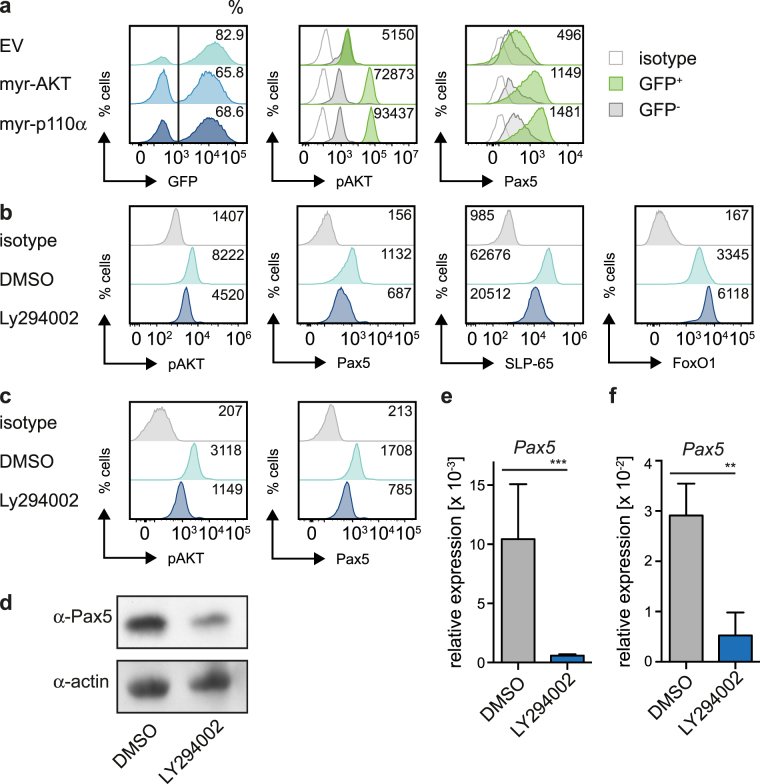
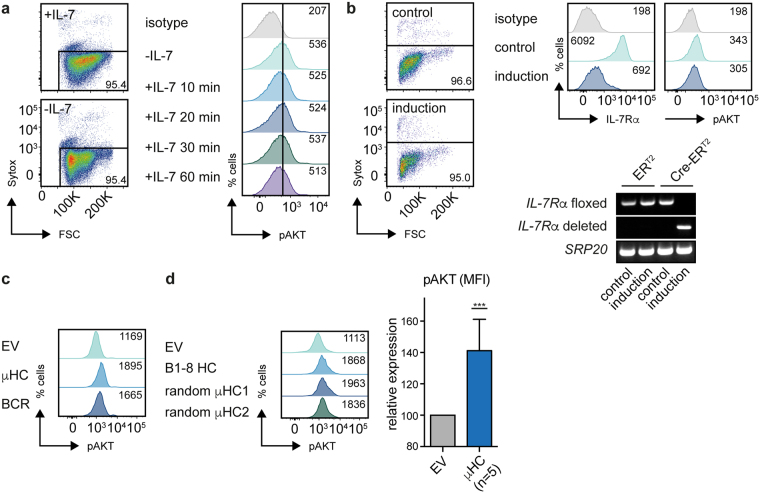
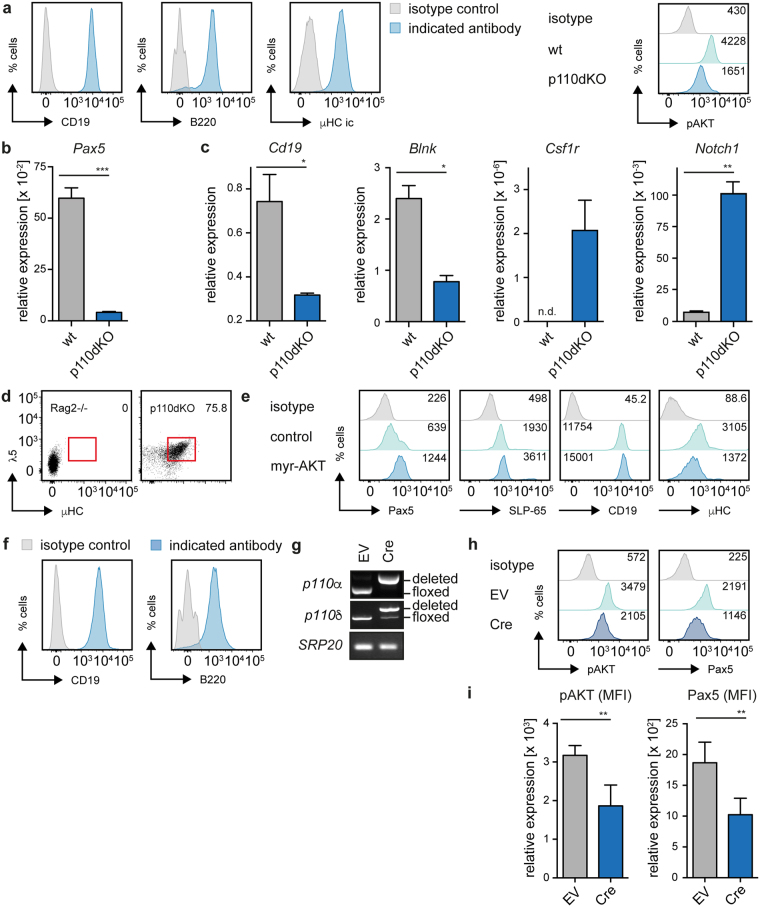
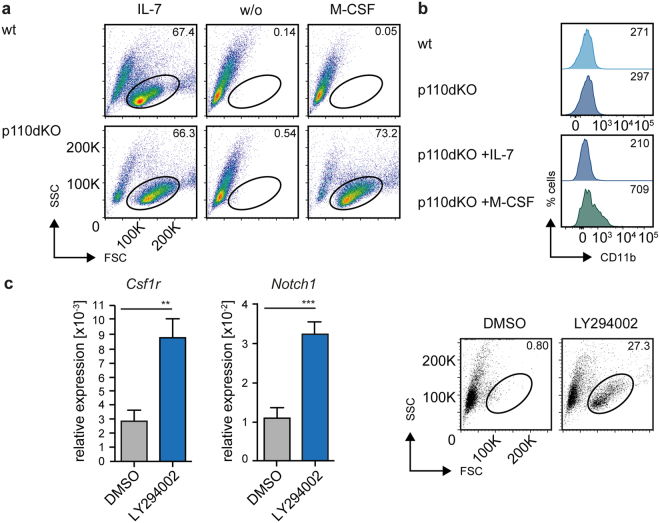
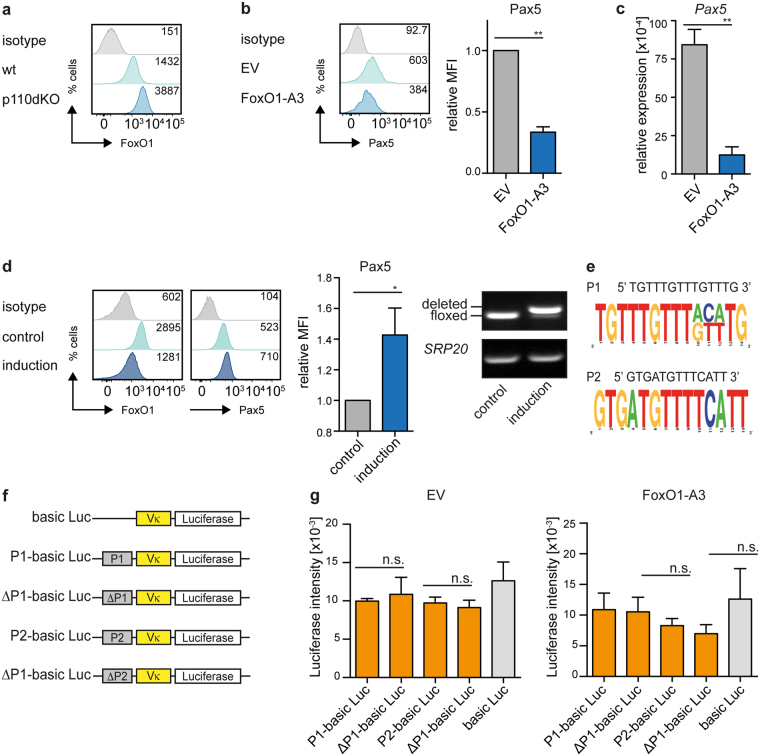
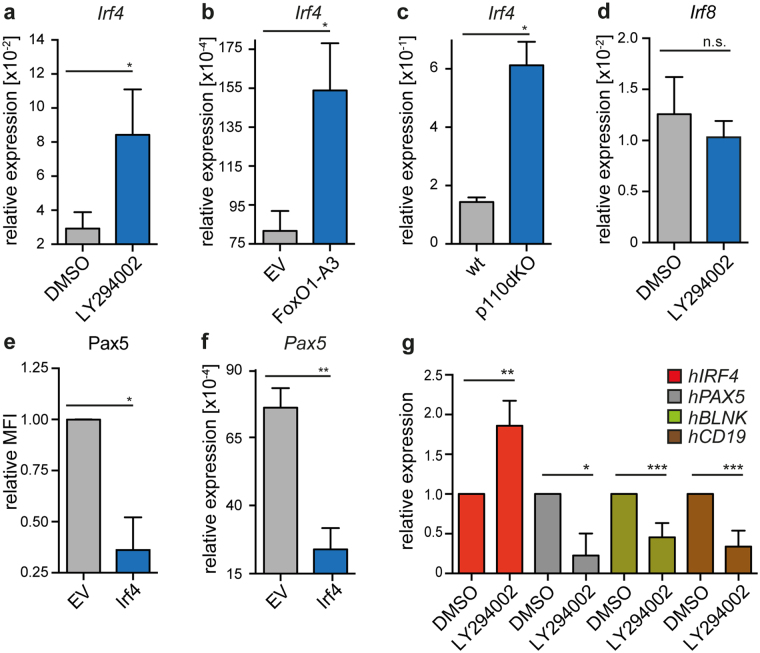
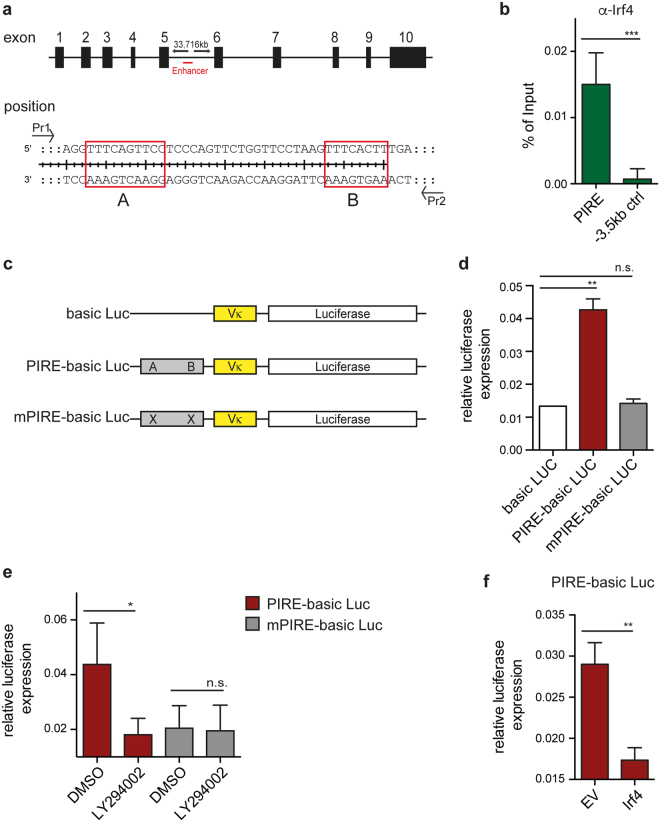
Phosphoinositide-3 kinase (PI3K) signaling is important for the survival of numerous cell types and class IA of PI3K is specifically required for the development of B cells but not for T cell development. Here, we show that class IA PI3K-mediated signals induce the expression of the transcription factor Pax5, which plays a central role in B cell commitment and differentiation by activating the expression of central B cell-specific signaling proteins such as SLP-65 and CD19. Defective class IA PI3K function leads to reduction in Pax5 expression and prevents B cell development beyond the stage expressing the precursor B cell receptor (pre-BCR). Investigating the mechanism of PI3K-induced Pax5 expression revealed that it involves a network of transcription factors including FoxO1 and Irf4 that directly binds to the Pax5 gene. Together, our results suggest that PI3K signaling links survival and differentiation of developing B cells with B cell identity and that decreased PI3K activity in pre-B cells results in reduced Pax5 expression and lineage plasticity.


Conflict of interest statement

The authors declare that they have no competing interests.

Figures

Figure 1
Figure 1
PI3K regulates Pax5 expression. (a) Cells from a bone marrow (bm)-derived wildtype (wt) pre-B cell culture were transduced with constitutively active forms of AKT (myr-AKT), p110α (myr-p110α), or as control with empty vector (EV) and analyzed for pAKT and Pax5 expression by intracellular FACS. If not indicated otherwise, numbers in the histograms state the mean fluorescence intensity (MFI) of the respective GFP+ populations. (b) Cells from a bm-derived wt pre-B cell culture were treated with LY294002 or DMSO for 16 h and analyzed for pAKT, Pax5, SLP-65 and FoxO1 expression by intracellular FACS. (c) Cells from a SLP-65-deficient pre-B cell line were treated with LY294002 or DMSO for 12 h and pAKT and Pax5 expression was analyzed by intracellular FACS. (d) Murine mature B cells (CD43) were isolated and treated with LY294002 or DMSO for 12 h, lysed and subjected to immunoblot for analysis of Pax5 expression. Actin served as a loading control. For original full-length blots see Fig. S1e. (e) Total RNA of SLP-65-deficient cells treated for 12 h with LY294002 or DMSO was isolated. Gapdh and Pax5 mRNA-levels were detected with specific primers by qRT-PCR using the SYBR-Green detection method. Results are shown as mean ± SD of 2 independent experiments, run as duplicates. Statistical significance was calculated using the t-Test. (f) Total RNA of murine mature B cells treated with LY294002 or DMSO for 12 h was isolated. Gapdh and Pax5 mRNA-levels were detected with specific primers by qRT-PCR using the SYBR-Green detection method. Results are shown as mean ± SD of 2 independent experiments, run as duplicates. Statistical significance was calculated using the Mann-Whitney Test. Data shown in Fig. 1a–d are representative of at least 3 independent experiments.
Figure 2
Figure 2
Pre-BCR activates PI3K signaling, whereas IL-7R does not. (a) Cells from a bm-derived wt pre-B cell line were cultured overnight in presence or absence of IL-7. Viability of the cells was assessed by Sytox staining (left panel). Levels of pAKT were measured by FACS at the indicated time points following addition of IL-7 (10 ng/ml) (right panel). Numbers in the dot plots indicate the percentages, numbers in the histogram plots indicate the MFI. (b) Cells from an IL-7Rαfl/fl bm-derived pre-B cell line were transduced with a 4-hydroxytamoxifen (4-OHT)-inducible form of Cre-recombinase (Cre-ERT2) or ERT2 as EV and treated with 4-OHT (induction) or EtOH (control) for 48 h. Viability of the cells was assessed by Sytox staining (left). Surface levels of IL-7Rα as well as intracellular levels of pAKT were determined by FACS analysis (right, top). Additionally, Cre-mediated deletion was confirmed by PCR using specific primers detecting the floxed or deleted IL-7Rα allele (right, bottom). PCR for SRP20 was used as loading control. For original full-length gel pictures see Figure S2b. (c) Cells from a Rag2-deficient pro-B cell line were retrovirally transduced with μHC (B1-8 HC), or μHC + λLC (BCR) and levels of pAKT were measured at day 2 upon transduction by FACS. Numbers in the histogram plots indicate the MFI. (d) Indicated μHCs were introduced into cells from a Rag2-deficient pro-B cell line as in (c) and analyzed at day 1 post transduction for levels of pAKT by FACS (left). Numbers in the histogram plots indicate the MFI. Indicated μHCs were expressed at least 3 times and the average MFI of pAKT FACS-analysis over all experiments is shown (right). Statistical significance was calculated using the t-Test. Data shown in Fig. 2a,b are representative of at least 3 independent experiments.
Figure 3
Figure 3
PI3K-deficient cells are blocked in differentiation and show imperfect B lineage commitment. (a) p110dKO cells were stained for CD19, B220 (both surface) and μHC (ic, intracellular) or the respective isotype control and analyzed by FACS (left panel). Cells from bm-derived wt and p110dKO pre-B cell lines were analyzed for pAKT levels by intracellular FACS (right panel). (b,c) Total RNA was isolated from bm-derived wt and p110dKO pre-B cell cultures to analyze Pax5, Cd19, Blnk, Csf1r and Notch1 mRNA levels with specific primers by qRT-PCR using the SYBR-Green detection method. Results are shown as mean ± SD of 2 independent analyses, run as duplicates. Statistical significance was calculated using the Mann-Whitney Test or the t-Test. (d) FACS analysis of p110dKO cells for surface expression of the pre-BCR components μHC and λ5. Cells from a Rag2-deficient B cell culture served as negative control. Numbers indicate percentages of cells in the respective region. (e) p110dKO cells were retrovirally transduced with myr-AKT or the EV. Expression of Pax5, SLP-65 (both intracellular), CD19 and μHC (both surface) was analyzed by FACS at day 2 after transduction and compared with expression in untransduced bystander cells (control). Data are representative of at least 3 independent experiments. n. d.: not detectable. (f) An IL-7 dependent pre-B cell line was established from bm of p110αfl/fl/p110δfl/fl mice. The respective cells were characterized by surface staining for CD19 and B220, or the respective isotype control and analyzed by flow cytometry. (g) Cells described in Fig. 3f were retrovirally transduced with a Cre-encoding expression vector or EV, respectively. Cre-mediated deletion of p110α and δ was confirmed by PCR using specific primers detecting floxed or deleted alleles. PCR for SRP20 served as loading control. For original full-length gel pictures see Figure S4c. (h) Cells described in Fig. 3f were retrovirally transduced with a Cre-encoding expression vector or EV, respectively, and analyzed by intracellular FACS for pAKT and Pax5 expression. Numbers in the histogram plots indicate the MFI, depicted data are representative of at least 4 independent experiments. (i) Average MFIs of pAKT and Pax5 following Cre-mediated p110α and p110δ deletion. Results are shown as mean ± SD of 4 independent experiments. Statistical significance was calculated using the t-Test.
Figure 4
Figure 4
PI3K signaling regulates B cell commitment and plasticity. (a) Cells from bm-derived wt and p110dKO pre-B cell lines were cultured either in the presence of IL-7, M-CSF, or without cytokines and analyzed by flow cytometry. Numbers indicate percentages of cells in the respective regions at day 7 after beginning of treatment. (Data are representative of at least 3 independent experiments). (b) FACS-analysis of CD11b expression of measured in cells from bm-derived wt and p110dKO pre-B cell lines cultured in the presence of IL-7 (upper panel). p110dKO cells were cultured in IL-7 or M-CSF supplemented medium and CD11b expression was assessed by FACS analysis at day 8 after beginning of treatment (lower panel). (c) Cells from a bm-derived SLP-65-deficient pre-B cell line were treated with LY294002 (30 μM) or solvent (DMSO) for 16 h and subsequently cultured in medium supplemented with M-CSF. Csf1r and Notch1 mRNA levels were determined with specific primers by qRT-PCR using the SYBR-Green detection method (left panel). Results are shown as mean ± SD of 2 independent analyses, run as duplicates. Statistical significance was calculated using the Mann-Whitney Test or the t-Test. Cells from the respective culture conditions were further analyzed by flow cytometry (right panel).
Figure 5
Figure 5
PI3K regulates Pax5 via FoxO1. (a) Cells from bm-derived wt and p110dKO pre-B cell lines were analyzed by intracellular FACS for FoxO1. (b) Cells from a bm-derived wt pre-B cell line were transduced with a constitutively active form of FoxO1 (FoxO1-A3) or an EV control. Expression of Pax5 was assessed by intracellular FACS at day 2 after transduction in at least 3 independent experiments. Statistical significance was calculated using the t-Test. (c) Total RNA of cells from Fig. 5b was isolated to analyze transcript levels of Pax5. Hprt and Pax5 mRNA-levels were detected by qRT-PCR using the SYBR-Green detection method. Results are shown as mean ± SD of 2 independent experiments, run as duplicates. Statistical significance was calculated using the t-Test. (d) Cells from a FoxO1fl/fl bm-derived pre-B cell line were transduced with Cre-ERT2 or -ERT2. 4-OHT was applied to activate the Cre-ERT2 (induction), treatment with EtOH served as control. Expression levels of FoxO1 and Pax5 were analyzed by intracellular flow cytometry (left panel). The MFI of Pax5 upon deletion of FoxO1 was quantified (bar diagram). Statistical significance was calculated using the t-test. Deletion of the floxed FoxO1 allele was confirmed by PCR, SRP20 served as loading control (right). For original full-length gel pictures see Fig. S2d. Depicted data are representative of at least 3 independent experiments. (e) Sequences of two FoxO1-binding motifs identified by the Encode Genome Project. Site 1 (P1) is located in intron 5, site 2 (P2) in intron 9 of the murine Pax5 gene. P1 and P2 are highly conserved between man and mouse. Graphs were prepared using the WebLogo software. (f) Schematic overview of the luciferase expression vector harboring a Vκ21 promoter and a 1 kb fragment containing or lacking the potential FoxO1 binding sites shown in Fig. 5e. (g) WEHI cells were electroporated to introduce the empty vector (Vκ + Luciferase) or the indicated constructs containing or lacking the potential FoxO1 binding sites. Expression of luciferase was equalized to the rLUC(Renilla) expression in each sample and WEHI cells were cotransfected either with EV (CMV-EV) or with a vector encoding FoxO1-A3 (CMV-FoxO1-A3). Data are representative of 3 (EV) and 4 (FoxO1-A3) independent experiments and luciferase expression was determined using the Dual-Luciferase Reporter Assay System (Promega).
Figure 6
Figure 6
FoxO1 induces Irf4 to repress Pax5. (a) Total RNA from a SLP-65-deficient pre-B cell line, treated with LY294002 or DMSO for 12 h, was isolated. Hprt and Irf4 mRNA-levels were detected with specific primers by qRT-PCR using the SYBR-Green detection method (n = 5). (b) Cells from a bm-derived wt pre-B cell line were transduced with FoxO1-A3 or EV and at day 1 post transduction total RNA was isolated. Expression of Hprt and Irf4 mRNA-levels were detected by qRT-PCR using a SYBR-Green detection method (n = 3). (c) Total RNA from p110dKO and bm-derived wt pre-B cell lines was analyzed for Hprt and Irf4 transcript levels by qRT-PCR using the SYBR-Green detection method (n = 3). (d) Hprt and Irf8 mRNA-levels were detected in RNA from Fig. 6a with specific primers by qRT-PCR using the SYBR-Green detection method (n = 5). (e) Similar to FoxO1-A3 in Fig. 5b, cells from a bm-derived wt pre-B cell line were transduced with Irf4 or EV and Pax5 expression was analyzed at day 2 after transduction by intracellular FACS. (f) Total RNA of cells from Fig. 6e was isolated to analyze transcript levels of Pax5. Hprt and Pax5 mRNA-levels were detected by qRT-PCR using the SYBR-Green detection method (n = 3). (g) Human mature B cells from peripheral blood were isolated, treated with LY294002 and analyzed for IRF4, PAX5, BLNK and CD19 transcripts (n = 3). Results are shown as mean ± SD, run as duplicates. Data are representative of 2 (c) or at least 3 (a,b, d–g) independent experiments. Statistical significance was calculated using the t-Test.
Figure 7
Figure 7
Irf4 directly represses Pax5 expression. (a) Schematic overview showing the location of the Pax5 enhancer region within the Pax5 gene locus. (b) Irf-4 ChIP from cells of a SLP-65-deficient pre-B cell line. Amplified by qPCR was the enhancer region of Pax5 within exon 5 containing Irf4-binding sites (A and B). As control, amplification of a region 3.5 kb upstream of Pax5 enhancer was chosen. Both samples were normalized to mock control. (c) Schematic overview of the luciferase expression vector harboring a Vκ promoter and the respective Pax5 enhancer region containing or lacking the Irf4 binding sites. (d–f) WEHI cells were electroporated to introduce the empty vector (Vκ + Luciferase) or the indicated constructs containing or lacking the Irf4 binding sites. Expression of luciferase was equalized to the rLUC (Renilla) expression in each sample of co-transfected WEHI cells. In (e), WEHI cells were treated for 16 h with LY294002 upon electroporation and in (f), WEHI cells were co-transfected with either EV or with a vector encoding Irf4. Data are representative of at least 3 independent experiments and luciferase expression was determined using the Dual-Luciferase Reporter Assay System.

References

    1. Hardy RR, Hayakawa K. B cell development pathways. Annu Rev Immunol. 2001;19:595–621. doi: 10.1146/annurev.immunol.19.1.595. - DOI - PubMed
    1. Cobaleda C, Schebesta A, Delogu A, Busslinger M. Pax5: the guardian of B cell identity and function. Nat Immunol. 2007;8:463–470. doi: 10.1038/ni1454. - DOI - PubMed
    1. Kozmik Z, Wang S, Dorfler P, Adams B, Busslinger M. The promoter of the CD19 gene is a target for the B-cell-specific transcription factor BSAP. Mol Cell Biol. 1992;12:2662–2672. doi: 10.1128/MCB.12.6.2662. - DOI - PMC - PubMed
    1. Schebesta M, Pfeffer PL, Busslinger M. Control of pre-BCR signaling by Pax5-dependent activation of the BLNK gene. Immunity. 2002;17:473–485. doi: 10.1016/S1074-7613(02)00418-1. - DOI - PubMed
    1. Jumaa H, Hendriks RW, Reth M. B cell signaling and tumorigenesis. Annu Rev Immunol. 2005;23:415–445. doi: 10.1146/annurev.immunol.23.021704.115606. - DOI - PubMed

Publication types