. 2018 Jan 22;9(1):323.
doi: 10.1038/s41467-017-02598-7.

An integrated multi-layer 3D-fabrication of PDA/RGD coated graphene loaded PCL nanoscaffold for peripheral nerve restoration

Affiliations

An integrated multi-layer 3D-fabrication of PDA/RGD coated graphene loaded PCL nanoscaffold for peripheral nerve restoration

Yun Qian et al. Nat Commun. .

Abstract

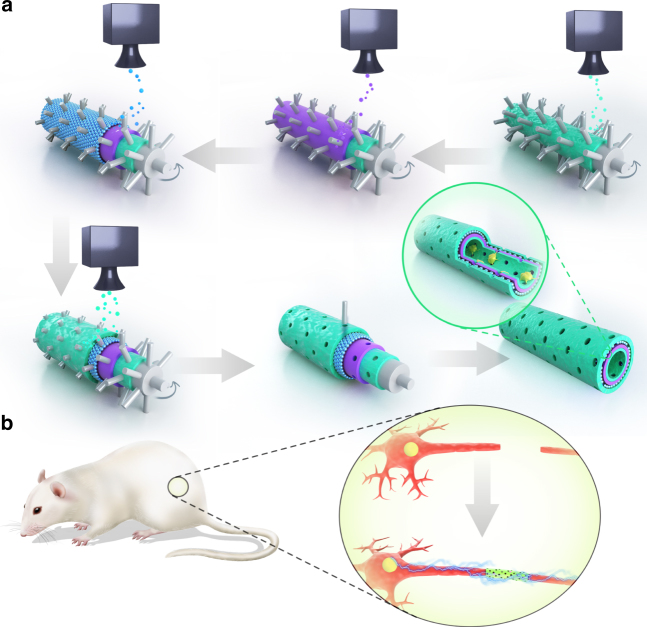
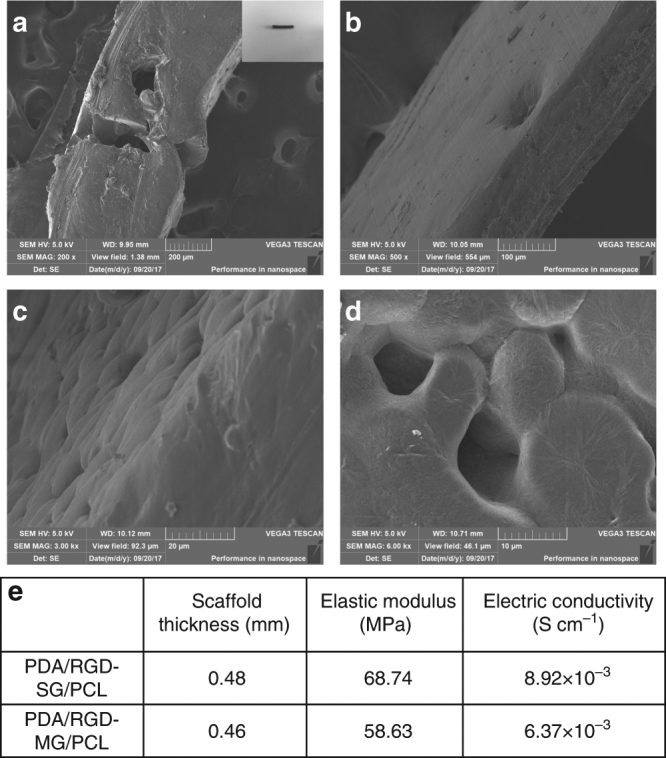
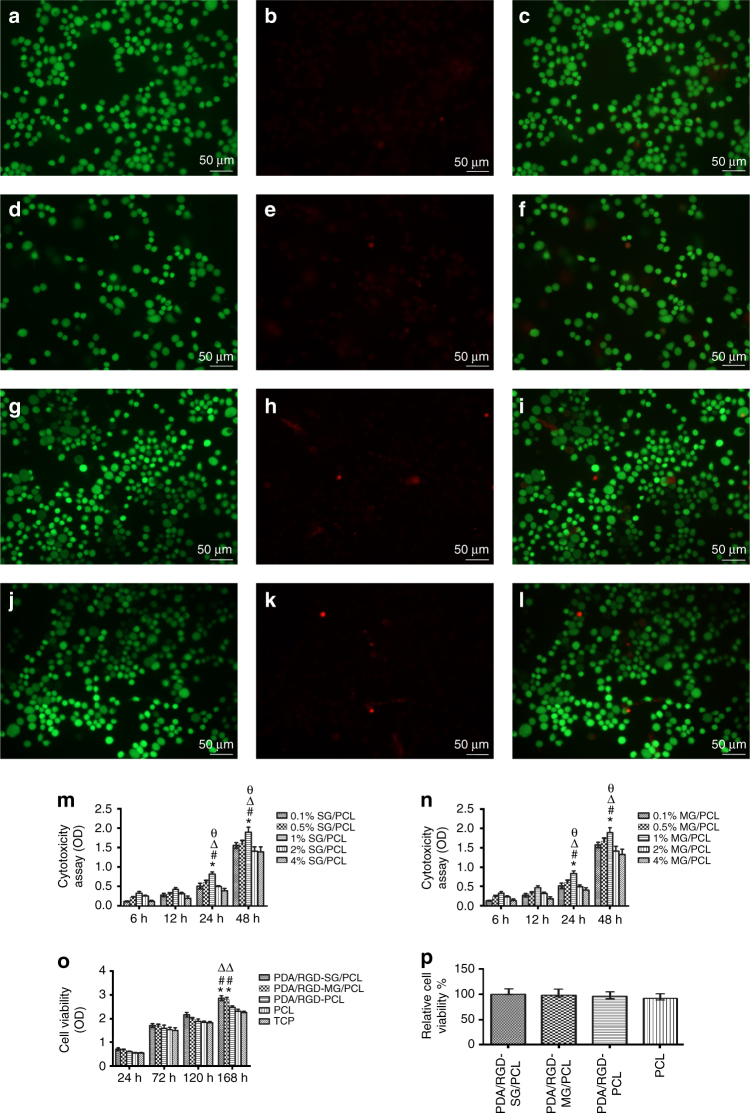
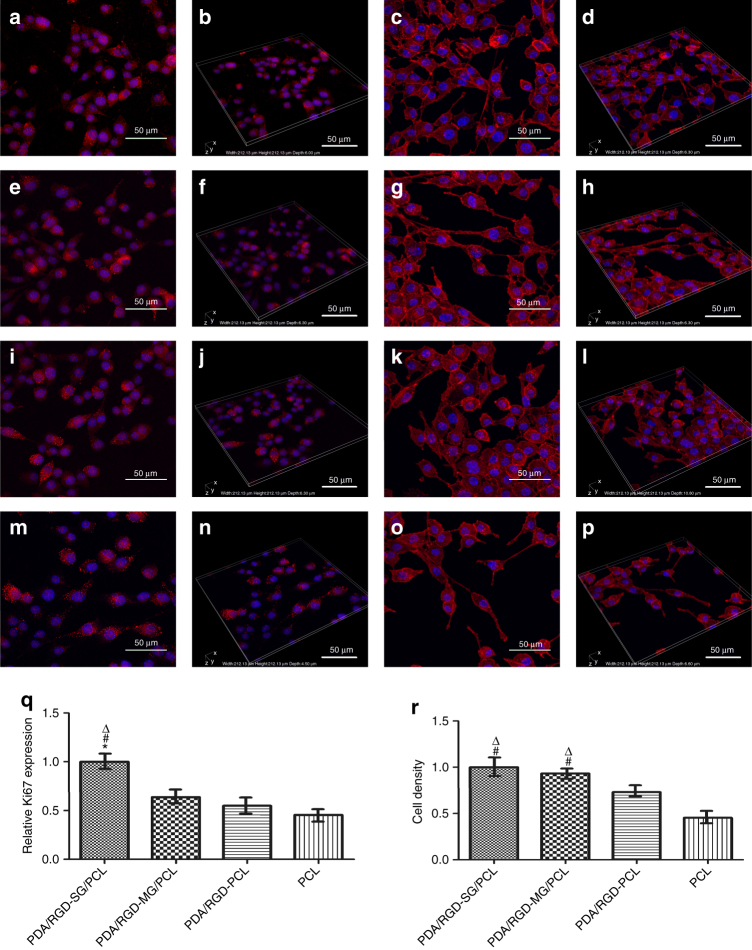
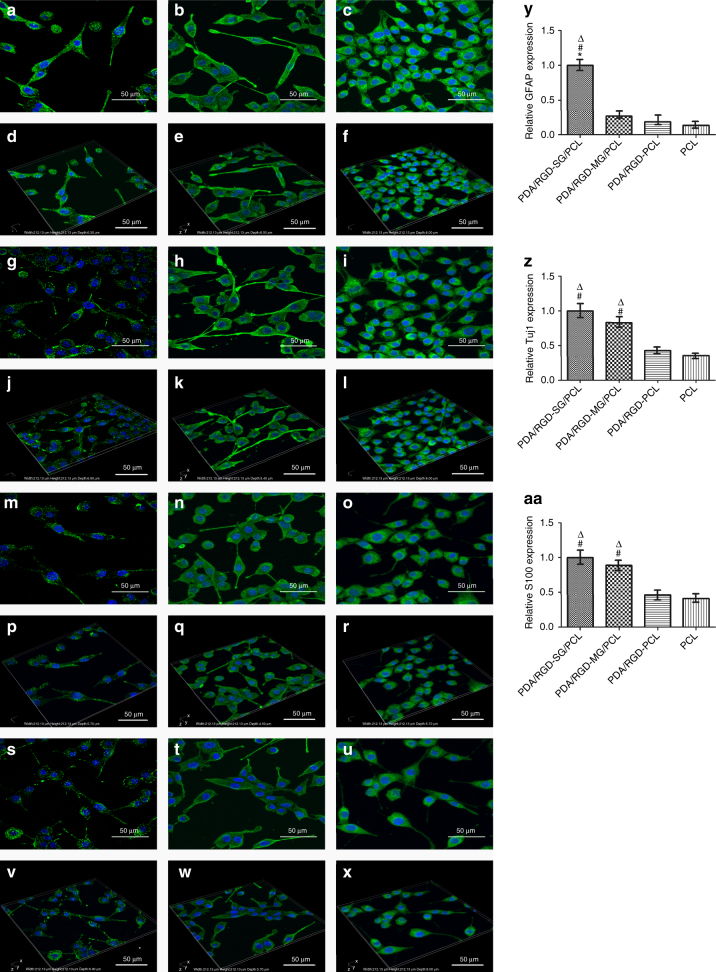
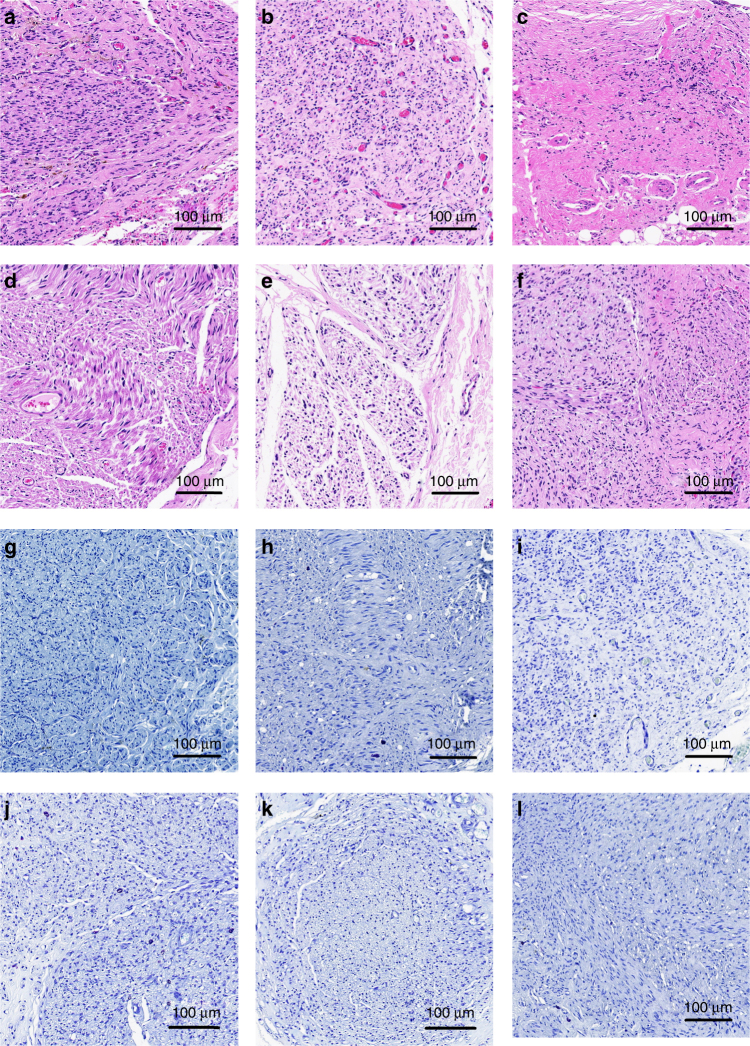
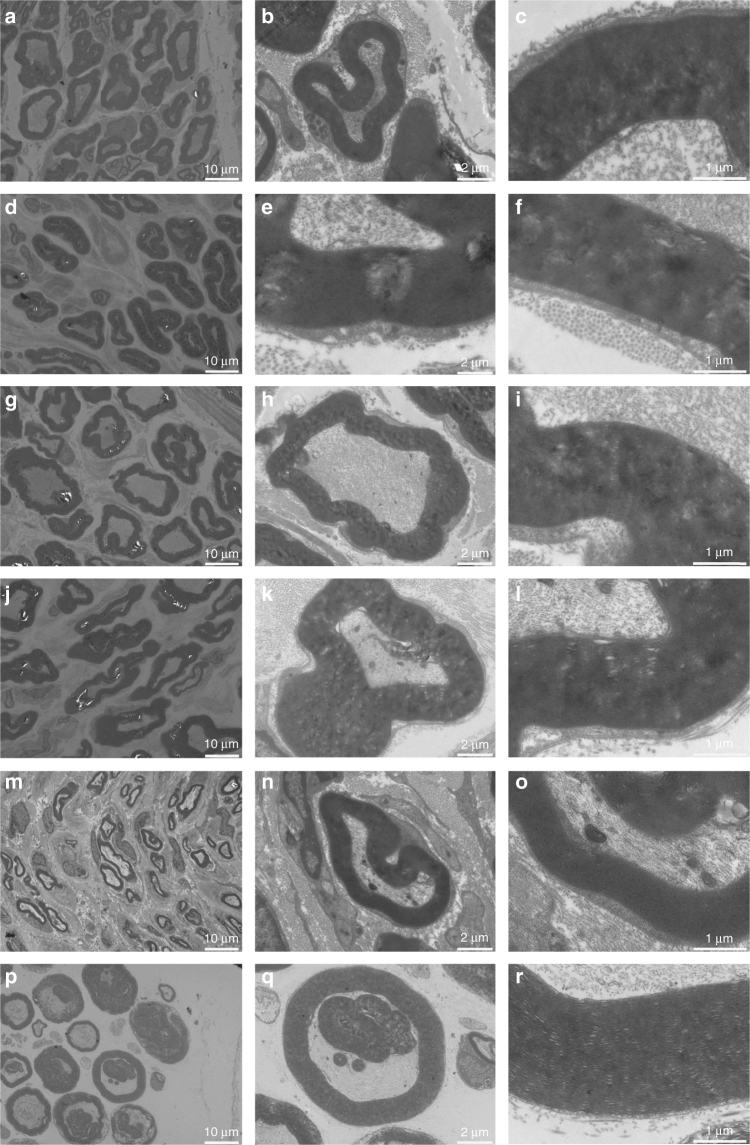
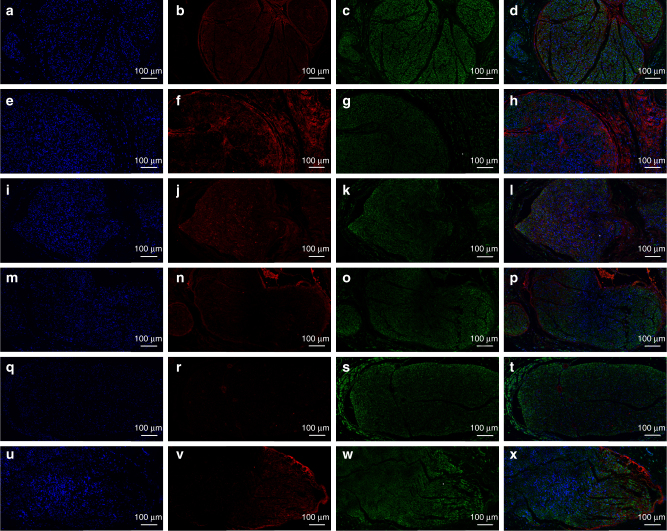
As a conductive nanomaterial, graphene has huge potentials in nerve function restoration by promoting electrical signal transduction and metabolic activities with unique topological properties. Polydopamine (PDA) and arginylglycylaspartic acid (RGD) can improve cell adhesion in tissue engineering. Here we report an integrated 3D printing and layer-by-layer casting (LBLC) method in multi-layered porous scaffold fabrication. The scaffold is composed of single-layered graphene (SG) or multi-layered graphene (MG) and polycaprolactone (PCL). The electrically conductive 3D graphene scaffold can significantly improve neural expression both in vitro and in vivo. It promotes successful axonal regrowth and remyelination after peripheral nerve injury. These findings implicate that graphene-based nanotechnology have great potentials in peripheral nerve restoration in preclinical and clinical application.


Conflict of interest statement

The authors declare no competing financial interests.

Figures

Fig. 1
Fig. 1
Schematic illustration of graphene nerve conduit fabrication with LBLC method. a The inner-most and outer-most green layers are PDA/RGD mixed layers. The purple layer is single-layered or multi-layered graphene and PCL mixed layer. The blue layer is a repetition of the graphene and PCL mixed layer. b An illustration of the single-layered or multi-layered graphene/PCL nerve conduit in a sciatic nerve defect model in the SD rats
Fig. 2
Fig. 2
Characterization of graphene nerve conduit. ad SEM images for evaluation of the nanoporous and multi-layered 3D structure in graphene-based nanomaterials. e Thickness, elastic modulus, and electric conductivity of PDA/RGD-SG/PCL and PDA/RGD-MG/PCL scaffolds (evaluation of both materials was repeated for five times)
Fig. 3
Fig. 3
Cell viability assay of LIVE/DEAD cell staining and CCK8. ac Live/dead/merge pictures for PDA/RGD-SG/PCL. df Live/dead/merge pictures for PDA/RGD-MG/PCL. gi Live/dead/merge pictures for PDA/RGD-PCL. jl Live/dead/merge pictures for PCL. The scale bar is 50 μm. m Cytotoxicity assay for 0.1%, 0.5%, 1%, 2%, and 4% SG/PCL at different time points. n Cytotoxicity assay for 0.1%, 0.5%, 1%, 2%, and 4% SG/PCL at different time points. *p < 0.05 compared with 0.1% SG(MG)/PCL; #p < 0.05 compared with 0.5% SG(MG)/PCL; Δp < 0.05 compared with 2% SG(MG)/PCL. фp < 0.05 compared with 4% SG(MG)/PCL. o CCK8 assay for five groups. p Relative cell viability by live and dead staining. All data are displayed as mean ± standard deviation. *p < 0.05 compared with PDA/RGD-PCL; #p < 0.05 compared with PCL; Δp < 0.05 compared with TCP (the statistical test is ANOVA)
Fig. 4
Fig. 4
Gene expression compared between nanoscaffolds. a WB assay of Ki67, Brdu, GFAP, Tuj1, N-cadherin, and vinculin. bg Their relative expression from SC seeded PDA/RGD-SG/PCL, PDA/RGD-MG/PCL, PDA/RGD-PCL, and PCL nanoscaffolds. All data are displayed as mean ± standard deviation. *p < 0.05 compared with PDA/RGD-MG/PCL; #p < 0.05 compared with PDA/RGD-PCL; Δp < 0.05 compared with PCL (the statistical test is ANOVA)
Fig. 5
Fig. 5
Immunofluorescent staining for Ki67 and F-actin. a, b Ki67 expression of SC on PDA/RGD-SG/PCL. e, f Ki67 expression of SC on PDA/RGD-MG/PCL. i, j Ki67 expression of SC on PDA/RGD-PCL. m, n Ki67 expression of SC on PCL. c, d Phalloidin staining on PDA/RGD-SG/PCL. g, h Phalloidin staining on PDA/RGD-MG/PCL. k, l Phalloidin staining on PDA/RGD-PCL. o, p Phalloidin staining on PCL. q Relative expression of Ki67. r Cell density evaluation from phalloidin staining. The scale bar is 50 μm. All data are displayed as mean ± standard deviation. *p < 0.05 compared with PDA/RGD-MG/PCL; #p < 0.05 compared with PDA/RGD-PCL; Δp < 0.05 compared with PCL (the statistical test is ANOVA)
Fig. 6
Fig. 6
Immunofluorescent staining for GFAP, Tuj1, and S100. a, d GFAP expression of SC on PDA/RGD-SG/PCL. g, j GFAP expression of SC on PDA/RGD-MG/PCL. m, p GFAP expression of SC on PDA/RGD-PCL. s, v GFAP expression of SC on PCL. b, e Tuj1 expression of SC on PDA/RGD-SG/PCL. h, k Tuj1 expression of SC on PDA/RGD-MG/PCL. n, q Tuj1 expression of SC on PDA/RGD-PCL. t, w Tuj1 expression of SC on PCL. c, f S100 expression of SC on PDA/RGD-SG/PCL. i, l S100 expression of SC on PDA/RGD-MG/PCL. o, r S100 expression of SC on PDA/RGD-PCL. u, x S100 expression of SC on PCL. y Relative GFAP expression. z Relative Tuj1 expression. aa Relative S100 expression. The scale bar is 50 μm. All data are displayed as mean ± standard deviation. *p < 0.05 compared with PDA/RGD-MG/PCL; #p < 0.05 compared with PDA/RGD-PCL; Δp < 0.05 compared with PCL (the statistical test is ANOVA)
Fig. 7
Fig. 7
Nerve regeneration at 18 weeks postoperatively. HE (af) and TB (gl) staining for regenerated nerves at 18 weeks post operatively. a, g SC-loaded PDA/RGD-SG/PCL. b, h SC-loaded PDA/RGD-MG/PCL. c, i PDA/RGD-SG/PCL. d, j PDA/RGD-MG/PCL. e, k PDA/RGD-PCL. f, l Autograft. The scale bar is 100 μm
Fig. 8
Fig. 8
TEM for regenerated myelinated axons at 18 weeks post operatively. ac SC-loaded PDA/RGD-SG/PCL. df SC-loaded PDA/RGD-MG/PCL. gi PDA/RGD-SG/PCL. jl PDA/RGD-MG/PCL. mo PDA/RGD-PCL. pr Autograft. The scale bar in a, d, g, j, m, and p is 10 μm. The scale bar in b, e, h, k, n, and q is 2 μm. The scale bar in c, f, i, l, o, and r is 1 μm
Fig. 9
Fig. 9
Triple immunofluorescent staining of Tuj1 and NF200 at 18 weeks post operatively. Tuj1 (green), NF200 (red), and nuclei (blue) were exhibited from different groups respectively. ad SC-loaded PDA/RGD-SG/PCL. eh SC-loaded PDA/RGD-MG/PCL. il PDA/RGD-SG/PCL. mp PDA/RGD-MG/PCL. qt PDA/RGD-PCL. ux Autograft. The scale bar is 100 μm
Fig. 10
Fig. 10
Triple immunofluorescent staining of S100 and MBP at 18 weeks post operatively. S100 (green), MBP (red), and nuclei (blue) were exhibited from different groups respectively. ad SC-loaded PDA/RGD-SG/PCL. eh SC-loaded PDA/RGD-MG/PCL. il PDA/RGD-SG/PCL. mp PDA/RGD-MG/PCL. qt PDA/RGD-PCL. ux Autograft. The scale bar is 100 μm

References

    1. Schmidt CE, Leach JB. Neural tissue engineering: strategies for repair and regeneration. Annu. Rev. Biomed. Eng. 2003;5:293–347. doi: 10.1146/annurev.bioeng.5.011303.120731. - DOI - PubMed
    1. Mu Y, Wu F, Lu Y, Wei L, Yuan W. Progress of electrospun fibers as nerve conduits for neural tissue repair. Nanomedicine. 2014;9:1869–1883. doi: 10.2217/nnm.14.70. - DOI - PubMed
    1. Reid AJ, et al. Long term peripheral nerve regeneration using a novel PCL nerve conduit. Neurosci. Lett. 2013;544:125–130. doi: 10.1016/j.neulet.2013.04.001. - DOI - PubMed
    1. Lee BK, et al. End-to-side neurorrhaphy using an electrospun PCL/collagen nerve conduit for complex peripheral motor nerve regeneration. Biomaterials. 2012;33:9027–9036. doi: 10.1016/j.biomaterials.2012.09.008. - DOI - PubMed
    1. Sun M, et al. In vitro and in vivo testing of novel ultrathin PCL and PCL/PLA blend films as peripheral nerve conduit. J. Biomed. Mater. Res. A. 2010;93:1470–1481. - PubMed

Publication types

MeSH terms