. 2018 Feb;21(2):218-227.
doi: 10.1038/s41593-017-0064-2. Epub 2018 Jan 22.

Inhibitory circuit gating of auditory critical-period plasticity

Affiliations

Inhibitory circuit gating of auditory critical-period plasticity

Anne E Takesian et al. Nat Neurosci. 2018 Feb.

Erratum in

Abstract

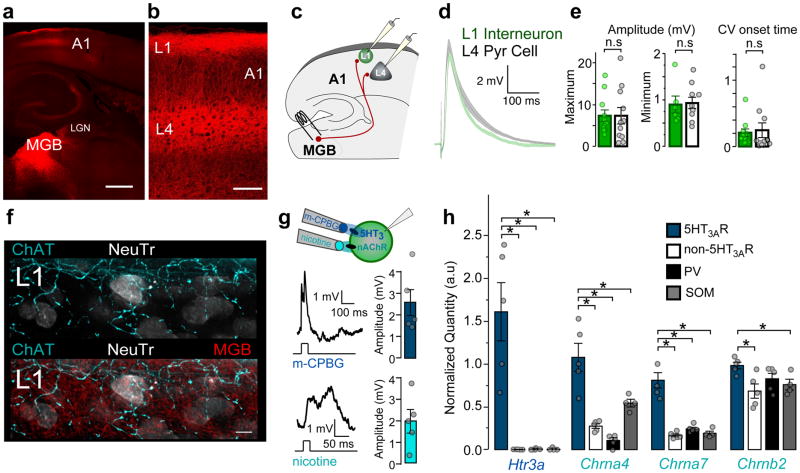
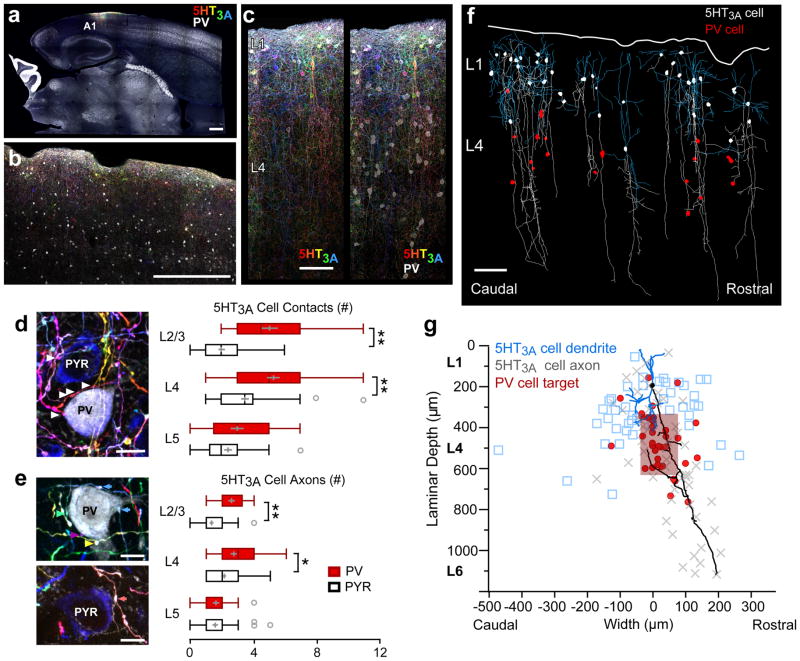
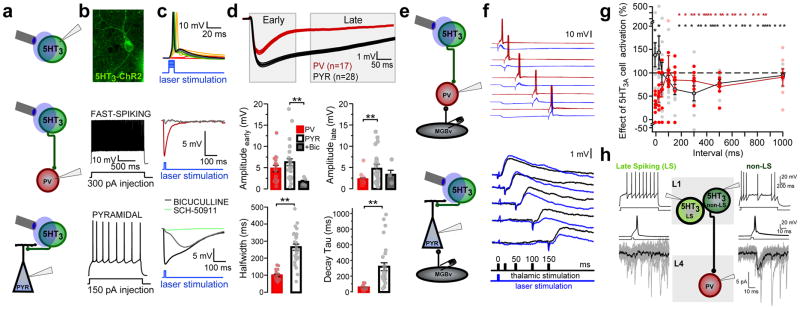
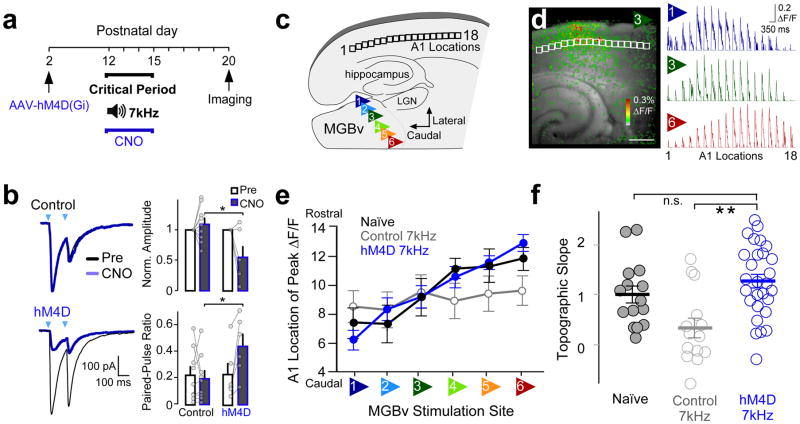
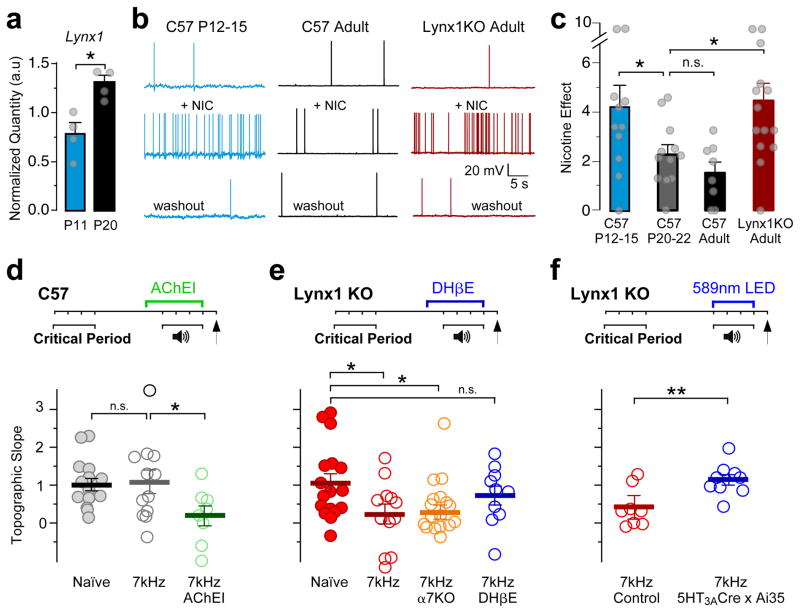
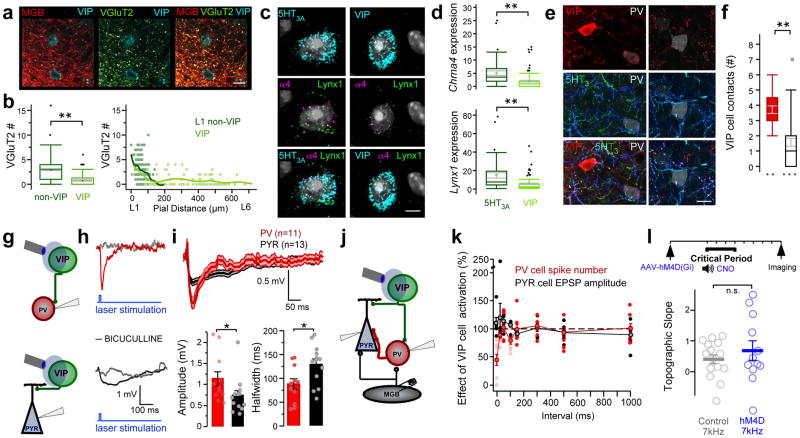
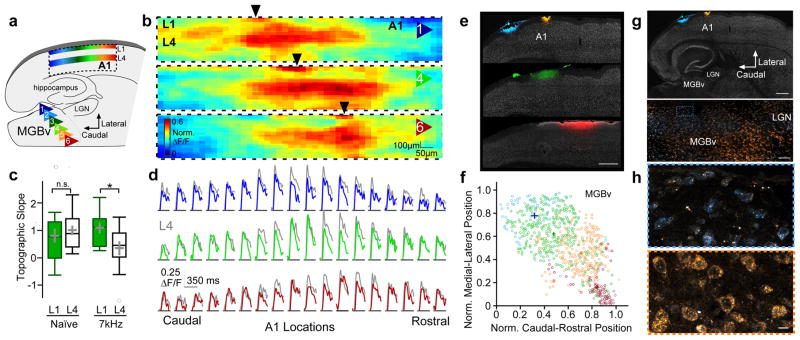
Cortical sensory maps are remodeled during early life to adapt to the surrounding environment. Both sensory and contextual signals are important for induction of this plasticity, but how these signals converge to sculpt developing thalamocortical circuits remains largely unknown. Here we show that layer 1 (L1) of primary auditory cortex (A1) is a key hub where neuromodulatory and topographically organized thalamic inputs meet to tune the cortical layers below. Inhibitory interneurons in L1 send narrowly descending projections to differentially modulate thalamic drive to pyramidal and parvalbumin-expressing (PV) cells in L4, creating brief windows of intracolumnar activation. Silencing of L1 (but not VIP-expressing) cells abolishes map plasticity during the tonotopic critical period. Developmental transitions in nicotinic acetylcholine receptor (nAChR) sensitivity in these cells caused by Lynx1 protein can be overridden to extend critical-period closure. Notably, thalamocortical maps in L1 are themselves stable, and serve as a scaffold for cortical plasticity throughout life.


Conflict of interest statement

COMPETING FINANCIAL INTERESTS

The authors declare no competing financial interests.

Figures

Figure 1
Figure 1. MGB and neuromodulatory inputs converge onto superficial 5-HT3AR interneurons
(a,b) Projections from the medial geniculate body (MGB; red) to layers (L1) 1 and 4 of primary auditory cortex (A1). Scale bars = 500 μm, 100 μm. Representative image from one of 4 mice. (c) 5-HT3AR cells receive direct MGB inputs. Schematic illustrating recording configuration. (d) Mean (± SEM, shaded region) EPSPs recorded in all L1 interneurons (green) and L4 pyramidal cells (gray) in response to electrical MGB fiber stimulation (L1, n = 11 cells/4 mice, L4, n = 11 cells/4 mice). (e) Left; Mean (± SEM) EPSP amplitudes evoked by maximal and minimal MGB fiber stimulation (EPSP maximum amplitude (mV): L1 = 6.91 ± 1.14, n = 11 cells/4 mice; L4 = 7.33 ± 1.96, n = 11 cells/4 mice; unpaired t test, two-tailed, t(20) = 0.19, P = 0.854; EPSP minimum amplitude (mV): L1 = 0.90 ± 0.18, n = 6 cells/4 mice; L4 = 0.94 ± 0.12, n = 10 cells/4 mice; Mann-Whitney U test, two-tailed, z = −0.27, P = 0.786). Right; Mean (± SEM) coefficient of variation (CV) of EPSP onset time (CV: L1 = 0.20 ± 0.06, n = 11 cells/4 mice; L4 = 0.25 ± 0.11, n = 11 cells/4 mice; Mann-Whitney U test, two-tailed z = −1.18, P = 0.237). (f) ChAT-expressing (cyan) and MGB axons (red) target L1 cells in A1 identified with Neurotrace (NeuTr, white). Scale bar = 5 μm. Representative image from one of 4 mice. (g) 5-HT3AR interneurons are depolarized by ionotropic 5-HT3 and nicotinic acetylcholine receptors (nAChRs). Left; Representative EPSPs evoked by focal application of nicotine or m-CPBG (100μM) recorded in 5-HT3AR cells within L1 of A1. Right; Mean (± SEM) EPSP amplitudes (m-CPBG, 2.56 ± 0.64 mV, n = 5 cells/2 mice; nicotine, 1.99 ± 0.54 mV, n = 5 cells/2 mice). (h) Expression of Htr3a, Chrna4, Chrna7, and Chrnb2 encoding 5-HT3AR and nAChR subunits (α7, α4, and β2) measured within cortical interneuron subtypes using fluorescent-activated cell sorting (FACS) or A1 cells not expressing GFP after sorting 5-HT3AR cells. (Normalized quantity Htr3a: 5-HT3AR = 1.61 ± 0.34; non-5-HT3AR = 0.002 ± 0.0007; PV = 0.005 ± 0.004; SST = 0.007 ± 0.007; Kruskal-Wallis, χ2(3) = 11.29, P = 0.010, compared to 5-HT3AR using Steel test, non-5-HT3AR, P = 0.033; PV, P = 0.033; SST, P = 0.048; Normalized quantity Chrna4: 5-HT3AR = 1.08 ± 0.16; non-5-HT3AR = 0.27 ± 0.03; PV = 0.10 ± 0.03; SST = 0.54 ± 0.05; one-way ANOVA, F(3,15) = 22.95, P < 0.0001, compared to 5-HT3AR using Dunnett’s test, non-5-HT3AR, P < 0.0001; PV, P < 0.0001; SST, P = 0.003; Normalized quantity Chrna7: 5-HT3AR = 0.81 ± 0.09; non-5-HT3AR = 0.17 ± 0.02; PV = 0.24 ± 0.02; SST = 0.19 ± 0.02; one-way ANOVA, F(3,15) = 38.98, P < 0.0001, compared to 5-HT3AR using Dunnett’s test, non-5-HT3AR, P < 0.0001; PV, P < 0.0001; SST, P < 0.0001; Normalized quantity Chrnb2: 5-HT3AR = 0.98 ± 0.04; non-5-HT3AR = 0.68 ± 0.08; PV = 0.83 ± 0.06; SST = 0.76 ± 0.06; one-way ANOVA, F(3,15) = 4.01, P = 0.028, compared to 5-HT3AR using Dunnett’s test, non-5-HT3AR, P = 0.012; PV, P = 0.238, SST, P = 0.081). n.s., P > 0.05, *P < 0.05.
Figure 2
Figure 2. 5-HT3AR interneurons target intracolumnar PV interneurons within L4
(a,b,c) Brainbow-expressing 5-HT3AR and PV interneurons (white) in primary auditory cortex (A1) within a thalamocortical slice. Scale bars = 500 μm, 500 μm, 50 μm. Representative images from one of 4 mice. (d) Left; Brainbow-expressing 5-HT3AR cell axons form numerous putative contacts onto a PV-expressing (white) cell soma, but only sparsely contact a pyramidal cell soma (PYR; blue) in L4 of A1. Representative image from one of 4 mice. Scale bar = 10 μm. Right; Number of 5-HT3AR cell puncta forming putative contacts onto PV and pyramidal cell somata (L2/3: PV = 5.05 ± 0.54, n = 22 cells/4 mice; PYR = 2.00 ± 0.20, n = 53 cells/4 mice; unpaired t test, two-tailed, t(27) = −5.31, P < 0.001; L4: PV = 5.30 ± 0.40, n = 43 cells/4 mice; PYR = 3.50 ± 0.24, n = 62 cells/4 mice; unpaired t test, two-tailed, t(72) = −3.84, P = 0.0003; L5: PV = 3.00 ± 0.41, n = 21 cells/4 mice; PYR = 2.43 ± 0.24, n = 44 cells/4 mice; unpaired t test, two-tailed, t(63) = −1.25, P = 0.216). (e) More 5-HT3AR cell axons target PV cell somata than pyramidal cell somata in cortical L2/3/4. Left; Unique Brainbow-expressing 5-HT3AR-cell axons forming putative contacts (colored arrows) onto target cells can be distinguished by Brainbow-color. Representative image from one of 4 mice. Scale bars = 10 μm. Right; Number of 5-HT3AR cell axons contacting PV and pyramidal cell somata (L2/3: PV = 2.59 ± 0.20, n = 22 cells/4 mice; PYR = 1.34 ± 0.12, n = 53 cells/4 mice; unpaired t test, two-tailed, t(73) = −5.39, P < 0.001; L4: PV = 2.72 ± 0.20, n = 43 cells/4 mice; PYR = 2.13 ± 0.12, n = 62 cells/4 mice; unpaired t test, two-tailed, t(73) = −2.54, P = 0.013; L5: PV = 1.62 ± 0.20, n = 21 cells/4 mice; PYR = 1.57 ± 0.17, n = 44 cells/4 mice; unpaired t test, two-tailed, t(63) = −0.18, P = 0.858). Box plots show median, lower and upper quartiles (boxes), minima and maxima, and outliers (circles). Mean ± SEM shown in gray. (f) 5-HT3AR-expressing cell axons (white) descend to contact PV cell somata (red) in L4 of A1. 5-HT3AR cell dendrites are shown in blue. Representative image from one of 2 mice. Scale bar = 100 μm. (g) Maximal laminar depth and rostro-caudal width of all 5-HT3AR cell (n = 54 cells/2 mice) dendrites (blue), axons (gray), and somatic innervation of PV cells (red; n = 36 cells/2 mice). Red box shows mean ± SD of PV cell innervation. Background illustrates representative reconstructed 5-HT3AR cell soma (black), axon (black), and dendrites (blue). *P < 0.05, **P < 0.001.
Figure 3
Figure 3. 5HT3AR interneurons gate a window of disinhibition by differentially targeting PV and pyramidal cells
(a) Schematic of recording configurations. (b) 5HT3AR-ChR2 expressing cell in L1 from A1 (top). Spiking responses to intracellular current injection in fast-spiking (middle) and pyramidal (bottom) cells. (c) Spiking responses of 5HT3AR cell to increasing laser light (top; representative recording from one of 10 cells). 5HT3AR cell-evoked IPSPs recorded in PV (middle; representative recording from one of 17 cells) and pyramidal cells (bottom; representative recording from one of 28 cells). IPSPs are shown in the presence of bath-applied bicuculline (5μM; gray; representative recording from one of 5 cells) and SCH-50911 (10μM; green; representative recording from one of 4 cells). (d) Top; Averaged (±SEM, shaded region) IPSPs recorded in all PV (red) and pyramidal cells (black). Middle; Mean (±SEM) peak amplitude of early (0–150 ms) and late (200–600 ms) IPSP components (early amplitude (mV): PV = 4.80 ± 0.77, n = 17 cells/12 mice; PYR = 6.29 ± 0.78, n = 28 cells/16 mice, BIC = 1.69 ± 0.38; n = 5 cells/4 mice; Kruskal-Wallis, χ2(2) = 8.64, P = 0.013, compared to PYR using Steel’s test, PV, P = 0.470, BIC, P = 0.009; late amplitude (mV): PV = 1.98 ± 0.33; PYR = 4.84 ± 0.66; BIC = 3.02 ± 1.07; Kruskal-Wallis, χ2(2) = 12.16, P = 0.002, compared to PYR using Steel’s test, PV, P = 0.001, BIC, P = 0.277). Bottom; Mean (±SEM) IPSP half-width and decay τ (IPSP half-width (ms): PV = 99.51 ± 7.65, n = 17 cells/12 mice; PYR = 264.33 ± 18.15, n = 28 cells/16 mice; unpaired t test, two-tailed, t(36) = 8.37, P < 0.0001; IPSP decay τ (ms): PV = 58.56 ± 7.02, n = 17 cells/12 mice; PYR = 321.34 ± 50.06, n = 28 cells/16 mice; Mann-Whitney U test, two-tailed, z = −4.74, P < 0.0001). (e) Schematic of recording configurations. Optogenetic activation of 5-HT3AR cells followed by MGB electrical stimulation at varying intervals. (f) Top; Example PV cell recording shows that 5-HT3AR cell activation suppresses MGB-evoked spiking responses. Bottom; Example pyramidal cell recording shows that 5-HT3AR cell activation enhances MGB-evoked EPSPs for a brief time window before suppressing these responses. (g) Mean (± SEM) effects of 5-HT3AR cell activation on spiking responses in PV cells (red) and EPSPs in pyramidal cells (black) at varying intervals between 5-HT3AR cell activation and MGB stimulation (PV cell, n = 7 cells/5 mice; PYR cell, n = 12 cells/9 mice). (h) Single action potentials in a non-late-spiking (non-LS; right), but not LS (left), L1 interneuron produced reliable IPSCs in a PV interneuron in L4. (LS, recording from one of 2 paired connections; non-LS, recording from one of 8 paired connections). **P < 0.01.
Figure 4
Figure 4. 5-HT3AR cell silencing prevents tonotopic plasticity
(a) Timeline showing experimental strategy used to silence 5-HT3AR cells during an auditory critical period. 5-HT3AR-Cre mouse pups and littermate controls were injected with AAV-hSyn-DIO-hM4D(Gi)-mCherry, and administered CNO every 12hrs during sound exposure to pulsed 7kHz tone pips. Changes in thalamocortical connectivity were assessed using in vitro voltage-sensitive dye imaging (VSDI) at P20. (b) hM4D reduces 5-HT3AR cell GABA release. Left; Representative 5-HT3AR cell-evoked IPSCs recorded in L2/3 pyramidal cells in response to paired pulses of laser light (arrow) before (black trace) and following CNO bath application (15μM, blue trace) in slices from a P13 hM4D-expressing mouse and a littermate control. Right; Mean (± SEM) normalized amplitudes (control = 1.09 ± 0.10, n = 9 cells/2 mice; hM4d = 0.55 ± 0.18, n = 6 cells/3 mice; unpaired t test, two-tailed, t(13) = −2.89, P = 0.013) and paired-pulse ratio (PPR: control = 0.19 ± 0.06, n = 9 cells/2 mice; hM4d = 0.44 ± 0.09, n = 6 cells/3 mice; unpaired t test, t(13) = 2.40, P = 0.032, inter-stimulus-interval = 80). (c) Schematic of an auditory thalamocortical slice illustrates the six stimulus positions within the ventral medial geniculate body (MGBv) and locations analyzed within L4 of the primary auditory cortex (A1). (d) Left; Example of A1 responses (ΔF/F) to stimulation of MGBv position 3 using VSDI. Scale bar = 500 μm. Right; Average normalized traces (ΔF/F) across A1 locations to stimulation of MGBv positions 1, 3, and 6 (n = 28 mice). (e) Mean (± SEM) location of cortical L4 peak ΔF/F to MGBv stimulations (Naïve, n = 15 mice; Control 7kHz, n = 14 mice; hM4D 7kHz, n = 28 mice). (f) Mean (± SEM) topographic slopes (C57 Naïve = 1.01 ± 0.17, n = 15 mice; control 7kHz, 0.34 ± 0.20, n = 14 mice; hM4d 7kHz, 1.27 ± 0.14, n = 28 mice; one-way ANOVA, F(2,54) = 8.20, P = 0.0008, compared to hM4d 7kHz using Dunnett’s test, C57 Naïve, P = 0.41, control, P = 0.0003). n.s., P > 0.05, *P < 0.05, **P < 0.001.
Figure 5
Figure 5. Nicotinic recruitment of 5-HT3AR cells controls critical period timing
(a) Lynx1 expression within 5-HT3AR cells increases between postnatal day (P) 11 and 20 (normalized Lynx1 quantity: P11 = 0.77 ± 0.11; P20 = 1.30 ± 0.07, n = 4 mice each; Mann-Whitney U test, two-tailed, z = 2.17, P = 0.030). (b) Representative 5-HT3AR cell spiking responses before (top), during nicotine application (middle; bath-applied; 10μM), and following 15m washout (bottom). (c) Mean (± SEM) nicotine effect on spiking responses (C57 P12–15 = 4.18 ± 0.93, n = 11 cells/5 mice; C57 P20–22 = 2.28 ± 0.38, n = 12 cells/5 mice; C57 adult = 1.52 ± 0.43, n = 8 cells/8 mice; Lynx1 KO adult = 4.44 ± 0.74, n = 14 cells/10 mice; Kruskal-Wallis, χ2(2) = 12.55, P = 0.0057, compared to C57 adult using Steel Test, C57 P12–15, P = 0.046, C57 P20–22, P = 0.56, Lynx1 KO, P = 0.013). (d–f) Top; Timelines showing experimental strategies. Bottom; Mean (± SEM) topographic slopes (d, Naïve = 1.01 ± 0.17, n = 15 mice; 7kHz = 1.09 ± 0.30, n = 12 mice; 7kHz AChEI = 0.19 ± 0.26, n = 8 mice; one-way ANOVA, F(2,32) = 3.30, P = 0.049, compared to 7kHz using Dunnett’s test, Naïve, P = 0.96, 7kHz AChEI, P = 0.044; e, Naïve = 1.05 ± 0.24, n = 17 mice; 7kHz = 0.23 ± 0.26, n = 12 mice, 7kHz α7 KO = 0.28 ± 0.19, n = 19 mice, 7kHz DHβE = 0.73 ± 0.25, n = 10 mice; one-way ANOVA, F(3,54) = 3.09, P = 0.035, compared to Naïve with Dunnett’s test, 7kHz, P = 0.044, 7kHz α7 KO, P = 0.031, 7kHz DHβE, P = 0.69; f, 7kHz control = 0.41 ± 0.18, n = 8 mice; 7kHz 5-HT3A-Cre x Ai35 = 1.14 ± 0.14, n = 9 mice; unpaired t test, two-tailed, t(15) = −3.20, P = 0.006). n.s., P > 0.05, *P < 0.05, **P < 0.01.
Figure 6
Figure 6. VIP cells contribute to PV cell suppression, but are not necessary for CP plasticity
(a) MGB puncta (red) onto VIP-expressing interneurons in L1 colocalize with vGluT2 (green). Scale bar = 5μm. Representative image from one of 3 mice. (b) Left; VIP cells receive less vGluT2 puncta compared to L1 non-VIP cells (number of vGluT2 puncta: non-VIP = 2.96 ± 0.17, n = 190 cells/3 mice; VIP = 0.77 ± 0.13, n = 98 cells/3 mice; Mann-Whitney U test, two-tailed, z = −8.45, P < 0.0001). Box plots show median, lower and upper quartiles (boxes), minima and maxima, and outliers (circles). Mean ± SEM shown in gray. Right; Number of vGluT2 puncta onto L1 non-VIP and VIP cells across cortical lamina. (c) VIP interneurons express less mRNA encoding α4 nAChR subunits and Lynx1 than the general 5-HT3AR cell population. In situ hybridization shows colocalization of Chrna4 and Lynx1 mRNAs encoding α4 nAChR subunits and Lynx1 in Htr3a (5-HT3AR) and VIP (VIP)-expressing cells. Scale bar = 5 μm. (d) Quantification of detected Chrna4 and Lynx1 mRNA copies per 5-HT3AR or VIP cell (Chrna4: 5-HT3AR = 5.08 ± 0.87, n = 40 cells/3 mice; VIP = 2.01 ± 0.31, n = 96 cells/3 mice; Mann-Whitney U test, two-tailed, z = 4.91, P < 0.0001; Lynx1: 5-HT3AR = 14.68 ± 2.81, n = 40 cells/3 mice; VIP = 5.08 ± 0.82, n = 96 cells/3 mice; Mann-Whitney U test, two-tailed, z = 4.62, P < 0.0001). Box plots show median, lower and upper quartiles (boxes), minima and maxima, and outliers (circles). Mean ± SEM shown in gray. (e) Representative 5-HT3AR cell axons (blue/green) expressing VIP (red) form putative contacts onto L4 PV-expressing cell somata (white). (f) VIP-expressing interneurons form numerous putative contacts onto PV cell somata, but only sparsely contact pyramidal (PYR) cell somata in L4 of A1 (number of VIP cell puncta: PV = 3.71 ± 0.25, n = 21 cells; PYR = 1.58 ± 0.25, n = 40 cells; from 3 mice; Mann-Whitney U test, two-tailed, z = 4.77, P < 0.0001). Box plots show median, lower and upper quartiles (boxes), minima and maxima, and outliers (circles). Mean ± SEM shown in gray. (g) Schematic of recording configurations. (h) VIP cell-evoked IPSPs recorded in PV cell (top) and pyramidal cell (bottom) within L4. IPSPs are shown in the presence of bath-applied bicuculline (5μM; gray; examples from one each of 3 PV cells and 3 pyramidal cells). (i) Top; Averaged (±SEM, shaded region) IPSPs recorded in all PV (red) and pyramidal cells (black). Bottom; Mean (±SEM) peak IPSP amplitude and half-width (IPSP amplitude (mV): PV = 1.13 ± 0.17, n = 11 cells/5 mice; PYR = 0.73 ± 0.12, n = 13 cells/6 mice; Mann-Whitney U test, two-tailed, z = 2.14, P = 0.032; half-width (ms): PV = 87.44 ± 11.68, n = 11 cells/5 mice; PYR = 129.43 ± 11.50, n = 13 cells/6 mice; unpaired t test, two-tailed, t(22) = 2.56, P = 0.018). (j) Schematic of recording configurations. (k) Mean (± SEM) effects of VIP cell activation on spiking responses in PV cells (red) and EPSPs in pyramidal cells (black) at varying intervals between VIP cell activation and MGB stimulation (PV cell, n = 8 cells/5 mice; PYR cell, n = 6 cells/6 mice). (l) VIP cell silencing does not disrupt tonotopic plasticity. Top; Timeline showing experimental strategy. Bottom; Mean (± SEM) topographic slopes (control 7kHz = 0.41 ± 0.15, n = 16 mice; hM4d 7kHz = 0.70 ± 0.32, n = 12 mice; unpaired t test, two-tailed, t(16) = 0.83, P = 0.42). n.s., P > 0.05, *P < 0.05, **P < 0.0001.
Figure 7
Figure 7. A cortical L1 map tunes auditory cortex
(a) Schematic illustrating a topographic map of MGBv inputs to cortical L1 that mirrors L4. (b) Mean peak responses (norm. ΔF/F) across A1 to stimulation of MGBv positions 1, 4, and 6 across all animals using VSDI (n = 15 mice). Black arrows indicate the rostro-caudal location of peak responses within L1. (c) Topographic slopes within L1 and L4 of naïve mice and those exposed to 7kHz during the critical period (Naïve: L1 = 0.81 ± 0.26, n = 15 mice; L4 = 1.01 ± 0.17, n = 15 mice; unpaired t test, two-tailed, t(28) = 0.642, P = 0.526; 7kHz: L1 = 1.09 ± 0.20, n = 11 mice; L4 = 0.35 ± 0.26, n = 11 mice; unpaired t test, two-tailed, t(20) = −2.29, P = 0.033). Box plots show median, lower and upper quartiles (boxes), minima and maxima, and outliers (circles). Mean ± SEM shown in gray. (d) Average normalized traces (ΔF/F) across A1 locations (n = 15 mice) to stimulation of MGBv positions 1, 4, and 6 in L1 (colored) and L4 (gray). (e) Topographic projections from MGBv to L1. Focal injections of fluorescent dyes conjugated to wheat germ agglutinin (WGA) along the rostral-caudal axis within L1 of A1 from 3 mice. Scale bar = 500 μm (f) Scatter plot showing normalized position of all MGBv cells containing dye-labeled vesicles from 4 injections in 3 mice (colors indicate injections shown in e). Crosses show mean (± SEM) caudal-rostral and medial-lateral positions. (g) Thalamocortical slice of mouse injected with WGA in rostral and caudal sites within L1 of A1. Scale bars = 500 μm, 100 μm. (h) Dye-labeled vesicles in caudolateral (top; blue) and rostromedial (bottom; orange) MGBv locations from caudal and rostral A1 injections, respectively. Scale bar = 10 μm. n.s., P > 0.05, *P < 0.05.

References

    1. Werker JF, Hensch TK. Critical Periods in Speech Perception: New Directions. Annual Review Psychol. 2015;66:23.1–23.24. - PubMed
    1. Kuhl PK, Tsao FM, Liu HM. Foreign language experience in infancy: Effects of short-term exposure and social interaction on infant learning. PNAS. 2003;100:9096–9101. - PMC - PubMed
    1. de Villers-Sidani E, Chang EF, Bao S, Merzenich MM. Critical period for spectral tuning defined in the primary auditory cortex (A1) in the rat. J Neurosci. 2007;27:80–9. - PMC - PubMed
    1. Insanally MN, Köver H, Kim H, Bao S. Feature-dependent sensitive periods in the development of complex sound representation. J Neurosci. 2009;29:5456–5462. - PMC - PubMed
    1. Barkat TR, Polley DB, Hensch TK. A critical period for auditory thalamocortical connectivitiy. Nat Neurosci. 2011;14:1189–1194. - PMC - PubMed

Publication types

MeSH terms

LinkOut - more resources