. 2018 Aug;25(8):1375-1393.
doi: 10.1038/s41418-017-0044-9. Epub 2018 Jan 22.

eIF2α phosphorylation is pathognomonic for immunogenic cell death

Affiliations

eIF2α phosphorylation is pathognomonic for immunogenic cell death

Lucillia Bezu et al. Cell Death Differ. 2018 Aug.

Abstract

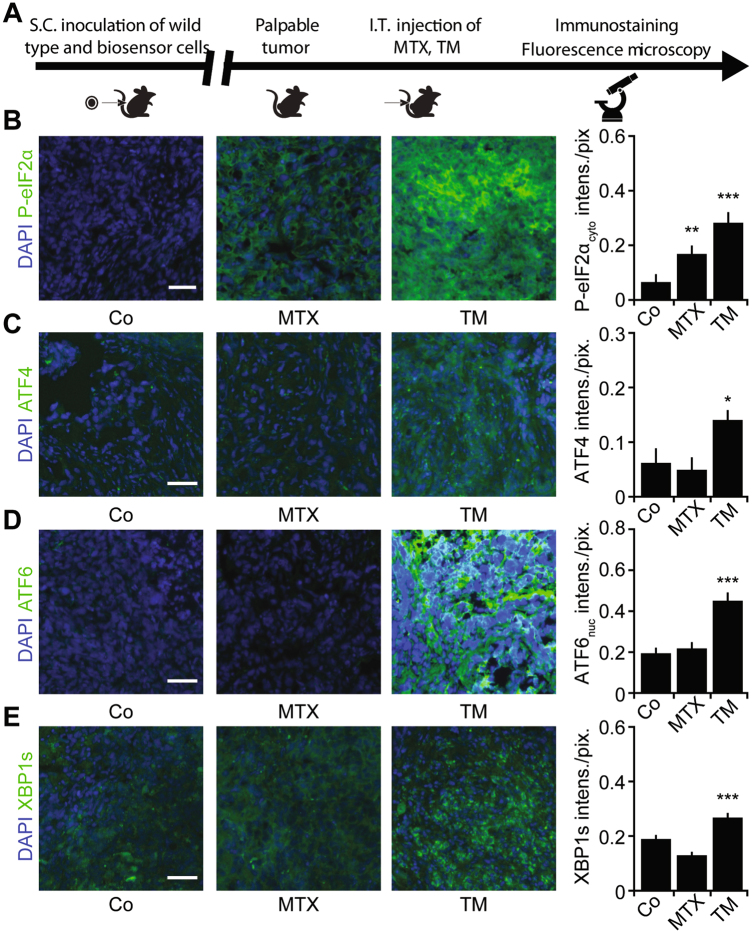
The phosphorylation of eIF2α is essential for the endoplasmic reticulum (ER) stress response, the formation of stress granules, as well as macroautophagy. Several successful anticancer chemotherapeutics have the property to induce immunogenic cell death (ICD), thereby causing anticancer immune responses. ICD is accompanied by the translocation of calreticulin (CALR) from the ER lumen to the plasma membrane, which facilitates the transfer of tumor-associated antigens to dendritic cells. Here we systematically investigated the capacity of anticancer chemotherapeutics to induce signs of ER stress. ICD inducers including anthracyclines and agents that provoke tetraploidization were highly efficient in enhancing the phosphorylation of eIF2α, yet failed to stimulate other signs of ER stress including the transcriptional activation of activating transcription factor 4 (ATF4), the alternative splicing of X-box binding protein 1 (XBP1s) mRNA and the proteolytic cleavage of activating transcription factor 6 (ATF6) both in vitro and in cancers established in mice. Systematic analyses of clinically used anticancer chemotherapeutics revealed that only eIF2α phosphorylation, but none of the other signs of ER stress, correlated with CALR exposure. eIF2α phosphorylation induced by mitoxantrone, a prototype ICD-inducing anthracyline, was mediated by eIF2α kinase-3 (EIF2AK3). Machine-learning approaches were used to determine the physicochemical properties of drugs that induce ICD, revealing that the sole ER stress response relevant to the algorithm is eIF2α phosphorylation with its downstream consequences CALR exposure, stress granule formation and autophagy induction. Importantly, this approach could reduce the complexity of compound libraries to identify ICD inducers based on their physicochemical and structural characteristics. In summary, it appears that eIF2α phosphorylation constitutes a pathognomonic characteristic of ICD.


Conflict of interest statement

The authors declare that they have no conflict of interest.

Figures

Fig. 1
Fig. 1. Anthracyclines induce the phosphorylation of eIF2α yet fail to induce other markers of ER stress
ah Cells were treated with mitoxantrone (MTX, 2 µM), doxorubicin (DOXO, 2 µM), oxaliplatin (OXA, 500 µM), tunicamycin (TM, 3 µM), thapsigargin (TG, 3 µM), cisplatin (CDDP, 150 µM), resveratrol (RESV, 50 µM), spermidine (SPD, 50 µM) and rapamycin (RAPA, 10 µM). ah Human osteosarcoma U2OS cells were treated for 6 h (ab) or 12 h (cf), harvested, and proteins were separated by SDS-polyacrylamid gel electrophoreses and following detected by immunoblot. Representative immunoblots (a, c, e) and densitometry data b, d, f are depicted. Densitometry data are represented as mean value ± SD of three independent experiments (n = 4 for b). e, f U2OS cells stably expressing XBP1ΔDBD-venus were treated for 12 h and stained with a mouse anti-XBP1s antibody. gh U2OS were treated for 6 h with the indicated drugs then the cells were harvested and total RNA was isolated. Reverse transcriptase polymerase chain reaction (RT PCR) was performed with primers specific for human XBP1s. Then the PCR products were separated by gel electrophoresis. Representative images (g) and densitometry data (h) shown as mean value ± SD of three independent experiments are depicted. Samples were compared using Student’s t test (*p < 0.05, **p < 0.01, ***p < 0.001)
Fig. 2
Fig. 2. Differential stress patterns evoked by immunogenic cell death-inducing and autophagy-inducing drugs
Human osteosarcoma U2OS cells stably expressing pSMALB-ATF4.5rep (that detects translational regulation via alternative usage of upstream open reading frames in the ATF4 mRNA), GFP-ATF6 (for monitoring ATF6 translocation from ER to sites of the Golgi and subsequently to the nucleus), XBP1ΔDBD-venus (for monitoring venus expression upon alternative splicing of XBP1 mRNA), GFP-LC3 (for monitoring GFP-LC3 aggregation in the membranes of forming autophagosomes), G3BP-GFP (for monitoring the G3BP-GFP aggregation in stress granules upon stalled translation) or parental U2OS cells were treated with the indicated agents (mitoxantrone (MTX, 3 µM), doxorubicin (DOXO, 3 µM), oxaliplatin (OXA, 500 µM), tunicamycin (TM, 3 µM), thapsigargin (TG, 3 µM), cisplatin (CDDP, 150 µM), resveratrol (RESV, 50 µM), spermidine (SPD, 50 µM), rapamycin (RAPA, 3 µM)) for 12 h, 6 h, 12 h, 8 h, 12 h and 6 h, respectively (except G3BP-GFP-expressing cells that were treated with MTX and OXA for 24 h). Data is depicted as representative images or representative histograms (a, c, e, g, i, k, m) (scale bar equals 10 µm) and was statistically evaluated by cytometric analysis of replicates (b, d, f, h, j, l, n). a, b P-eIF2α was assessed by means of immunofluorescence staining using a phosphoneoepitope-specific antibody and the percentage of cells with increased cytoplasmic signal is depicted. c, d pSMALB-ATF4.5rep nuclear translocation was measured by fluorescence microscopy and the average nuclear intensity of pSMALB-ATF4.5rep is depicted. e, f The formation of stress granules was measured by assessing the surface of G3BP-GFP-marked granules. g, h Autophagy was monitored by assessing the dots count of GFP-LC3-marked autophagosomes. i, j XBP1s activation was measured by detecting the increase in venus fluorescence intensity. k, l The activation of ATF6 was measured as an increment of the nuclear to cytoplasmic ratio of GFP fluorescence intensity. Data are represented as the mean ± SD of quadruplicates from one representative out of three independent experiments. Calreticulin exposure was determined by immunofluorescence staining and flow cytometry and is expressed as percentage of calreticulin positive, DAPI negative (CALR+ DAPI-) cells. Data are represented as the mean ± SEM of triplicates from one representative out of three independent experiments m, n. Samples were compared using Student’s t test. *p < 0.05, **p < 0.01, ***p < 0.001
Fig. 3
Fig. 3. Partial split of ER stress responses in vivo induced by ICD drugs
a A scheme showing the experimental procedure: parental U2OS and cells stably expressing pSMALB-ATF4.5rep, or XBP1ΔDBD-venus were collected and injected in both flanks of immunodeficient nu/nu mice. When tumors became palpable mitoxantrone (MTX, 5.17 mg/kg), tunicamycin (TM, 1 mg/kg) or DMEM was injected into the tumor. Transplanted U2OSwt tumors were treated for 6 h, U2OS pSMALB-ATF4.5rep and XBP1ΔDBD-venus cells were treated 12 h and 48 h for each group treated with MTX. Then tumors were removed and fixed in 3.7% PFA. P-eIF2α and ATF6 was assessed by immunostaining of parental U2OS cancers. be Immunofluorescence, and GFP expression was determined by fluorescence microscopy. Results are expressed as means ± SEM. Data were compared with t-test. *p < 0.05, **p < 0.01, ***p < 0.001
Fig. 4
Fig. 4. Correlation of cell stress and cell death parameters
Correlation matrix of endoplasmic reticulum stress parameters including the phosphorylation of eIF2α (by phosphoneoepitope-specific antibody), the translational activation of ATF4, the formation of G3BP-containing stress granules, the alternative splicing of XBP1, the nuclear translocation of ATF6, as well as cell stress and cell death parameters such as viability, the cytoplasmic translocation of HMGB1, the intracellular ATP concentration (ATP IC), calreticulin (CALR) exposure and autophagy in response to a chemical library that entails commonly used anti neoplastic agents (as detailed in the material and methods) at a final concentration of 3 µM. Viability was assessed by counting adherent cells with a normal nuclear morphology. Human osteosarcoma parental U2OS were treated 6 h and P-eIF2α was obtained by immunofluorescence staining, depicted as percentage of cells with detectable cytoplasmic fluorescence. Calreticulin exposure was determined by immunofluorescence staining and flow cytometry and is expressed as the percentage of calreticulin positive, DAPI negative (CALR+ DAPI) cells. Parental U2OS were treated for 24 h, and the average cytoplasmic HMGB1 intensity was determined by immunofluorescence staining. Parental U2OS were treated for 8 h, 16 h and 24 h to determine ATP release by quinacrine staining. The correlation was performed using a Pearson test and data are expressed as R coefficient. *p < 0.05, **p < 0.01, ***p < 0.001. Data are shown in a color coded diagram in which the presence or absence of positive (red) and negative (blue) correlations among the parameters is depicted along with the p values of such correlations. See Figure S1 for original matrix and Table S1 for raw data
Fig. 5
Fig. 5. CALR exposure depends on eIF2α phosphorylation yet is independent of the ER stress
a, b, c, d, e U2OS cells were treated with a chemical library that entails commonly used anti neoplastic agents (as detailed in the material and methods) at 3 µM, unless otherwise specified (h = high concentration: cisplatin, 150 µM; oxaliplatin, 500 µM; resveratrol, 50 µM; spermidine, 50 µM). U2OS cells were treated for 6 h, and P-eIF2α was detected by immunostaining. U2OS cells were treated for 24 h, and HMGB1 was detected by immunostaining. U2OS stably expressing GFP-ATF6, pSMALB-ATF4.5rep, or XBP1ΔDBD-venus, GFP-LC3 and G3BP-GFP have been treated for 6 h, 12 h, 12 h, 8 h and 12 h, respectively (except G3BP-GFP that were treated with MTX and OXA for 24 h). For the detection of surface-exposed CALR, U2OS cells were treated for 6 h and CALR was detected on DAPI cells by immunostaining and flowcytometry. Data are depicted as normalized means ± SD of triplicates from one representative out of three experiments. Data are depicted as means ± SD of quadruplicates from one representative out of three experiments. a Heatmap. Black and red values indicate negative and positive effects respectively (Raw data normalized with sigmoidal scaling). See Table S1 for raw data. a, e For XBP1, the results for vinca-alkaloids are not been taken into account (gray rectangles or brackets) because they were not confirmed by alternative methods (cf. Fig. 7h). The correlation was quantified using the Pearson test and data are expressed as R coefficients. *p < 0.05, **p < 0.01, ***p < 0.001
Fig. 6
Fig. 6. Mutually exclusive induction of ER stress and calreticulin exposure
a, b U2OS cells were treated with mitoxantrone (MTX, 3 µM) or oxaliplatin (OXA, 500 µM) in the presence or absence of tunicamycin (TM, 3 µM). CALR exposure was detected by immunostaining and cytometry. Representative histograms of surface CALR and means ± SD of triplicates from one representative out of three experiments are depicted. Data were compared with Student’s t-test. *p < 0.05, **p < 0.01, ***p < 0.001. c U2OS stably expressing GFP-ATF6, pSMALB-ATF4.5rep, or XBP1ΔDBD-venus were treated for 6 h, 12 h, and 12 h, respectively with mitoxantrone (MTX, 3 µM) or tunicamycin (TM, 3 µM) or both. Representative images (scale bar equals 10 µm) are shown. d, e U2OS cells were treated with MTX (2 µM) in the presence or the absence of TM (3 µM) and the expression of ATF4 and CHOP was assessed by specific antibodies. Representative immunoblots (d) and densitometry data (e) shown as mean value ± SD of three independent experiments are depicted *p < 0.05, **p < 0.01, ***p < 0.001 (f, g) U2OS cells were treated with MTX (1 µM) in the presence or the absence of TM (3 µM), and total RNA was isolated. Reverse transcriptase polymerase chain reaction (RT-PCR) was performed with primers specific for human XBP1s. PCR products were separated by gel electrophoresis. Representative images (f) and densitometry data (g) shown as mean value ± SD of three independent experiments are depicted. Samples were compared using Student’s t test (*p < 0.05, **p < 0.01, ***p < 0.001). h U2OS cells were treated with a chemical library that contains commonly used anti neoplastic agents (as detailed in the Material and Methods) at 3 µM unless otherwise specified (h = high concentration: cisplatin, 150 µM; oxaliplatin, 500 µM; resveratrol, 50 µM; spermidine, 50 µM) in the presence of TM (3 µM). U2OS stably expressing GFP-ATF6, pSMALB-ATF4.5rep, or XBP1ΔDBD-venus were treated for 6 h, 12 h, and 12 h, respectively and GFP and venus were detected by fluorescence microscopy. Heatmap. Red and black values indicate the absence or presence of inhibition, respectively (Raw data normalized with sigmoidal scaling). Results are expressed as mean ± SD. Data were compared with t-test. *p < 0.05, **p < 0.01, ***p < 0.001. See Table S2 for raw data
Fig. 7
Fig. 7. Hyperploidy-associated signs of ER stress
a CALR exposure induced by hyperploidy. Parental EL4 cells and its two tetraploid derivatives (EL4-T1 and EL4-T2) were cultured in vitro (upper line) or passaged through immunodeficient (ID) mice or immunocompetent mice (IC). These cells were the stained to assess calreticulin exposure by indirect immunofluorescence (gray curves indicate isotype controls). b Scatter plot representation of transcription factors (including ATF4, ATF6, XBP1) that, according to bioinformatic analyses, correlate with differences in the transcriptome between parental and tetraploid cells cultured in vitro (abscisse) or that between tetraploid clones passaged through ID vs. IC mice (ordinate). Transcription factor activities are expressed as the z-scores obtained by “IPA Upstream Regulator Analysis”. c Expression of selected ATF4 target genes. For each gene, the log fold change between hyperploid cells compared to parental cells is shown, Moreover, expression levels are shown in a heat map for each sample. ER stress activation was measured during acute tetraploidization (d, f, h) of U2OS cells or long-term tetraploidization of HCT116 cells (e, g, i). U2OS cells were left untreated (control, Co) or treated with thapsigargin (TG, 3 µM), tunicamycin (TM, 3 µM), nocodazole (Noco, 100 nM), cytochalasin D (CytD) 1.2 µM, vinblastine (Vinb) 3 µM or vincristine (Vinc) 3 µM for 6 h (P-eIF2α) or 12 h (ATF4). Parental HCT116 cells were left untreated (Co) or treated with thapsigargin (TG, 3 µM, 6 h) and compared to two tetraploid clones (T1, T2). The indicated signs of ER stress were determined by immunoblot (dg) or RT-PCR (h,i). Representative blots are shown. Densitometric quantifications are means ± SEM of at least three experiments and are analyzed by means of the Student’s t-test (*p < 0.05, **p < 0.01, ***p < 0.001)
Fig. 8
Fig. 8. Chemical descriptors and immunogenic cell death prediction
a The main steps leading to the construction of a mathematical model for the prediction of immunogenic cell death (ICD) are depicted as flowchart. The prediction model was built by machine learning, performing an optimized Principal Component Regression (PCR) between the 11 biological parameters and the 93 chemical descriptors available for each agent from the training set. The relevant chemical descriptors were retained from a total of 343 descriptors, either retrieved from PubChem (https://pubchem.ncbi.nlm.nih.gov) or calculated using the Chemistry Development Kit (https://github.com/cdk). The generated model was validated on two published experimental data sets by comparing the distribution of predicted scores among experimental hits (excluding those used for model construction) with remaining compounds. b An optimized model was obtained by summing 5 out of 11 biological parameters as ICD indicators, including eIF2α phosphorylation. The predicted scores obtained from the model are plotted against the scores obtained experimentally. The linear regression between predicted and experimental scores is indicated (red line) and the Pearson correlation coefficient R is reported. Compounds indicated in blue are hits validated in vitro and were used as a constraint for model optimization. Other indicated compounds had a predicted score higher than 2. Upon outlier exclusion, we defined an arbitrary confidence interval ranging from ICD score 3 to 6. c The contribution of each descriptor composing the 11 dimensions from principal component analysis (PCA) projection used in model are reported as heatmap. Dimensions are ordered according to their decreasing weight in linear regression. d, e Predicted scores for compounds present in the FDA-approved drug library (1040 agents, d) and NCI Mechanistic diversity set (813 agents, e) were calculated and are reported on the graphs. The results of the Kolmogorov-Smirnov statistical test between the scores of experimental ICD inducers (in blue) and remaining compounds are reported on the graphs. The red dashed line represents the top 15% quantile of the scores

References

    1. Sharma P, Allison JP. Immune checkpoint targeting in cancer therapy: toward combination strategies with curative potential. Cell. 2015;161:205–14. doi: 10.1016/j.cell.2015.03.030. - DOI - PMC - PubMed
    1. Palucka AK, Coussens LM. The basis of oncoimmunology. Cell. 2016;164:1233–47. doi: 10.1016/j.cell.2016.01.049. - DOI - PMC - PubMed
    1. Pitt JM, Vetizou M, Daillere R, Roberti MP, Yamazaki T, Routy B, et al. Resistance mechanisms to immune-checkpoint blockade in cancer: tumor-intrinsic and -extrinsic factors. Immunity. 2016;44:1255–69. doi: 10.1016/j.immuni.2016.06.001. - DOI - PubMed
    1. Sharma P, Hu-Lieskovan S, Wargo JA, Ribas A. Primary, adaptive, and acquired resistance to cancer immunotherapy. Cell. 2017;168:707–23. doi: 10.1016/j.cell.2017.01.017. - DOI - PMC - PubMed
    1. Topalian SL, Hodi FS, Brahmer JR, Gettinger SN, Smith DC, McDermott DF, et al. Safety, activity, and immune correlates of anti-PD-1 antibody in cancer. N Engl J Med. 2012;366:2443–54. doi: 10.1056/NEJMoa1200690. - DOI - PMC - PubMed

Publication types

MeSH terms