. 2018 Jan 22;9(1):322.
doi: 10.1038/s41467-017-02732-5.

Lysophosphatidylcholine acyltransferase 2-mediated lipid droplet production supports colorectal cancer chemoresistance

Affiliations

Lysophosphatidylcholine acyltransferase 2-mediated lipid droplet production supports colorectal cancer chemoresistance

Alexia Karen Cotte et al. Nat Commun. .

Abstract

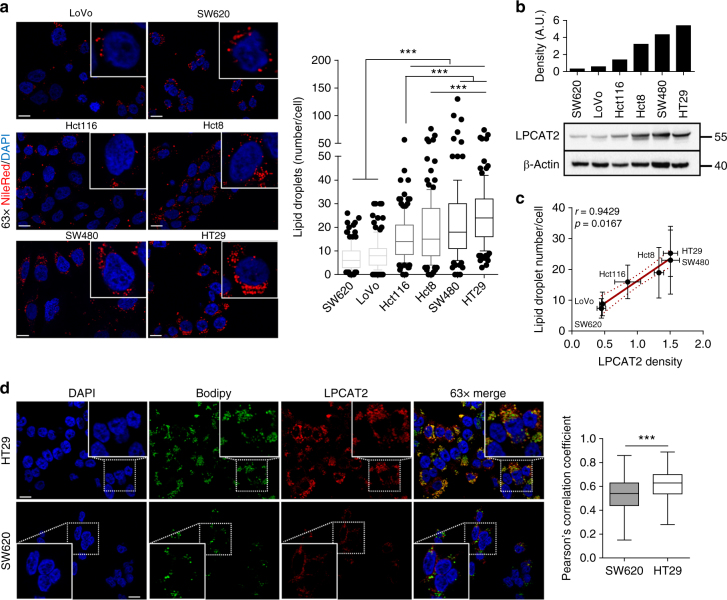
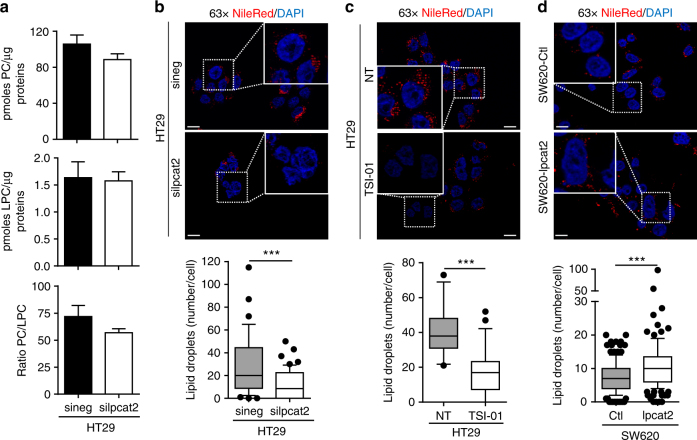
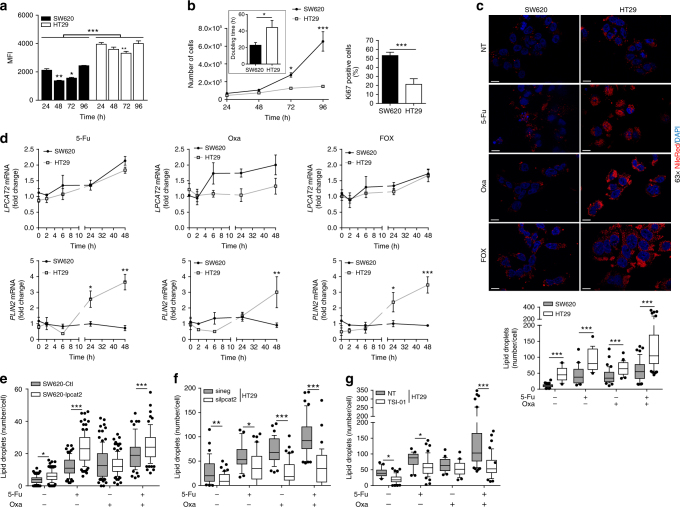
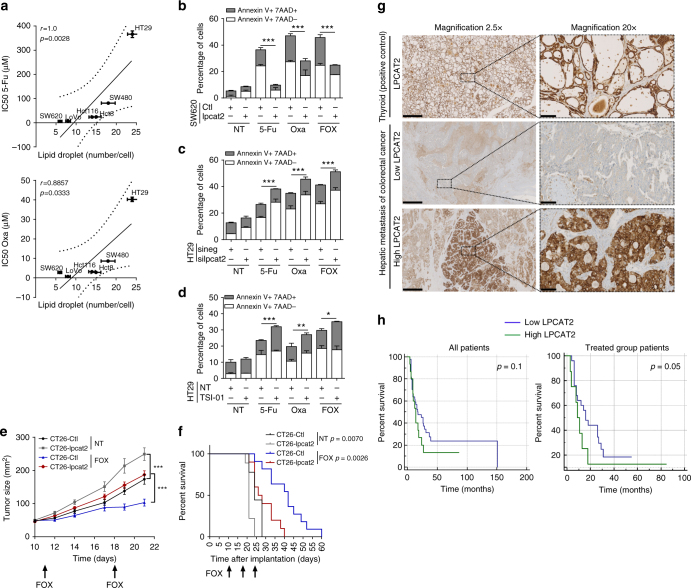
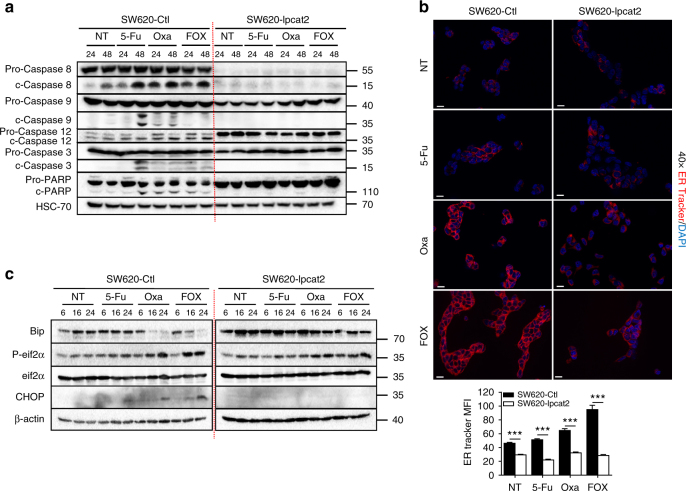
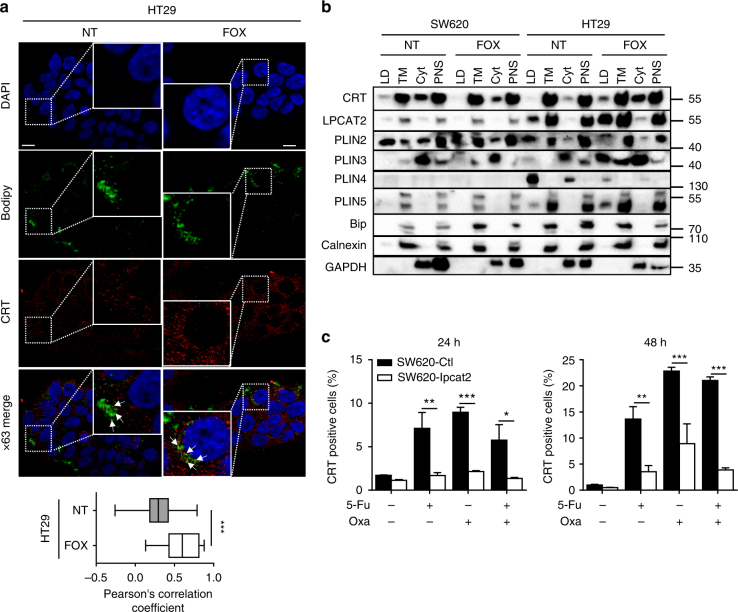
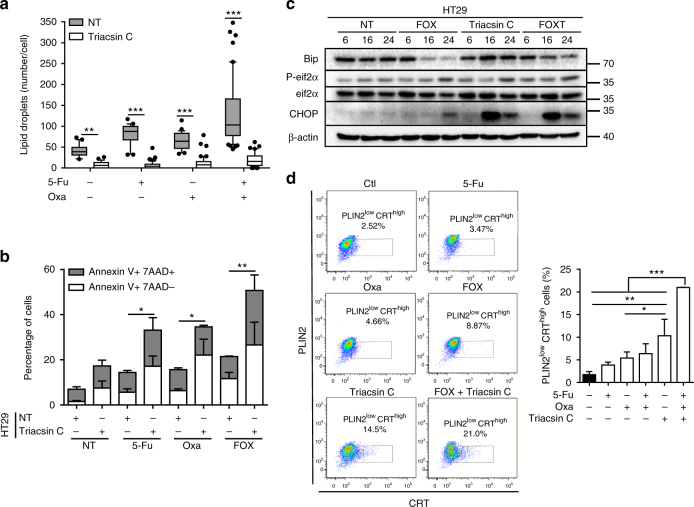
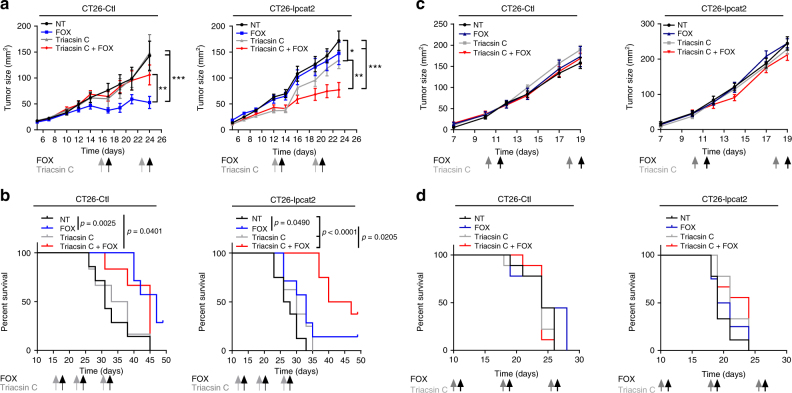
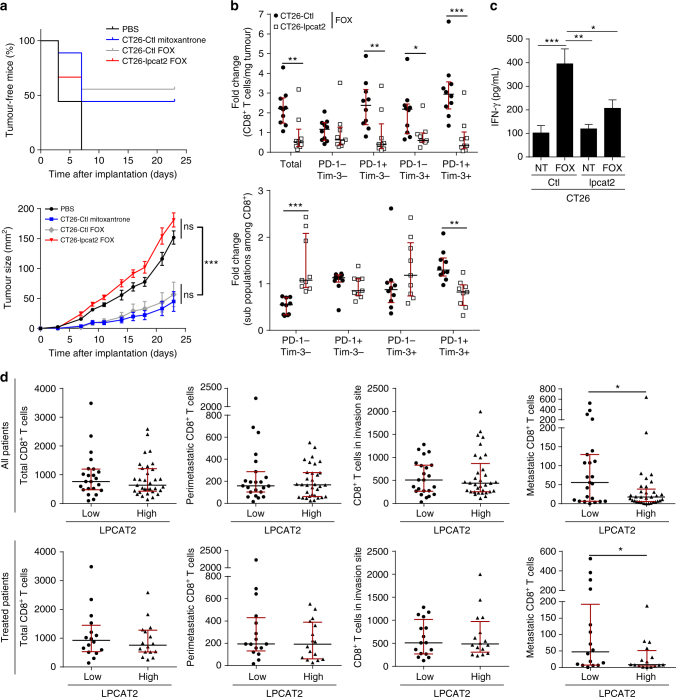
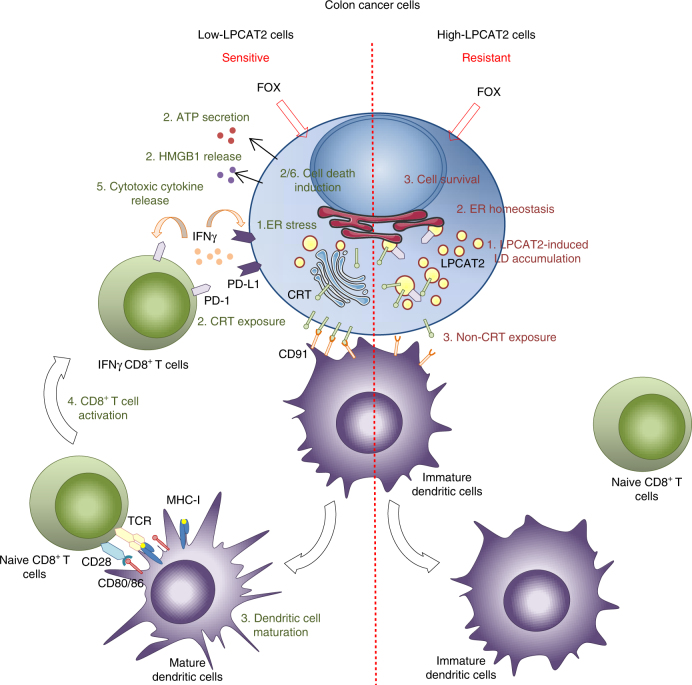
Lipid droplet (LD) accumulation is a now well-recognised hallmark of cancer. However, the significance of LD accumulation in colorectal cancer (CRC) biology is incompletely understood under chemotherapeutic conditions. Since drug resistance is a major obstacle to treatment success, we sought to determine the contribution of LD accumulation to chemotherapy resistance in CRC. Here we show that LD content of CRC cells positively correlates with the expression of lysophosphatidylcholine acyltransferase 2 (LPCAT2), an LD-localised enzyme supporting phosphatidylcholine synthesis. We also demonstrate that LD accumulation drives cell-death resistance to 5-fluorouracil and oxaliplatin treatments both in vitro and in vivo. Mechanistically, LD accumulation impairs caspase cascade activation and ER stress responses. Notably, droplet accumulation is associated with a reduction in immunogenic cell death and CD8+ T cell infiltration in mouse tumour grafts and metastatic tumours of CRC patients. Collectively our findings highlight LPCAT2-mediated LD accumulation as a druggable mechanism to restore CRC cell sensitivity.


Conflict of interest statement

The authors declare no competing financial interests.

Figures

Fig. 1
Fig. 1
LD production correlates with LPCAT2 expression in CRC cell lines. a Basal LD content assessed by Nile red staining after 48 h of seeding. Left panel, representative confocal images of Nile red staining (×63 magnification, scale bar = 10 µm). Nuclei (blue), LD (red). Right panel, LD quantification was performed by counting red lipid bodies on merged pictures (300 cells per cell line) with Image J software (right). Whiskers denote 1st and 99th percentiles. P values were determined by a two-way ANOVA with Bonferroni correction. ***p < 0.001. b LPCAT2 basal expression. A representative blot from three independent experiments is shown. c A significant Spearman correlation coefficient (p = 0.0167) was found between basal LPCAT2 protein density and LD content from three independent experiments. d SW620 and HT29 cells were stained after 48 h of seeding with Bodipy 493/503 (green) and LPCAT2 antibody (red), and counterstained with DAPI (blue). The Pearson correlation coefficient was calculated between LPCAT2 and Bodipy fluorescences
Fig. 2
Fig. 2
LD production depends on LPCAT2 in CRC cell lines. a HT29 cells’ PC and LPC levels assessed 72 h post-transfection with Lpcat2 siRNA (silpcat2, 10 nM) or with scrambled siRNA (sineg, 10 nM). The data were normalised to the protein content of each sample and expressed as mean ± s.e.m. bd LD staining with Nile red ( × 63 magnification, scale bar = 10 µm) in (b), HT29 cells 72 h post-transfection with silpcat2 or with sineg; (c), HT29 cells treated for 48 h with vehicle (DMSO) or selective LPCAT2 inhibitor, TSI-01 (10 µM); (d), SW620-Ctl vs. SW620 overexpressing LPCAT2 (SW620-lpcat2); number of LDs per cell and significance was evaluated by counting red lipid bodies on merged pictures (300 cells per condition) with Image J software. ad The data presented are the combined results of three independent experiments. P values were determined by the Mann–Whitney U test. ***p < 0.001
Fig. 3
Fig. 3
LPCAT2 supports 5-Fu and Oxa-induced LD production. a SW620 and HT29 cells were stained with Bodipy 493/503 and analysed by flow cytometry after 24, 48, 72 and 96 h of seeding. Bodipy 493/503 median of fluorescence intensity (MFI) was used to assess LD content. The multiple Student t test was used to compare cell lines at each time point and a two-way ANOVA with Bonferroni correction was used to compare MFI for each cell line at each time point (MFI at 24 h being used as control). ***p < 0.001. Error bars denote s.e.m. b SW620 vs HT29 cell growth curves (left panel). Doubling time was determined by the following equation: DT = (T − T0) × (log2) / (logN − logN0) (insert). The percentage of Ki67-positive cells was determined by flow cytometry after 48 h of seeding (right panel). Growth curve p values were determined by a two-way ANOVA with Bonferroni correction and the DT and percentage of Ki67-positive cells using the Student t test. *p < 0.05, ***p < 0.001. Error bars denote s.e.m. c Cells were stained with Nile red 48 h after vehicle (DMSO, NT), 5-Fu (10 µM), Oxa (10 µM) or FOX (5-Fu + Oxa, 10 µM each) treatments. The number of LDs per cell (lower panel) was obtained by counting red lipid bodies on merged pictures (300 cells per condition) (upper panel) (scale bar = 10 µm). Whiskers denote 1st and 99th percentiles. P values were determined by the multiple Student t test. ***p < 0.001. d Relative LPCAT2 and PLIN2 mRNA expression levels at 0, 2, 6, 24 and 48 h after vehicle, 5-Fu, Oxa or FOX treatments. ACTB was used as a housekeeping gene to calculate ΔCt. The data are expressed as fold changes calculated with 2-(ΔCt treatment/ΔCt vehicle). The data are the results from three independent experiments. P values were determined by two-way ANOVA with Bonferroni correction. *p < 0.05, **p < 0.01, ***p < 0.001. Error bars denote s.e.m. eg LD content at 48 h of chemotherapy treatments in (e) SW620-Ctl vs SW620-lpcat2 cells; (f) HT29 cells transiently transfected with sineg vs. silpcat2; (g) vehicle (DMSO) vs. TSI-01 (10 µM) co-treatment. Whiskers denote 1st and 99th percentiles. P values were determined by the multiple Student t test. *p < 0.05, **p < 0.01, ***p < 0.001
Fig. 4
Fig. 4
LPCAT2-dependent LD production confers CRC resistance to chemotherapy. a Cell viability of CRC cell lines after 48 h of treatment with concentration ranges of 5-Fu and Oxa. IC50 for each cell line was compared to the basal LD content and Spearman correlation coefficients were calculated. Error bars denote s.e.m. bd Annexin V/7AAD staining after 72 h of treatment with vehicle (NT), 5-Fu, Oxa or FOX in (b) SW620-Ctl vs. SW620-lpcat2 cells; (c) HT29 cells transiently transfected with sineg vs. silpcat2; (d) HT29 cells co-treated or not with TSI-01. The data are mean ± s.e.m. of three independent experiments. P values were determined by the multiple Student t test. *p < 0.05, **p < 0.01, ***p < 0.001. e Eight-week-old female balb/c mice bearing CT26-Ctl or CT26-lpcat2 tumours (n = 10 per group) received i.p. FOX injections (5-Fu, 5 mg/kg + Oxa, 6 mg/kg) once a week for 3 weeks. P values were determined by a two-way ANOVA with Bonferroni correction. ***p < 0.001. Tumour size in mm2 over time is represented as median ± s.em. f Kaplan–Meier cumulative survival plots for mice groups described in (e), with p values assessed by the log-rank test. g Histological LPCAT2 staining performed on hepatic metastasis samples from CRC patients (n = 79). Representative images of thyroid sections and tumours with low and high-LPCAT2 expression are shown at ×2.5 and ×20 magnification (sections, 1 mm and 100 µm, respectively). h Relapse-free survival (RFS) based on LPCAT2 scoring, on all CRC patients (n = 79; all patients, left panel) and on those who had received neoadjuvant chemotherapy (n = 54; treated group patients, right panel). Kaplan–Meier plots are presented with p values assessed by the log-rank test
Fig. 5
Fig. 5
LPCAT2-induced LD accumulation blunts chemotherapy-induced ER stress. a Impact of LPCAT2 on chemotherapy-induced cell death pathways in SW620-lpcat2 vs. SW620-Ctl cells after 24 and 48 h of treatments. A representative blot of pro- and cleaved forms of caspases 8, 9, 12, 3 and PARP is shown from three independent experiments. HSC-70 was used as loading control. b ER tracker staining was performed 24 h after chemotherapy treatments. Representative images of three independent experiments are shown (×40 magnification, scale bar = 20 µm) (upper panel). ER tracker median of fluorescence intensity (MFI) was calculated in three independent experiments (300 cells per condition) (lower panel). P values were determined by the multiple Student t test. ***p < 0.001. Error bars denote s.e.m. c Western-blot analysis of ER stress markers Bip, CHOP, P-eif2α and total eif2α in SW620-lpcat2 and SW620-Ctl cells after 6, 16 and 24 h of chemotherapy treatments. β-actin was used as loading control
Fig. 6
Fig. 6
LPCAT2-induced LD accumulation blunts ecto-CRT exposure. a HT29 cells were treated for 48 h with or without FOX and then stained with Bodipy 493/503 (green) and CRT antibody (FMC75) conjugated with goat anti-mouse Alexa568 antibody (red) (upper panel). The Pearson correlation coefficient was calculated between CRT and Bodipy fluorescences (lower panel). b LDs were isolated from confluent cells treated or not with FOX for 48 h. A representative blot of compartment markers of LDs, total membrane (TM), cytosol (cyt) and post-nuclear supernatant (PNS) fractions is shown from three independent experiments. c Cell-surface CRT immunostaining after 24 and 48 h of chemotherapy treatments. Data represent CRT-positive cells in the DAPI-negative fraction. Data are mean ± s.e.m. of three independent experiments. P values were determined by the multiple Student t test. *p < 0.05, **p < 0.01, ***p < 0.001. Error bars denote s.e.m
Fig. 7
Fig. 7
Inhibition of LD production restores chemotherapy-induced ER stress. a Nile red LD staining in HT29 cells treated with chemotherapy in the absence (NT) or presence of triacsin C (10 µM). Mean number of LDs /cell with whiskers denoting 1st and 99th percentiles. P values were determined by the multiple Student t test. *p < 0.05, **p < 0.01, ***p < 0.001. b Impact of pharmacological inhibition of LD production on HT29 cell viability after 72 h of treatments. The data are mean ± s.e.m. of three independent experiments. P values were determined by the multiple Student t test. *p < 0.05, **p < 0.01. c Representative blot of ER stress marker expression from HT29 cells treated or not with FOX, in the absence (FOX) or presence of triacsin C (FOXT) from three independent experiments. β-actin was used as the loading control. d Left panel, representative pseudocolor flow cytometry plots with gating strategy. Gating was performed on DAPI-negative cells with low expression of the LD marker PLIN2 (PLIN2low) and with high CRT plasma membrane expression (CRThigh). Right panel, mean percentages ± s.e.m. of PLIN2low and CRThigh cells corresponding to three independent experiments. P values were determined by two-way ANOVA with Bonferroni correction. *p < 0.05, **p < 0.01, ***p < 0.001
Fig. 8
Fig. 8
Inhibition of LD production promotes tumour regression. a Twelve-week-old female balb/c mice (n = 32) bearing CT26-Ctl or CT26-lpcat2 tumours were subdivided into four groups (n = 8 per group) and intraperitoneally injected with triacsin C (2 mg/kg) once a week for 3 weeks followed the next day by FOX, or with FOX and triacsin C alone or with vehicles alone (NT groups). Tumour size in mm2 over time is represented as median ± s.e.m. P values were determined by two-way ANOVA with Bonferroni correction. *p < 0.05, **p < 0.01, ***p < 0.001. b Kaplan–Meier plots with time of death as endpoint for mice described in a are presented with p values assessed by a log-rank test. c Twelve-week-old female NMRI-nude mice (n = 32) bearing CT26-Ctl (left panels) or CT26-lpcat2 (right panels) tumours were subdivided into four groups (n = 8 per group) and treated as described in a. d Kaplan–Meier plots with time of death as endpoint for mice described in c are presented with p values assessed by the log-rank test
Fig. 9
Fig. 9
LPCAT2-induced LD accumulation prevents ICD. a Vaccination experiments: upper panel, percentage over time of tumour-free mice for each group. Lower panel, growth curves over time of setting tumours (n = 9 of 8-week-old female balb/c mice per group). Values are mean ± s.e.m. P values were determined by two-way ANOVA with Bonferroni correction. *p < 0.05, **p < 0.01, ***p < 0.001. b CT26-lpcat2 (n = 20) and CT26-Ctl (n = 20) tumour-bearing 8-week-old female balb/c mice were subdivided into two groups (n = 10 per group) and intraperitoneally injected with vehicle or FOX. Tumour grafts were immunostained for CD3+CD8+ T-cell-subtype identification and PD-1 and Tim-3 subpopulation phenotyping. Fold change of the number of CD8+ T cells and percentage of sub-populations among CD8+ cells were calculated for each condition according to their respective untreated group. P values were determined by the multiple Student t test. *p < 0.05, **p < 0.01, ***p < 0.001. The data represent medians with interquartile ranges. c Supernatants of dissociated tumours described in b) were assayed by ELISA for IFN-γ secretion. P values were determined by two-way ANOVA with Bonferroni correction. *p < 0.05, **p < 0.01, ***p < 0.001. Error bars denote s.e.m. d Histological LPCAT2 and CD8 immunostainings performed on hepatic metastasis samples from 56 CRC patients. Absolute quantification of CD8+ T cells in the metastatic, peri-metastatic, invasion and total site was performed and compared between groups with low and high-LPCAT2 expression/scoring. Comparisons were made for all CRC patients (n = 56) and for patients who received neoadjuvant chemotherapy (n = 32). P values were determined by Mann–Whitney U test. *p < 0.05
Fig. 10
Fig. 10
Suggested model for chemotherapy-resistant CRC phenotype mediated by LPCAT2 overexpression. Contrary to sensitive cells, FOX treatment in high-LPCAT2 cells promotes LD accumulation leading to 1) ER homeostasis, 2) CRT sequestration into LD. The resulting failure in DC maturation leads to limited recruitment/activation of naïve CD8+ T cells via co-stimulatory factors CD80/86/MHC-I and CD28/TCR. Impaired ICD associated with reduced recruitment of IFNγ-secreting CD8+ T cells to tumour site could consequently avoid PD-L1 and PD-1 exposure on tumour and CD8+ T cells, respectively, and thus may lead to immunotherapy failure in addition to FOX resistance. HMGB1 High-mobility group box, IFN-γ interferon gamma, PD-1 programmed cell death-1, PD-L1 programmed cell death ligand-1, TCR T-cell receptor, MHC-I major histocompatibility complex-I

References

    1. Pavlova NN, Thompson CB. The emerging hallmarks of cancer metabolism. Cell. Metab. 2016;23:27–47. doi: 10.1016/j.cmet.2015.12.006. - DOI - PMC - PubMed
    1. Iurlaro R, Leon-Annicchiarico CL, Munoz-Pinedo C. Regulation of cancer metabolism by oncogenes and tumor suppressors. Methods Enzymol. 2014;542:59–80. doi: 10.1016/B978-0-12-416618-9.00003-0. - DOI - PubMed
    1. Beloribi-Djefaflia S, Vasseur S, Guillaumond F. Lipid metabolic reprogramming in cancer cells. Oncogenesis. 2016;5:e189. doi: 10.1038/oncsis.2015.49. - DOI - PMC - PubMed
    1. Yue S, et al. Cholesteryl ester accumulation induced by PTEN loss and PI3K/AKT activation underlies human prostate cancer aggressiveness. Cell. Metab. 2014;19:393–406. doi: 10.1016/j.cmet.2014.01.019. - DOI - PMC - PubMed
    1. Qiu B, et al. HIF2alpha-dependent lipid storage promotes endoplasmic reticulum homeostasis in clear-cell renal cell carcinoma. Cancer Discov. 2015;5:652–667. doi: 10.1158/2159-8290.CD-14-1507. - DOI - PMC - PubMed

Publication types

MeSH terms

LinkOut - more resources