. 2018 Jan 22;9(1):321.
doi: 10.1038/s41467-017-02380-9.

Re-analysis of public genetic data reveals a rare X-chromosomal variant associated with type 2 diabetes

Affiliations

Re-analysis of public genetic data reveals a rare X-chromosomal variant associated with type 2 diabetes

Sílvia Bonàs-Guarch et al. Nat Commun. .

Erratum in

  • Publisher Correction: Re-analysis of public genetic data reveals a rare X-chromosomal variant associated with type 2 diabetes.
    Bonàs-Guarch S, Guindo-Martínez M, Miguel-Escalada I, Grarup N, Sebastian D, Rodriguez-Fos E, Sánchez F, Planas-Fèlix M, Cortes-Sánchez P, González S, Timshel P, Pers TH, Morgan CC, Moran I, Atla G, González JR, Puiggros M, Martí J, Andersson EA, Díaz C, Badia RM, Udler M, Leong A, Kaur V, Flannick J, Jørgensen T, Linneberg A, Jørgensen ME, Witte DR, Christensen C, Brandslund I, Appel EV, Scott RA, Luan J, Langenberg C, Wareham NJ, Pedersen O, Zorzano A, Florez JC, Hansen T, Ferrer J, Mercader JM, Torrents D. Bonàs-Guarch S, et al. Nat Commun. 2018 May 30;9(1):2162. doi: 10.1038/s41467-018-04170-3. Nat Commun. 2018. PMID: 29849136 Free PMC article.

Abstract

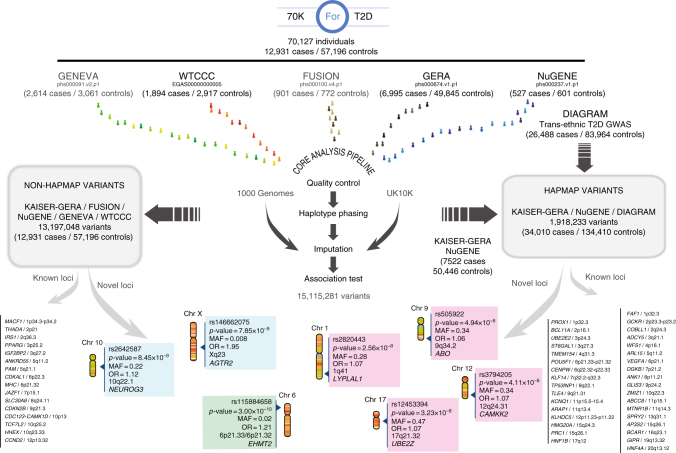
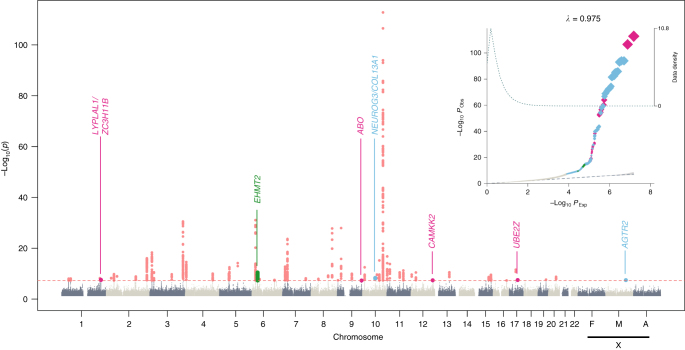
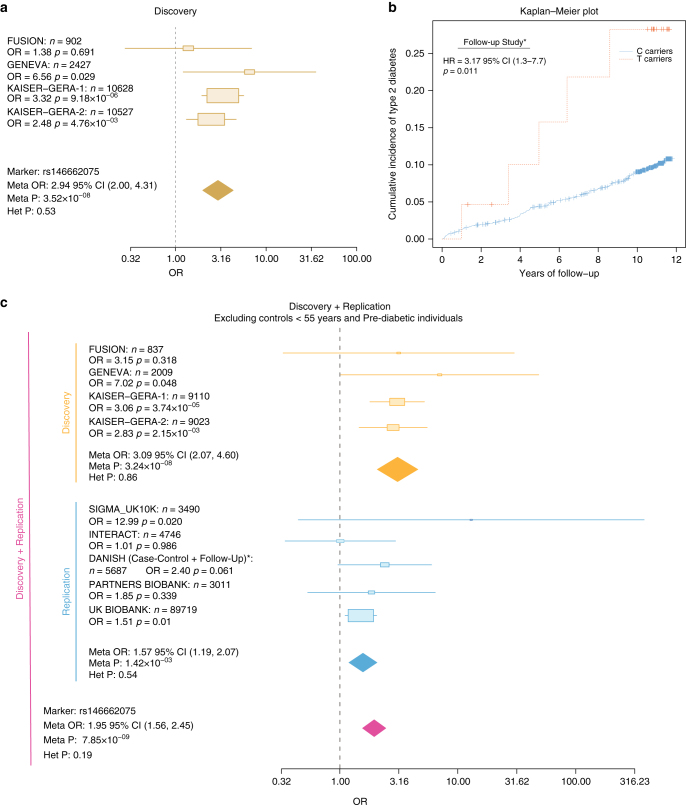
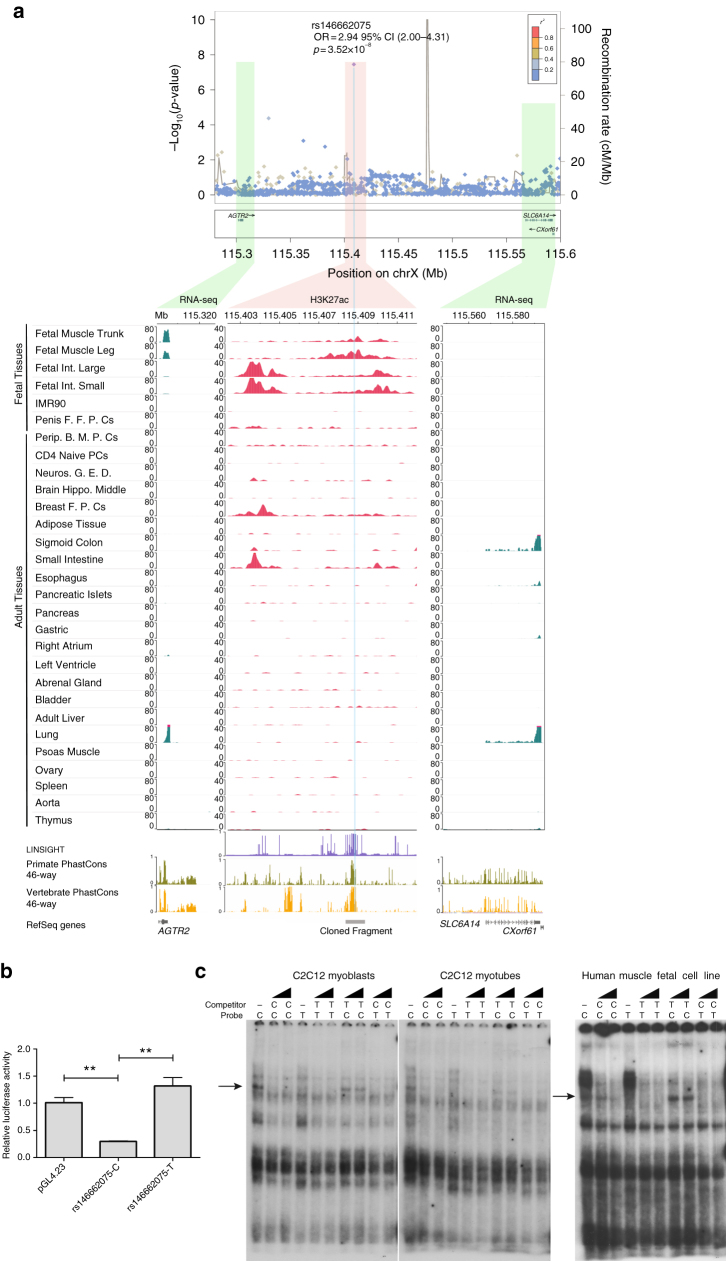
The reanalysis of existing GWAS data represents a powerful and cost-effective opportunity to gain insights into the genetics of complex diseases. By reanalyzing publicly available type 2 diabetes (T2D) genome-wide association studies (GWAS) data for 70,127 subjects, we identify seven novel associated regions, five driven by common variants (LYPLAL1, NEUROG3, CAMKK2, ABO, and GIP genes), one by a low-frequency (EHMT2), and one driven by a rare variant in chromosome Xq23, rs146662057, associated with a twofold increased risk for T2D in males. rs146662057 is located within an active enhancer associated with the expression of Angiotensin II Receptor type 2 gene (AGTR2), a modulator of insulin sensitivity, and exhibits allelic specific activity in muscle cells. Beyond providing insights into the genetics and pathophysiology of T2D, these results also underscore the value of reanalyzing publicly available data using novel genetic resources and analytical approaches.


Conflict of interest statement

The authors declare no competing financial interests.

Figures

Fig. 1
Fig. 1
Discovery and replication strategy. Publicly available GWAS datasets representing a total of 12,931 cases and 57,196 controls (70KforT2D) were first quality controlled, phased, and imputed, using 1000G and UK10K separately. For those variants that were present in the DIAGRAM trans-ethnic meta-analysis, we used the summary statistics to meta-analyze our results with the cohorts that had no overlap with any of the cohorts included in the DIAGRAM trans-ethnic meta-analysis. With this first meta-analysis, we discovered four novel loci (within magenta panels). For the rest of the variants, we meta-analyzed all the 70KforT2D data sets, which resulted in two novel loci (in blue panels). All the variants that were coding and  showed a p-value of  ≤ 1 × 10−4 were tested for replication by interrogating the summary statistics in the Type 2 Diabetes Knowledge Portal (T2D Portal) (http://www.type2diabetesgenetics.org/). This uncovered a novel low-frequency variant in the EHMT2 gene (highlighted with a green panel)
Fig. 2
Fig. 2
Manhattan and quantile–quantile plot (QQ-plot) of the discovery and replication genome-wide meta-analysis. The upper corner represents the QQ-plot. Expected −log10 p-values under the null hypothesis are represented in the x axis, while observed −log10 p-values are represented in the y axis. Observed p-values were obtained according to the suitable replication dataset used (as shown in Fig. 1) and were depicted using different colors. HapMap variants were meta-analyzed using the trans-ethnic summary statistics from the DIAGRAM study and our meta-analysis based on the Genetic Epidemiology Research on Aging (GERA) cohort and the northwestern NuGENE project, and that resulted in novel associations depicted in magenta. The rest of non-HapMap variants meta-analyzed using the full 70KforT2D cohort are represented in gray, and the fraction of novel GWAS-significant variants is highlighted in light blue. Coding low-frequency variants meta-analyzed using the 70KforT2D and the T2D Portal data that resulted in novel GWAS-significant associations are depicted in green. The shaded area of the QQ-plot indicates the 95% confidence interval under the null and a density function of the distribution of the p-values was plotted using a dashed line. The λ is a measure of the genomic inflation and corresponds to the observed median χ2 test statistic divided by the median expected χ2 test statistic under the null hypothesis. The Manhattan plot, representing the −log10 p-values, was colored as explained in the QQ-plot. All known GWAS-significant associated variants within known T2D genes are also depicted in red. X chromosome results for females (F), males (M), and all individuals (A) are also included
Fig. 3
Fig. 3
Discovery and replication of rs14666075 association signal. a Forest plot of the discovery of rs146662075 variant. Cohort-specific odds ratios are denoted by boxes proportional to the size of the cohort and 95% CI error bars. The combined OR estimated for all the data sets is represented by a diamond, where the diamond width corresponds to 95% CI bounds. The p-value for the meta-analysis (Meta P) and for the heterogeneity (Het P) of odds ratio is shown. b Kaplan–Meier plot showing the cumulative incidence of T2D for a 11 years follow-up. The red line represents the T carriers and in light blue, C carriers are represented (n = 1,652, cases = 158). c Forest plot after excluding controls younger than 55 years, OGTT >7.8 mmol l−1, and controls with family history of T2D in both the discovery and replication cohorts when available
Fig. 4
Fig. 4
Functional characterization of rs146662075 association signal. a Signal plot for X chromosome region surrounding rs146662075. Each point represents a variant, with its p-value (on a −log10 scale, y axis) derived from the meta-analysis results from association testing in males. The x axis represents the genomic position (hg19). Below, representation of H3K27ac and RNA-seq in a subset of cell types is shown. The association between RNA-seq signals and H3K27ac marks suggests that AGTR2 is the most likely regulated gene by the enhancer that harbors rs146662075. b The presence of the common allelic variant rs146662075-C reduces enhancer activity in luciferase assays performed in a mouse myoblast cell line. c Electrophoretic mobility shift assay in C2C12 myoblast cell lines, C2C12-differentiated myotubes, and human fetal myoblasts showed allele-specific binding of a ubiquitous nuclear complex. The arrows indicate the allele-specific binding event. Competition was carried out using 50- and 100-fold excess of the corresponding unlabeled probe

References

    1. Welter D, et al. The NHGRI GWAS catalog, a curated resource of SNP-trait associations. Nucleic Acids Res. 2014;42:D1001–D1006. doi: 10.1093/nar/gkt1229. - DOI - PMC - PubMed
    1. Huang J, et al. Improved imputation of low-frequency and rare variants using the UK10K haplotype reference panel. Nat. Commun. 2015;6:8111. doi: 10.1038/ncomms9111. - DOI - PMC - PubMed
    1. Tukiainen T, et al. Chromosome X-wide association study identifies loci for fasting insulin and height and evidence for incomplete dosage compensation. PLoS Genet. 2014;10:e1004127. doi: 10.1371/journal.pgen.1004127. - DOI - PMC - PubMed
    1. Flannick J, Florez JC. Type 2 diabetes: genetic data sharing to advance complex disease research. Nat. Rev. Genet. 2016;17:535–549. doi: 10.1038/nrg.2016.56. - DOI - PubMed
    1. Steinthorsdottir V, et al. Identification of low-frequency and rare sequence variants associated with elevated or reduced risk of type 2 diabetes. Nat. Genet. 2014;46:294–298. doi: 10.1038/ng.2882. - DOI - PubMed

Publication types