. 2018 Jan 22;8(1):1373.
doi: 10.1038/s41598-017-19086-z.

Insights into cerebral haemodynamics and oxygenation utilising in vivo mural cell imaging and mathematical modelling

Affiliations

Insights into cerebral haemodynamics and oxygenation utilising in vivo mural cell imaging and mathematical modelling

Paul W Sweeney et al. Sci Rep. .

Abstract

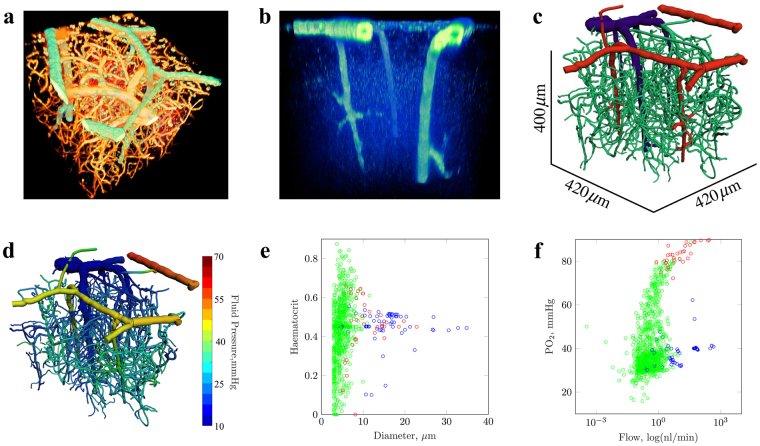
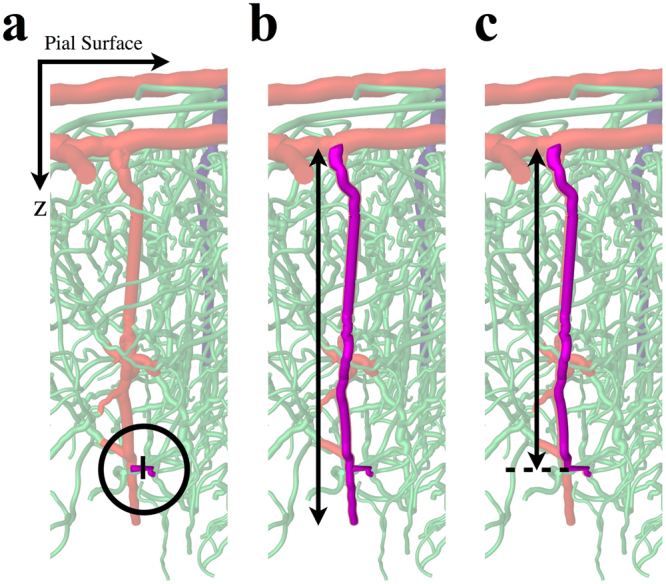
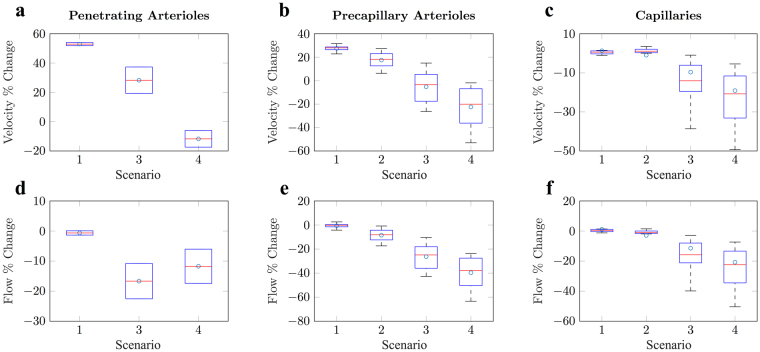
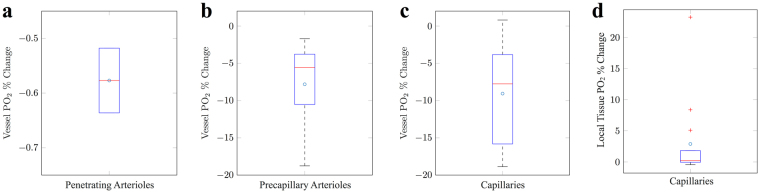
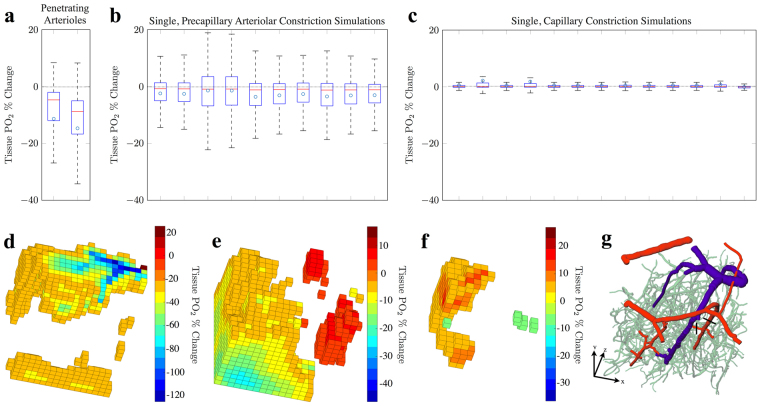
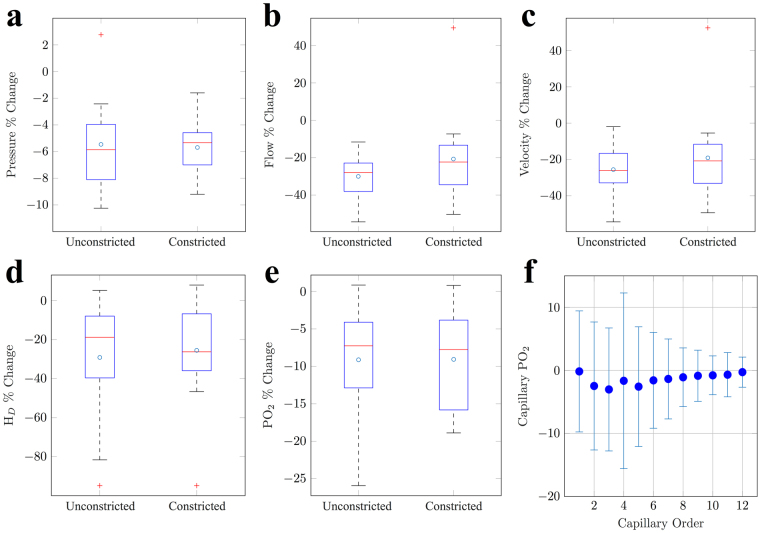
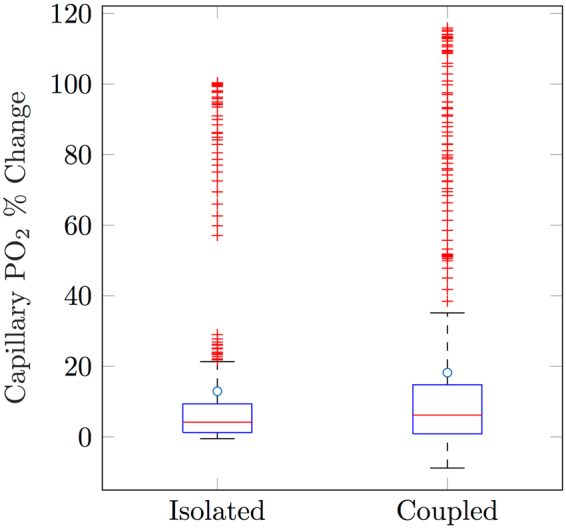
The neurovascular mechanisms underpinning the local regulation of cerebral blood flow (CBF) and oxygen transport remain elusive. In this study we have combined novel in vivo imaging of cortical microvascular and mural cell architecture with mathematical modelling of blood flow and oxygen transport, to provide new insights into CBF regulation that would be inaccessible in a conventional experimental context. Our study indicates that vasoconstriction of smooth muscle actin-covered vessels, rather than pericyte-covered capillaries, induces stable reductions in downstream intravascular capillary and tissue oxygenation. We also propose that seemingly paradoxical observations in the literature around reduced blood velocity in response to arteriolar constrictions might be caused by a propagation of constrictions to upstream penetrating arterioles. We provide support for pericytes acting as signalling conduits for upstream smooth muscle activation, and erythrocyte deformation as a complementary regulatory mechanism. Finally, we caution against the use of blood velocity as a proxy measurement for flow. Our combined imaging-modelling platform complements conventional experimentation allowing cerebrovascular physiology to be probed in unprecedented detail.


Conflict of interest statement

The authors declare that they have no competing interests.

Figures

Figure 1
Figure 1
Mathematical modelling of blood flow in the cortical microvasculature, using 3D confocal imaging data from transgenic mice. (a) A view of the cortical vascular network showing smooth muscle actin-covered vessels (SMA, green), from transgenic expression of m-Cherry, and blood vessel lumen (orange), from exogeneous administration of fluorescent dextran. (b) An enhanced view showing the location of SMA-expressing vessels. (c) The vascular network, following image segmentation, with vessels colour-coded based on classification (red: SMA-expressing arterioles; blue: veins; green: capillaries). (d) Simulated cortical blood pressures within the cortical network. (e) A scatter plot of vessel diameter against simulated, blood vessel haematocrit from our baseline simulation. (f) A scatter plot of volumetric blood flow (nL/min) against intravascular PO2 (mmHg). Data points in (e) and (f) are colour-coded according to vessel classification, as per (c).
Figure 2
Figure 2
Sites of simulated blood vessel constrictions in SMA-expressing vessels (purple). (a) The location of single branching-order precapillary arteriole constriction (circled); the black line indicates the site of a single-cell constriction. (b) Constriction of a precapillary arteriole, with bi-directional constriction cascade to the entire adjoining penetrating arteriole. (c) Constriction of a precapillary arteriole and uni-directional propagation to upstream sections of the penetrating arteriole. The dashed line indicates the point at which the penetrating arteriole bifurcates to the precapillary arteriole.
Figure 3
Figure 3
Box plots showing simulated blood velocity and flow changes in response to vasoconstriction. The top row of graphs shows blood velocity changes as a percentage of the baseline solution, and the bottom row shows blood flow changes. From left to right, plots show the responses to constrictions in penetrating arterioles (left), precapillary arterioles (middle) and capillaries (right). Results are presented for each constriction scenario (1) single-cell constriction, (2) constriction of the entire vessel, (3) bi-directional and (4) uni-directional constriction of the local penetrating arteriole. Note, cases (2) and (3) are equivalent for penetrating arterioles and the mean values for each are indicated with circles. Case 4 for penetrating arterioles provides the velocity change for the neighbouring downstream vessel from the site of constriction. Mean values are indicated in blue. See Supplementary Fig. S2 for outliers.
Figure 4
Figure 4
Simulated single vessel constrictions and the subsequent change in vessel and tissue PO2. Box plots indicated the percentage change in vessel PO2 in constricted (a) penetrating arterioles, (b) precapillary arterioles and (c) capillaries, when compared to baseline PO2 in said vessel. Noting, for (a,b) constriction cascade is induce by constriction of SMA-covered vessels. (d) The percentage change in local tissue PO2 as a consequence of constrictions in (c). Mean values are indicated in blue and outliers (data larger than q3 + 3(q3 − q1)/2 or smaller than q1 − 3(q3 − q1)/2, where q1 and q3 are the 25th and 75th percentiles, respectively) by red crosses.
Figure 5
Figure 5
Simulated single vessel constrictions (a total of 25, with constriction cascade induced by constriction of SMA-covered vessels) and the subsequent changes in global tissue PO2. Box plots indicated the percentage change in tissue PO2, when compared to baseline tissue PO2, as a consequence of singular constrictions of (a) penetrating arterioles, (b) precapillary arterioles and (c) capillaries. (d,e,f) 3-dimensional visualisations of spatial changes in tissue PO2 as a result of constrictions in (d) a penetrating arteriole, (e) a precapillary arteriole and (f) a capillary. (g) 3-dimensional visualisation of the cortical network, in which black lines indicate the initial site of constriction for (d) and (e), and where the capillary constriction in (f) occurred downstream of (e). Note, absolute percentage changes < 20% for (d) and absolute values < 5% for (e) and (f) are not shown, for clarity.
Figure 6
Figure 6
Simulating SMA constriction cascade following pericyte constriction. Percentage changes in: 1) unconstricted and 2) constricted capillaries with uni-directional SMA propagation for (a) pressure, (b) flow, (c) velocity, (d) haematocrit (HD) and (e) vessel PO2. (f) A plot of mean change in capillary PO2 against capillary order, as a result of local SMA constriction. Error bars represent standard deviation and, consequently, the redistribution of O2 through the cortical network.
Figure 7
Figure 7
Capillary PO2 changes initiated by erythrocyte deformation. Box plots show the percentage change in PO2 for capillaries initially below 25 mmHg, for erythrocyte deformation occuring in isolation, and when coupled to arteriolar (SMA) dilation.

Similar articles

Cited by

References

    1. Dore SE. On the contractility and nervous supply of the capillaries. British Journal of Dermatology. 1923;35:398–404. doi: 10.1111/j.1365-2133.1923.tb09069.x. - DOI
    1. Hall CN, et al. Capillary pericytes regulate cerebral blood flow in health and disease. Nature. 2014;508:55–60. doi: 10.1038/nature13165. - DOI - PMC - PubMed
    1. Hamilton NB, Attwell D, Hall CN. Pericyte-mediated regulation of capillary diameter: a component of neurovascular coupling in health and disease. Frontiers in neuroenergetics. 2010;2:1–14. doi: 10.3389/fnene.2010.00005. - DOI - PMC - PubMed
    1. Stefanovic B, et al. Functional reactivity of cerebral capillaries. Journal of Cerebral Blood Flow & Metabolism. 2008;28:961–972. doi: 10.1038/sj.jcbfm.9600590. - DOI - PMC - PubMed
    1. Armulik A, Genové G, Betsholtz C. Pericytes: Developmental, Physiological, and Pathological Perspectives, Problems, and Promises. Developmental Cell. 2011;21:193–215. doi: 10.1016/j.devcel.2011.07.001. - DOI - PubMed

Publication types

LinkOut - more resources