. 2018 Jan 22;9(1):310.
doi: 10.1038/s41467-017-02235-3.

Single-cell genomics of multiple uncultured stramenopiles reveals underestimated functional diversity across oceans

Collaborators, Affiliations

Single-cell genomics of multiple uncultured stramenopiles reveals underestimated functional diversity across oceans

Yoann Seeleuthner et al. Nat Commun. .

Abstract

Single-celled eukaryotes (protists) are critical players in global biogeochemical cycling of nutrients and energy in the oceans. While their roles as primary producers and grazers are well appreciated, other aspects of their life histories remain obscure due to challenges in culturing and sequencing their natural diversity. Here, we exploit single-cell genomics and metagenomics data from the circumglobal Tara Oceans expedition to analyze the genome content and apparent oceanic distribution of seven prevalent lineages of uncultured heterotrophic stramenopiles. Based on the available data, each sequenced genome or genotype appears to have a specific oceanic distribution, principally correlated with water temperature and depth. The genome content provides hypotheses for specialization in terms of cell motility, food spectra, and trophic stages, including the potential impact on their lifestyles of horizontal gene transfer from prokaryotes. Our results support the idea that prominent heterotrophic marine protists perform diverse functions in ocean ecology.


Conflict of interest statement

The authors declare no competing financial interests.

Figures
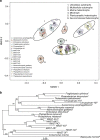
Fig. 1
Fig. 1
Marine heterotrophic SAG lineages form a functional group distinct from autotrophs and other heterotrophs. a Non-metric multidimensional scaling (NMDS) projection of a Bray–Curtis distance matrix that shows Pfam motif occurrences in various stramenopile genomes. Because the genome sequences are incomplete, a rarefying procedure was applied to obtain 1400 Pfam motifs per genome. Ten independent rarefied samples were obtained and used for NMDS. Ellipses (at 95% confidence limit) were drawn by using the ‘ordiellipse’ function of the vegan package in R, with the group defined by life history mode (indicated by number in top right). Letters indicate the positions of the mean coordinates of the 10 rarefied Pfam counts per organism. The analysis was conducted on 19 stramenopile genomes, which included MAST-4D. Marine heterotrophic stramenopiles from this study form a large but coherent group (Group 3), which is distinct from autotrophic species and heterotrophic species from other environments. b Phylogenetic tree from the analysis of a total of 160 conserved eukaryotic proteins using maximum likelihood. Protein sequences of Incisomonas marina from ref. are included. Indices indicate life history mode as in panel a. Bootstrap values are represented on internal nodes. The branch length represents the mean number of substitutions per site
Fig. 2
Fig. 2
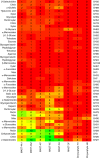
SAG lineage glycoside hydrolases (GHs). GH families are numbered (right) according to the CAZyme database. Potential substrates are indicated on the left side. Internal numbers represent the number of genes in each genome predicted to belong to the GH category. Colors indicate the number of predicted GH genes per family, from low (red) to high (green)
Fig. 3
Fig. 3
Biogeographic distribution of the SAG lineages based on metagenome read recruitment with separation between deep chlorophyll maximum and subsurface. Global maps showing the presence of the SAG lineages based on metagenomics read mapping at each Tara Oceans station either as a black dot (no signal detected) or as a circle whose diameter indicates the species relative abundance. Abundance in samples from deep chlorophyll maximum (DCM, left panel) often differs from surface samples (SRF, right panel): only MAST-4A shows the same pattern in DCM and SRF samples (a). The color inside each circle provides the median percentage similarity of the reads to the reference. The station from where the SAG originates is indicated by its number. a MAST-4A; b MAST-4C; c MAST-4D; d MAST-4E; e Chrysophyte H1; f Chrysophyte H2; g MAST-3A; and h MAST-3F
Fig. 4
Fig. 4
Water temperature and distribution of the heterotrophic protists. a x-axis represents the lineage composite genomes, and y-axis represents surface temperatures in degrees Celsius at each sampling location. Relative abundances are represented by circle size (one per station/depth where the genome was detected). The scale for each column is indicated below the name of the lineage. b MAST-3A abundance distribution relative to temperature. A difference in the distributions is observed with a p-value <2×10⁻² (Wilcoxon test). c MAST-4E abundance distribution relative to temperature. Means are statistically different with a p-value <3×10⁻⁴ (Wilcoxon test). In b and c, line type indicates median sequence similarity to the reference genome assembly

References

    1. Azam F, Malfatti F. Microbial structuring of marine ecosystems. Nat. Rev. Microbiol. 2007;5:782–791. doi: 10.1038/nrmicro1747. - DOI - PubMed
    1. Worden AZ, et al. Environmental science. Rethinking the marine carbon cycle: factoring in the multifarious lifestyles of microbes. Science. 2015;347:1257594. doi: 10.1126/science.1257594. - DOI - PubMed
    1. de Vargas C, et al. Ocean plankton. Eukaryotic plankton diversity in the sunlit ocean. Science. 2015;348:1261605. doi: 10.1126/science.1261605. - DOI - PubMed
    1. Lima-Mendez G, et al. Ocean plankton. Determinants of community structure in the global plankton interactome. Science. 2015;348:1262073. doi: 10.1126/science.1262073. - DOI - PubMed
    1. Heywood JL, Sieracki ME, Bellows W, Poulton NJ, Stepanauskas R. Capturing diversity of marine heterotrophic protists: one cell at a time. ISME J. 2011;5:674–684. doi: 10.1038/ismej.2010.155. - DOI - PMC - PubMed

Publication types