. 2018 Jan 22;9(1):309.
doi: 10.1038/s41467-017-02764-x.

Fluid network dynamics in the prefrontal cortex during multiple strategy switching

Affiliations

Fluid network dynamics in the prefrontal cortex during multiple strategy switching

Hugo Malagon-Vina et al. Nat Commun. .

Abstract

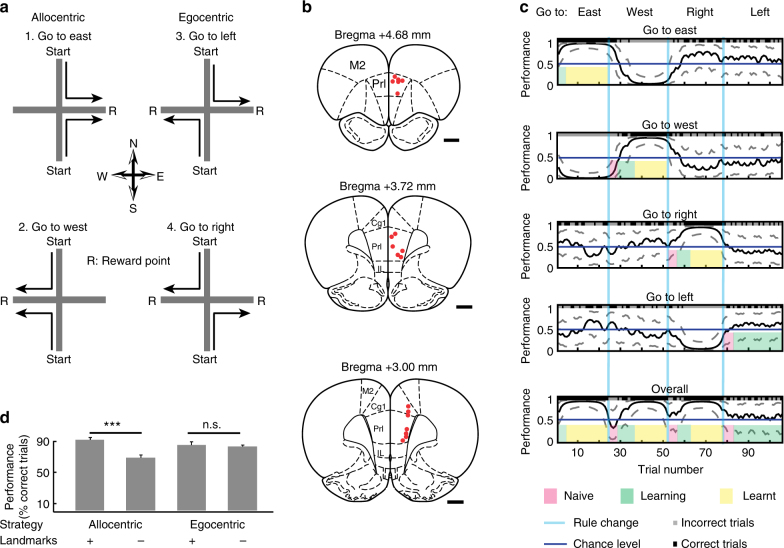
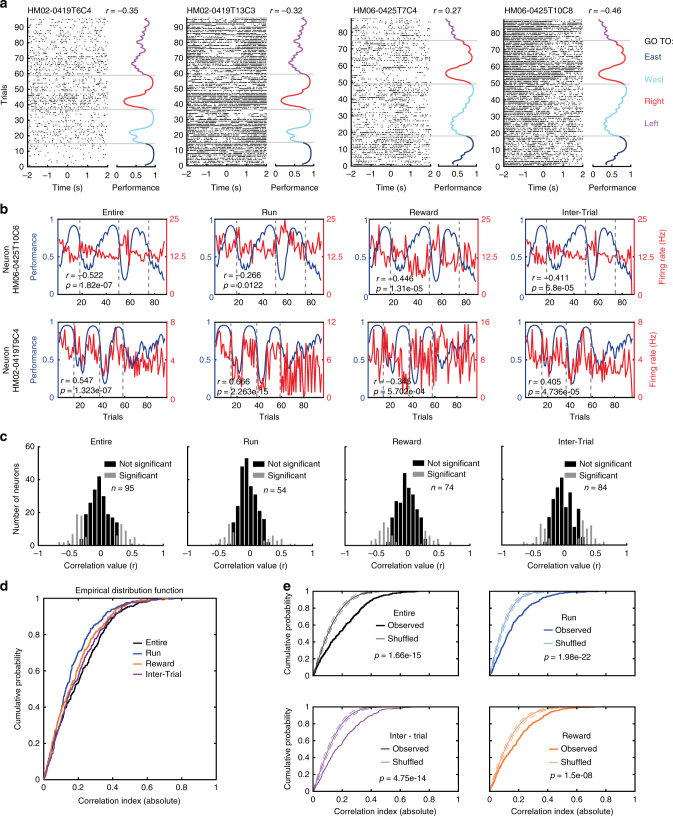
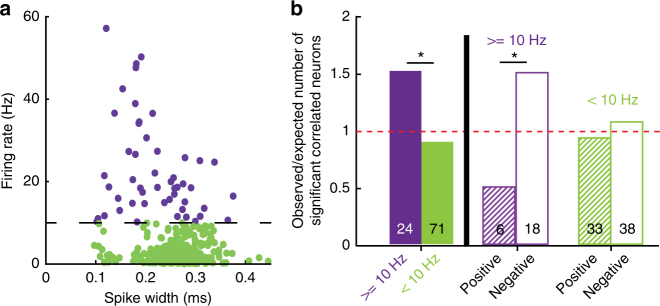
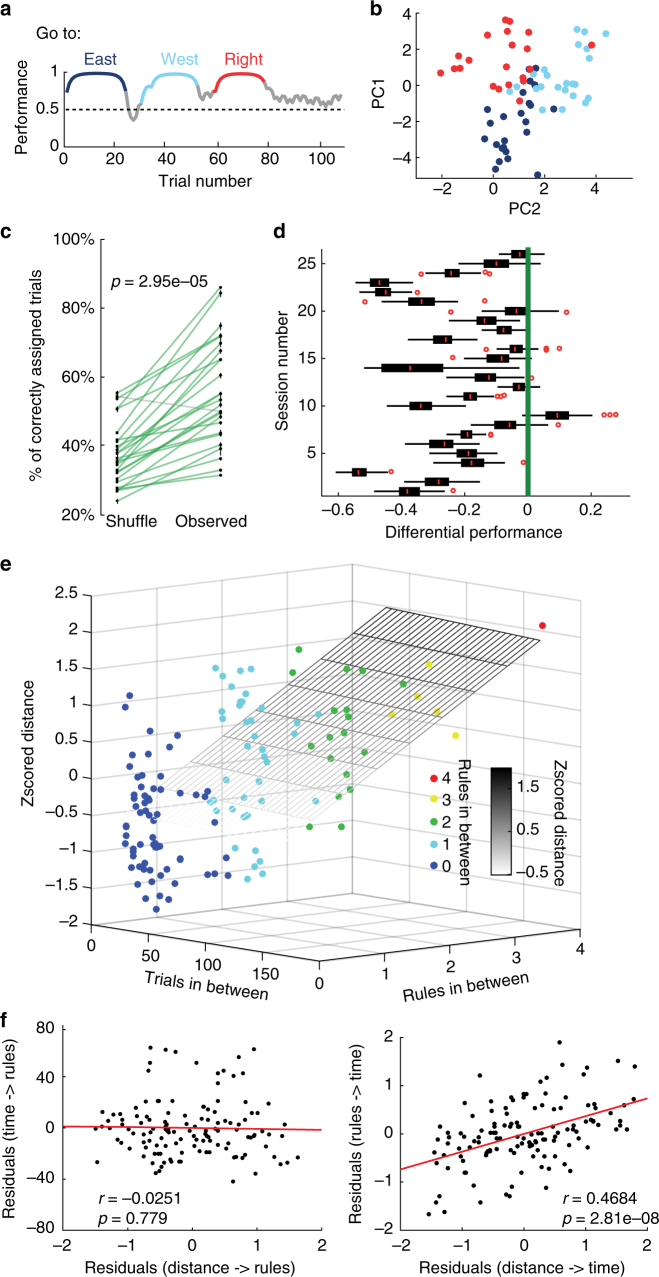
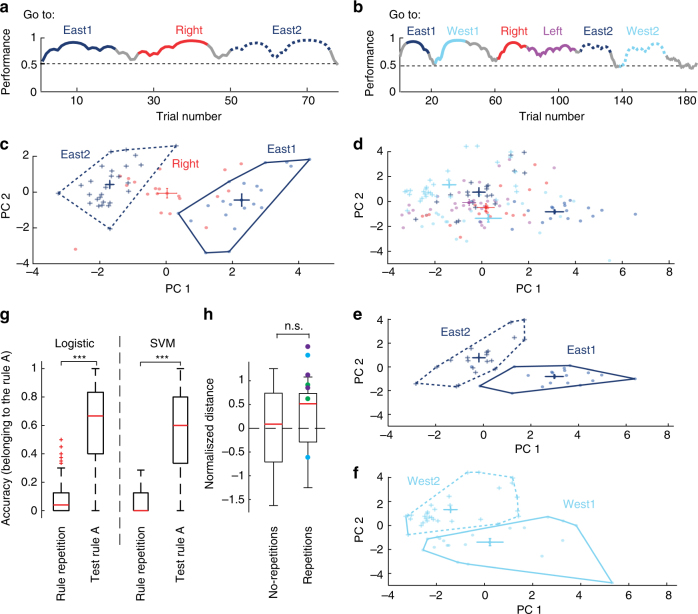
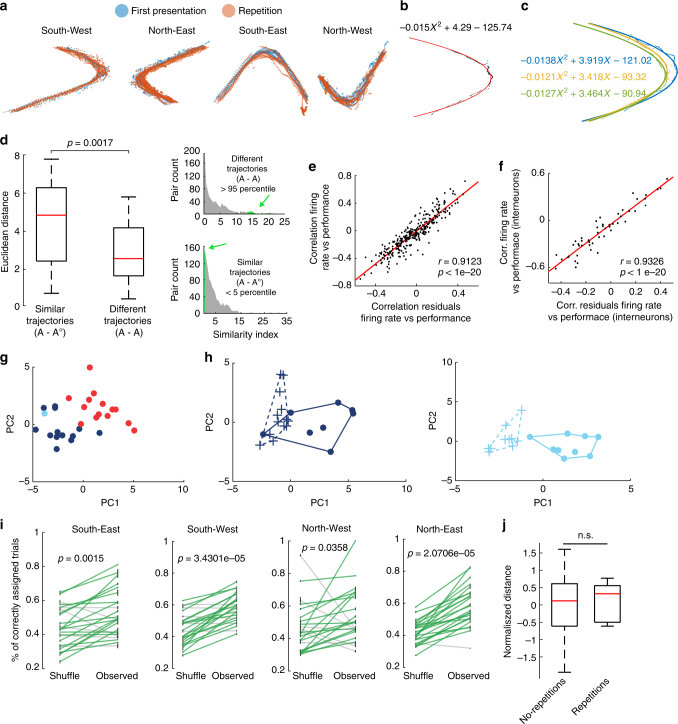
Coordinated shifts of neuronal activity in the prefrontal cortex are associated with strategy adaptations in behavioural tasks, when animals switch from following one rule to another. However, network dynamics related to multiple-rule changes are scarcely known. We show how firing rates of individual neurons in the prelimbic and cingulate cortex correlate with the performance of rats trained to change their navigation multiple times according to allocentric and egocentric strategies. The concerted population activity exhibits a stable firing during the performance of one rule but shifted to another neuronal firing state when a new rule is learnt. Interestingly, when the same rule is presented a second time within the same session, neuronal firing does not revert back to the original neuronal firing state, but a new activity-state is formed. Our data indicate that neuronal firing of prefrontal cortical neurons represents changes in strategy and task-performance rather than specific strategies or rules.


Conflict of interest statement

The authors declare no competing financial interests.

Figures

Fig. 1
Fig. 1
Strategy-switching task and behavioural analysis. a Rats were placed randomly at one of the two possible start positions during consecutive trials. On the basis of landmark-referenced (allocentric strategy, rules: 1, 2) or self-referenced (egocentric strategy, rules: 3, 4) navigation, the animal has to travel on a plus-maze in order to receive reward (R). After the rat makes 13 correct choices within 15 consecutive trials, the rule is changed unannounced to the animal. b Position of the recording sites (n = 19, number of rats = 3) in the prelimbic and cingulate cortex indicated by red dots in three different coronal sections of the prefrontal cortex. Scale bars, 1 mm. c Task performance of a behavioural session was evaluated using the binary data of behavioural choices (correct choice: black, incorrect choice: grey) via a Markov-chain Monte–Carlo analysis which provides a confidence interval for each trial. By thresholding the performance score of the lowest confidence interval in any of the learning curves (go east, go west, go to right or go to left) corresponding to different rules, three different behavioural phases were assigned to each trial: naive (below 0.1 for reversals and 0.3 for switches); learning (between 0.1 and 0.6 for reversals and 0.3–0.6 for switches); and learnt (over 0.6). d Task-performance during control experiments when landmarks on surrounding walls were removed or maintained during allocentric (n = 11) or egocentric (n = 13) strategies. Keeping the landmarks during allocentric strategies (n = 12 tests; performance = 90 ± 3.015 %; data are mean ± SEM), removing the landmarks during allocentric strategies (n = 11, performance = 68 ± 3.71 %), keeping the landmarks during egocentric strategies (n = 12, performance = 83 ± 4.14 %) and removing the landmarks during egocentric strategies (n = 13, performance = 81 ± 1.91%). Note that only the removal of landmarks during allocentric strategies resulted in a reduced task performance (Wilcoxon rank-sum test). *** indicates p < 0.001, N.S. indicates no significant. Error bars, s.e.m
Fig. 2
Fig. 2
The firing rate of individual neurons correlates with task-performance of the animal during multiple rule changes. a Individual spikes (black ticks) are plotted around the time of reward activation (0 s). The corresponding behavioural performance is plotted at the right of the raster plot and colour coded according to rules. Note that spike activity is modulated by the performance. The correlation value (r) between trial-by-trial firing rate and performance is indicated (Spearman correlation). Grey lines denote rule changes. b The firing rate of two neurons (Neuron HM06-0425T10C6 and Neuron HM02-0419T9C4) are negatively or positively correlated to performance during the task irrespective of the trial time segment. c Histograms of correlation values (firing rate versus task-performance) for 300 recorded neurons and for different trial segments. n represents number of neurons with firing rates significantly correlated to task performance (Spearman´s correlation, p < 0.05 after Bonferroni–Holm correction). d Cumulative distribution functions of individual neurons‘ correlation values for different trial segments. e Comparison of observed and shuffled cumulative distribution functions of individual neurons’ correlation values for different trial segments. Dotted lines indicate confident intervals at 2.5 and 97.5 %. Note that the firing rates of some neurons are correlated with task performance during all task periods
Fig. 3
Fig. 3
High-firing neurons are negatively correlated with task performance. a Scatter plot for firing rates versus spike width of all recorded neurons. Threshold for separation of high (purple) and low (green) firing neurons was arbitrarily set at 10 Hz. b Comparison of different groups for neurons with significant correlation between firing rate and task-performance of the animal. Y-axis indicates the ratio between observed number of significantly correlated neurons in a group and numbers expected by chance. Numbers at the bottom of each bar indicate n of each group. * indicates p < 0.05; Χ2 test. “ ≥ 10 Hz” (purple) and “ < 10 Hz” (green) indicate neurons with respective firing rates above or below 10 Hz
Fig. 4
Fig. 4
Firing rates of neurons change according to different rules followed by the animal. a During a behavioural session, the animal successfully adjusted its performance during three different rules presented consecutively. Highlighted episodes represent the trials used to generate the representations of network states. b Projection of multi-unit activity (n = 24 neurons) onto the two highest principal components for the session shown in (a). c Comparison between the performance of K-means clustering on the observed firing rates versus the performance of the k-means clustering on the shuffled firing rates (p = 2.95e−5, Wilcoxon signed-rank. d Normalised distributions of the performance (shuffle data minus observed data) for each of the 26 sessions, using the centre of mass as a starting point of the k-mean clustering algorithm. The green line references performance of the observed data. Red circles denote outliers. Box plots show median, 25th and 75th percentile. e Three-dimensional plot of a multiple linear regression with the z-scored Euclidean distance between clusters as the dependent variable. The regressors are the number of trials in between and the number of rules in between. The plane is the resulting equation of the regression. Note that the distances are better explained by the rules (p = 2.81e-08) than the number of trials (p = 0.779) in between. f Partial correlation plots of the distance between the centre of masses of the rules and the number of trials taking into account the number of rules (left) and the distance between centre of masses of the rules and the number of rules taking into account the number of trials (right)
Fig. 5
Fig. 5
The repeated presentation of the same rule is not accompanied with a reemergence of the same prefrontal network state of firing. a Behavioural session during which the animal performed successfully during three consecutive rules; the first and the third rule applied were identical (go east). b Behavioural session with 7 rules presented. Two rules are presented twice at different times (go east and go west). Highlighted performance represents the trials used to calculate firing-states. c Projection of multi-unit activity (n = 12 neurons) onto the two highest principal components for the session shown in (a). d Projection of multi-unit activity (n = 18 neurons) onto the two highest principal components for the behavioural session shown in (b). Network states of different rules are colour coded and the centre of mass of each of them is presented with error bars. e, f Isolated and non-overlapping network states of two different rules (top and bottom), which were presented twice during the session example in b. Note that the rules presented twice at different times during the same session (dark and light blue, straight and dotted contours) resulted in different firing states of the network. g Comparison of the accuracy of two classifiers (logistic and support vector machine) trained to detect a given rule ‘A’. Note that the classifiers can detect trials belonging the rule ‘A’, but failed at detecting its repetition ‘A°’ as part of rule ‘A’ (p < 1 × 10e−20 for both logistic and SVM classifiers, Wilcoxon rank-sum test). Box plots show median, 25th and 75th percentile. h Box plot indicating the normalised Euclidean distance measured between the centres of rules without dimensionality reduction. Red line indicates the median. Coloured dots indicate different animals (Green = HM02, Blue = HM06 and purple = HM07). Note that distances of rules with or without repetitions of the same rule were not significantly different (p = 0.58, Wilcoxon rank-sum test). Euclidean distances were normalised to account for a different number of rules which were presented between the same rule (see Methods). Box plots show median, 25th and 75th percentile
Fig. 6
Fig. 6
Trajectory and speed of the animal do not explain the different neuronal network representation of rules and its repetitions. a Overlapping running-trajectories during a rule and during the later repetition of the same rule. b Trajectory during one trial (black) and the fitted parabola (red). c Different trajectories in the same recording day and their fittings. d Right, similarity index distributions calculated for all possible pairs between trajectories during trials within a rule ‘A’ (top) and the possible pairs between trajectories during a rule ‘A’ and its repetition ‘A°’ (bottom). Green denotes similar (<5 percentile) and different (>95 percentile) pairs. Left, comparison of the Euclidean distance in the network firing state for trials with similar trajectories between a rule ‘A’ and its repetition ‘A°’ and for trials with different trajectories belonging only to rule ‘A’ (p = 0.0017, Wilcoxon rank-sum test). Box plots show median, 25th and 75th percentile. e After removing the effect of the trajectory and the speed of the animal, residuals remain correlated to performance, similar to neuronal firing rates (n = 300, p < 1e−20, r = 0.9123, Spearman correlation). f Same as (e) but for firing rates of putative interneurons (n = 50, p < 1e−20, Spearman correlation). g Projection of the multi-unit activity residuals onto the first two principal components for the session shown in Fig. 5a. h Isolated and non-overlapping network states (using the residuals) during two different rules (left and right) which were presented twice during the session shown in Fig. 5b. i Comparison between the performance of k-means clustering on firing rate residuals vs. the performance of the k-means clustering on the shuffled firing rate residuals, for the four possible trajectories (South-East, p = 0.0015; South-West, p = 3.43e−05; North–West, p = 0.0358; North-East, p = 2.07e−05. Wilcoxon signed-rank test). j Box plot indicating the normalised Euclidean distance measured between the centres of rules without dimensionality reduction in the network state formed by the firing rate residuals. Red line indicates the median. Distances of rules with or without repetitions of the same rule were still not significantly different (p = 0.40, Wilcoxon rank-sum test). Box plots show median, 25th and 75th percentile

References

    1. Rich EL, Shapiro M. Rat prefrontal cortical neurons selectively code strategy switches. J. Neurosci. 2009;29:7208–7219. doi: 10.1523/JNEUROSCI.6068-08.2009. - DOI - PMC - PubMed
    1. Durstewitz D, Vittoz NM, Floresco SB, Seamans JK. Abrupt transitions between prefrontal neural ensemble states accompany behavioral transitions during rule learning. Neuron. 2010;66:438–448. doi: 10.1016/j.neuron.2010.03.029. - DOI - PubMed
    1. Karlsson MP, Tervo DG, Karpova AY. Network resets in medial prefrontal cortex mark the onset of behavioral uncertainty. Science. 2012;338:135–139. doi: 10.1126/science.1226518. - DOI - PubMed
    1. Milner, B. Effects of different brain lesions on card sorting: the role of the frontal lobes. Arch Neurol. 9(1), 90–100 (1963).
    1. Szczepanski SM, Knight RT. Insights into human behavior from lesions to the prefrontal cortex. Neuron. 2014;83:1002–1018. doi: 10.1016/j.neuron.2014.08.011. - DOI - PMC - PubMed

Publication types