. 2018 Jan 22;9(1):324.
doi: 10.1038/s41467-017-02694-8.

Quantitative proteomics identifies redox switches for global translation modulation by mitochondrially produced reactive oxygen species

Affiliations

Quantitative proteomics identifies redox switches for global translation modulation by mitochondrially produced reactive oxygen species

Ulrike Topf et al. Nat Commun. .

Abstract

The generation of reactive oxygen species (ROS) is inevitably linked to life. However, the precise role of ROS in signalling and specific targets is largely unknown. We perform a global proteomic analysis to delineate the yeast redoxome to a depth of more than 4,300 unique cysteine residues in over 2,200 proteins. Mapping of redox-active thiols in proteins exposed to exogenous or endogenous mitochondria-derived oxidative stress reveals ROS-sensitive sites in several components of the translation apparatus. Mitochondria are the major source of cellular ROS. We demonstrate that increased levels of intracellular ROS caused by dysfunctional mitochondria serve as a signal to attenuate global protein synthesis. Hence, we propose a universal mechanism that controls protein synthesis by inducing reversible changes in the translation machinery upon modulating the redox status of proteins involved in translation. This crosstalk between mitochondria and protein synthesis may have an important contribution to pathologies caused by dysfunctional mitochondria.


Conflict of interest statement

The authors declare no competing financial interests.

Figures
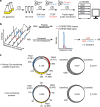
Fig. 1
Fig. 1
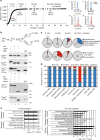
Site-resolved, large-scale analysis of the in vivo oxidation status of the yeast proteome. a Yeast cells grown in 2% galactose medium were immediately frozen in 10% TCA (1). Extracted proteins were denatured in 6 M urea in the presence of heavy ICAT (13C-ICAT) to label free thiol groups (2). Reversibly oxidised cysteine residues were reduced by TCEP and labelled by light ICAT (12C-ICAT) (3). Proteins were digested with trypsin and ICAT-labelled peptides were enriched by streptavidin affinity chromatography (4). Following cleavage of the biotin tag, peptides were analysed in duplicate by LC-MS/MS. b For the determination of the in vivo oxidation status of cysteine residues, peptides were identified based on fragment ions observed in MS2 spectra using MaxQuant (v.1.4.1.2) and then quantified by extracting MS1 ion chromatograms using Skyline (v.2.5.0). Following the integration of peak areas of heavy and light peptide variants, the proportion of reversibly oxidised cysteine residues (% oxidation) was calculated. c Overlap of unique cysteine-containing peptides (top) and proteins (bottom) identified in three biological replicates and the proportion of peptides/proteins quantified in least two of the three biological replicates
Fig. 2
Fig. 2
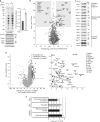
The basal yeast thiol oxidation landscape. a Distribution of the in vivo oxidation status of 4,457 unique cysteine-containing peptides. The dataset was classified into four oxidation groups as indicated. For each group, a representative peptide (red) and the respective extracted ion chromatogram (XIC; right) are shown. XICs display the redox state of (I) Cys157 of the methionine-R-sulfoxide reductase Mxr2, (II) Cys107 of the translational mRNA activator Gis2, (III) Cys166 of the thiol oxidase Ero1 and (IV) Cys147 of the cytosolic superoxide dismutase Sod1. Red line, light peptide peak (oxidised); blue line, heavy peptide peak (reduced). b Top: schematic illustration of the thiol-trapping approach. The reduced cysteine residue of a protein is alkylated by iodoacetamide (IAA). The oxidised cysteine residue is reduced by TCEP and is thus accessible for the thiol-modifying agent AMS or mPEG. Modification results in a shift of 0.5 or 1.2 kDa, respectively, per modified cysteine residue. Bottom: when indicated, proteins of total yeast cell extracts were incubated with 10 mM IAA, 50 mM TCEP and 10 mM AMS or 10 mM mPEG. As a control, one sample was incubated with 100 mM DTT. Proteins were separated by SDS-PAGE followed by immunodecoration with specific antibodies. c Frequency of disulfide bond (top) and zinc binding and/or zinc finger annotations (bottom) within different oxidation groups of cysteine-containing peptides as indicated. Other disulfide forms include transient disulfide bonds and those in linked or nuclear-retained form. d Distribution of proteins of different oxidation groups according to subcellular location. Gene ontology (GO) slim terms for cellular components were retrieved from the Saccharomyces genome database with the number of proteins in parenthesis. Proteins were grouped according to the most oxidised peptide. e GO term enrichment analysis of proteins with peptides in the oxidation range 15–30% (left) and 60–100% (right). For each term, the number of proteins is shown
Fig. 3
Fig. 3
Hydrogen peroxide treatment of wild-type yeast cells. a Carbonylation of proteins in wild-type cells treated with 1 mM H2O2 for 30 min was analysed by immunoblotting with anti-DNP antibody or quantified by spectrophotometry. Mean ± SEM, n = 3, *P-value < 0.05; two-sided, paired t-test DNP(H), 2,4-dinitrophenyl(hydrazine). b Volcano plot showing H2O2-dependent changes in protein abundance. In total, 3,116 unique proteins and 61 protein groups were quantified. Shaded areas highlight proteins with an average fold change of ≥ 2 (average log10 ratio = ± 0.3) and a P-value < 0.05 (−log10P-value > 1.3; n = 3, two-sided t-test). Dark grey, regulated proteins with the GO term ‘response to oxidative stress’ and/or ‘oxidoreductase activity’. c Wild-type cells were grown in fermentative medium at 28 °C and when indicated treated with 1 mM H2O2 for 30 min. Samples were analysed by immunoblotting. *Unspecific band. d Left: volcano plot showing difference in average % oxidation (H2O2-treated minus untreated samples) for 4,341 unique cysteine-containing peptides plotted against −log10P-value highlighting unique cysteine-containing peptides with significantly increased oxidation levels (dark grey, P-value < 0.05, n = 3, ANOVA). Lines indicate difference in average % oxidation > 7 and a P-value of 0.05 (−log10 = 1.3). Right: zoom-in of the region highlighted in the volcano plot. Peptides of proteins annotated with the GO term ‘ribonucleoprotein complex’ are highlighted (dark grey). e GO term enrichment analysis of proteins with significantly increased oxidation levels. P-values after Benjamini–Hochberg FDR (< 0.05) correction were plotted against their corresponding GO terms from the three main domains (cellular component, molecular function and biological process). For each GO term, the number of proteins is shown
Fig. 4
Fig. 4
MIA mutant shows increased levels of ROS. a Wild-type yeast and mia40-4int mutant were grown in respiratory medium at 19 °C and shifted to 37 °C. Samples were collected at the indicated time points and analysed by immunoblotting. b Mitochondria were isolated from wild-type cells and mia40-4int mutant and analysed by Blue Native gel electrophoresis followed by immunoblotting. c Endogenous levels of H2O2 and superoxide of wild-type cells and mia40-4int. Mean ± SEM, n = 3. *P-value < 0.04; **P-value < 0.02; two-sided, paired t-test. d Carbonylation of proteins in wild-type cells and mia40-4int mutant was analysed by immunoblotting with anti-DNP antibody or quantified by spectrophotometry. Mean ± SEM, n = 3. *P-value < 0.05; two-sided, paired t-test. DNPH, 2,4-dinitrophenylhydrazine. e Volcano plot showing difference in average % oxidation (mia40-4int minus wild-type) for 2,099 unique cysteine-containing peptides plotted against the −log10P-value (ANOVA test, n = 4). Cysteine-containing peptides with significantly increased oxidation levels are highlighted in dark grey (% oxidation ≥ 7, P-value < 0.05, n = 4). Lines indicate a difference in average % oxidation of ≥ 7 and a P-value of 0.05 (−log10 = 1.3). WT, wild-type
Fig. 5
Fig. 5
Comparison between H2O2-induced and mia40-4int-dependent changes in thiol oxidation a Left: comparison of difference in average % oxidation values for 1,785 unique cysteine-containing peptides quantified in both datasets. Lines indicate difference in average % oxidation ≥ 7. Right: zoom-in of the region with an average increase in oxidation of at least + 7% in mia40-4int and upon H2O2 treatment. Peptides are labelled with the respective protein names and the position(s) of cysteine residue(s) in the sequence. Unique cysteine-containing peptides that show an increase in thiol oxidation of at least + 7% with a P-value < 0.05 in mia40-4int (n = 4) and/or upon H2O2 treatment (n = 3) are highlighted as indicated. Cysteine-containing peptides highlighted in blue in the zoom-in also exhibited increased thiol oxidation in mia40-4int (≥ 7%) but with P-values > 0.05 (n = 4). b Functional protein association network of proteins which exhibited increased oxidation (≥ 7%) in mia40-4int and in WT yeast upon H2O2 treatment using STRING (version 10.0). Proteins highlighted in red showed a significant increase in thiol oxidation in mia40-4int (P-value < 0.05, n = 4), as well as upon H2O2 treatment (P-value < 0.05, n = 3). Proteins highlighted in blue exhibited a significant increase in thiol oxidation upon H2O2 treatment (≥ 7%, P-value < 0.05, n = 3). Thiol oxidation of these proteins was also increased in mia40-4int (≥ 7%) with P-values > 0.05 (n = 4). c Comparison of the number of proteins annotated with the GO term ‘ribonucleoprotein complex’ with at least one unique cysteine-containing peptide with an increase in thiol oxidation of at least + 7% (P-value < 0.05) upon H2O2 treatment (n = 3) and/or in mia40-4int (n = 4)
Fig. 6
Fig. 6
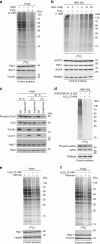
ROS induction reduces protein translation in the cytosol. ae Incorporation of [35S]-labelled amino acids in yeast or mammalian cells. Total cell extracts were separated by SDS-PAGE and analysed by autoradiography or immunodecorated with specific antibodies. a Wild-type (BY4741) yeast cells were grown on fermentative medium and treated for 30 min with H2O2 as indicated. b HEK 293 cells were treated for 2 h with H2O2 as indicated. c Yeast cells were grown on respiratory medium at 19 °C and shifted for 2 h to restrictive temperature (37 °C). Incorporation of [35S]-labelled amino acids in wild-type yeast and mia40-4int mutant was done for 1 h before collection of cells. de Wild-type (BY4741) yeast cells and cells with deletions of ribosomal genes (encoding for proteins that according to the proteomics data were significantly more oxidised in mia40-4int and upon H2O2 treatment (d) or significantly more oxidised upon H2O2 treatment only (e)) were grown on fermentative medium and treated for 30 min with H2O2 (upper panel). Quantification of protein synthesis. Mean ± SEM, n = 3 (lower panel). WT, wild-type
Fig. 7
Fig. 7
Translation initiation block is not responsible for inhibitory effect of ROS. abdf Incorporation of [35S]-labelled amino acids in yeast or mammalian cells. Total cell extracts were separated by SDS-PAGE and analysed by autoradiography or immunodecorated with specific antibodies. a Wild-type (BY4741) yeast cells were grown on fermentative medium supplemented with 100 mM N-acetylcysteine (NAC) for 4 h. During the last 30 min of culturing, H2O2 was added. b HEK 293 cells were treated for 2 h with H2O2 in the presence of NAC as indicated. c Yeast cells were grown on respiratory medium at 19 °C and shifted for 2 or 3 h to restrictive temperature (37 °C). Samples were analysed by immunoblotting using specific antibodies. d HEK 293 cells were treated for 3 h with the PERK kinase inhibitor GSK2606414. H2O2 was added after 1 h of treatment with GSK2606414. e Wild-type (YPH499) yeast cells were treated for 3 h with 25 µM MG132. H2O2 was added 30 min prior harvesting of cells. f Wild-type (YPH499) yeast cells were treated with H2O2 for 30 min. Cells were washed and further incubated for 1 h. Incorporation of [35S]-labelled amino acids was done at the same time as treatment with H2O2 or for 1 h starting after washing. WT, wild-type

References

    1. Miseta A, Csutora P. Relationship between the occurrence of cysteine in proteins and the complexity of organisms. Mol. Biol. Evol. 2000;17:1232–1239. doi: 10.1093/oxfordjournals.molbev.a026406. - DOI - PubMed
    1. Cremers CM, Jakob U. Oxidant sensing by reversible disulfide bond formation. J. Biol. Chem. 2013;288:26489–26496. doi: 10.1074/jbc.R113.462929. - DOI - PMC - PubMed
    1. Deponte M, Lillig CH. Enzymatic control of cysteinyl thiol switches in proteins. Biol. Chem. 2015;396:401–413. doi: 10.1515/hsz-2014-0280. - DOI - PubMed
    1. Yang J, Carroll KS, Liebler DC. The expanding landscape of the thiol redox proteome. Mol. Cell. Proteom. 2016;15:1–11. doi: 10.1074/mcp.O115.056051. - DOI - PMC - PubMed
    1. Leichert LI, et al. Quantifying changes in the thiol redox proteome upon oxidative stress in vivo. Proc. Natl Acad. Sci. USA. 2008;105:8197–8202. doi: 10.1073/pnas.0707723105. - DOI - PMC - PubMed

Publication types