. 2018 Jan 22;9(1):306.
doi: 10.1038/s41467-017-02719-2.

Pharmacogenetic stimulation of neuronal activity increases myelination in an axon-specific manner

Affiliations

Pharmacogenetic stimulation of neuronal activity increases myelination in an axon-specific manner

Stanislaw Mitew et al. Nat Commun. .

Abstract

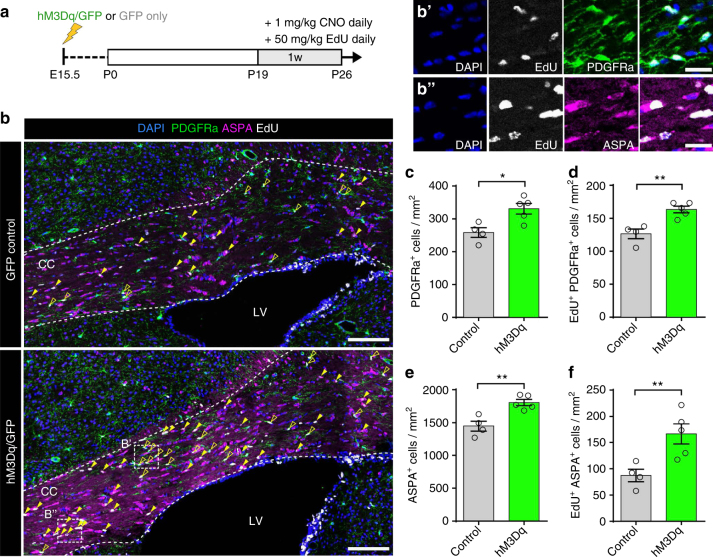
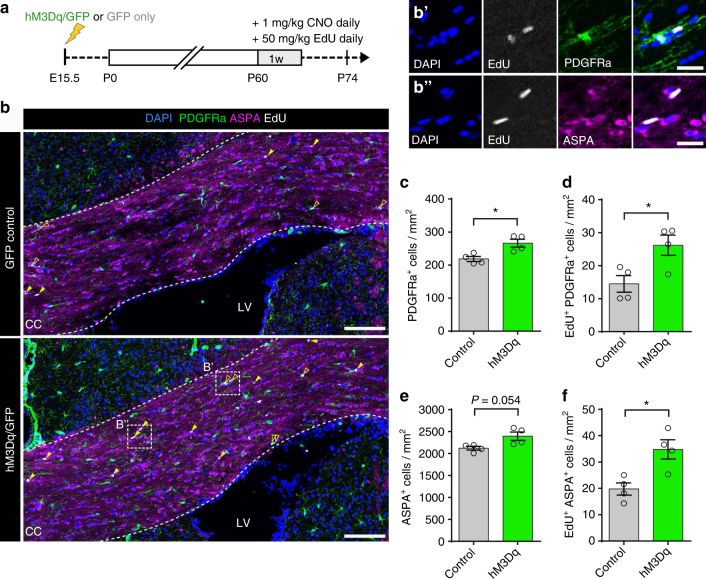
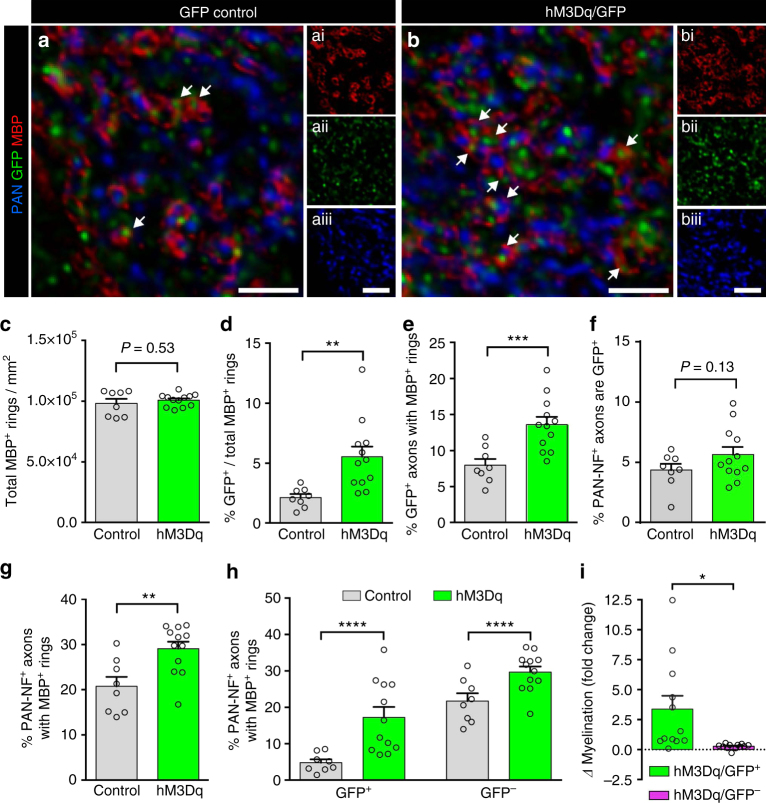
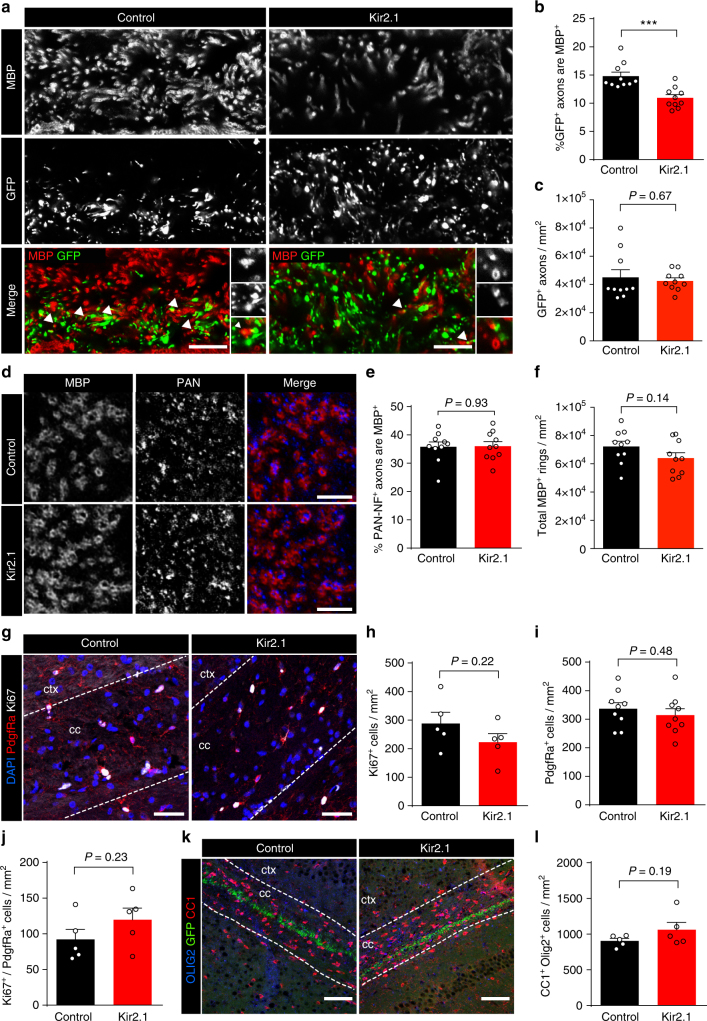
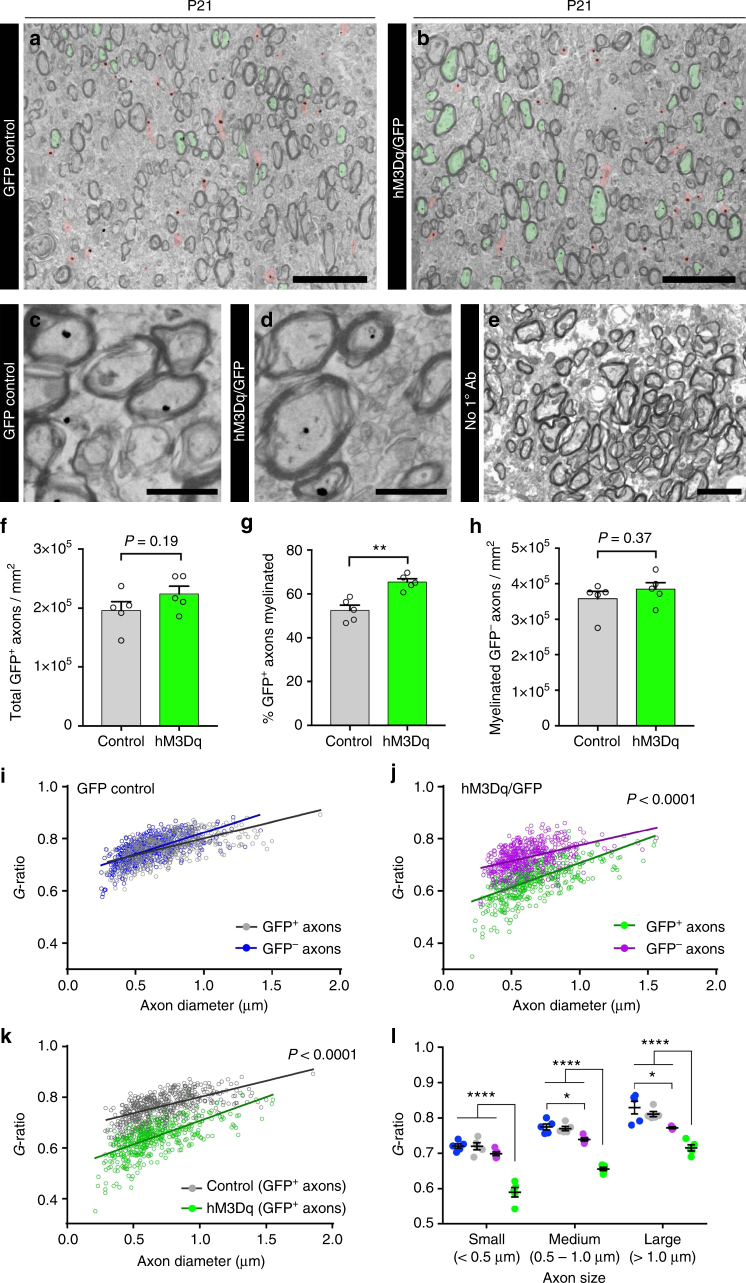
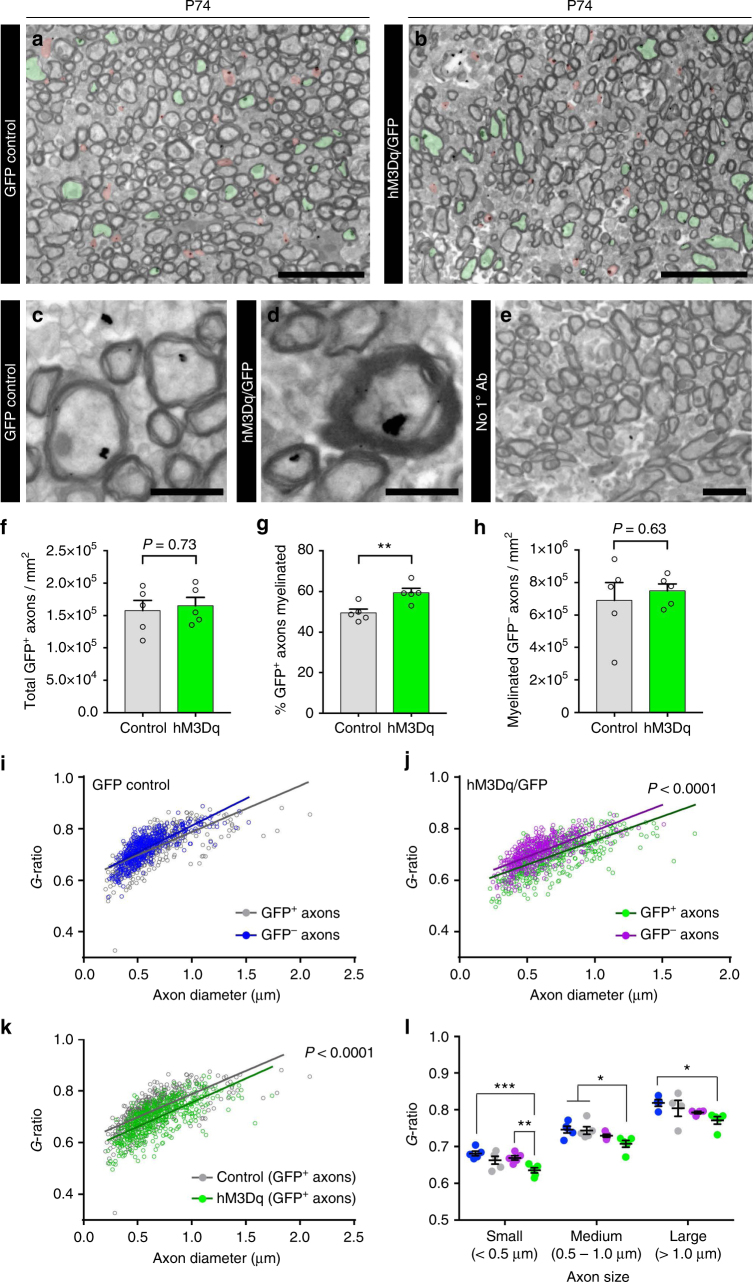
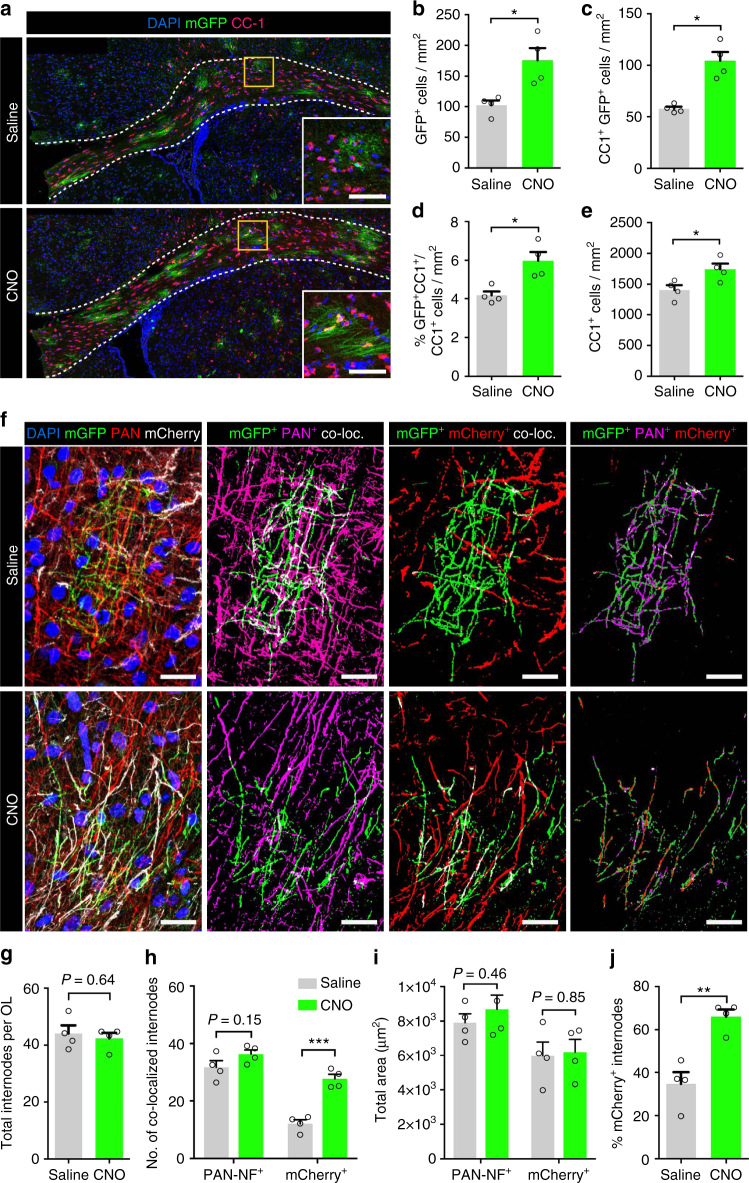
Mounting evidence suggests that neuronal activity influences myelination, potentially allowing for experience-driven modulation of neural circuitry. The degree to which neuronal activity is capable of regulating myelination at the individual axon level is unclear. Here we demonstrate that stimulation of somatosensory axons in the mouse brain increases proliferation and differentiation of oligodendrocyte progenitor cells (OPCs) within the underlying white matter. Stimulated axons display an increased probability of being myelinated compared to neighboring non-stimulated axons, in addition to being ensheathed with thicker myelin. Conversely, attenuating neuronal firing reduces axonal myelination in a selective activity-dependent manner. Our findings reveal that the process of selecting axons for myelination is strongly influenced by the relative activity of individual axons within a population. These observed cellular changes are consistent with the emerging concept that adaptive myelination is a key mechanism for the fine-tuning of neuronal circuitry in the mammalian CNS.


Conflict of interest statement

The authors declare no competing financial interests.

Figures

Fig. 1
Fig. 1
DREADD-mediated neuronal stimulation results in increased cFos expression. ac PBCag-GFP (GFP control) or a 1:1 combination of PBCag-GFP and PBCag-hM3Dq (hM3Dq/GFP) were electroporated unilaterally into the right cerebral neuroepithelium of CD1 mice at E15.5 (a), resulting in a highly stereotypical and reproducible expression pattern in layer 2/3 S1 pyramidal neurons (b) and their axonal projections in the corpus callosum at P20 (c). d Structure of the PiggyBac plasmids encoding hM3Dq and Gfp that were used. e Representative images showing cFos expression in the S1 cortex of GFP control (top panel) and hM3Dq/GFP (bottom panel) mice following a week of CNO administration (P19–26). f Plasmid electroporation efficiency was similar between hM3Dq/GFP and GFP control mice. g The normalized absolute intensity of cFos immunostaining was significantly increased in hM3Dq/GFP electroporated neurons compared to that of GFP controls or non-electroporated neurons following a week of CNO-mediated stimulation (AU, arbitrary units). h Graph depicting the percentage change in cFos normalized absolute intensity from the average GFP cell intensity within samples. Welch’s corrected unpaired two-tailed t-test: *P < 0.05, ***P < 0.001; n = 6 mice/group,  ± s.e.m. Scale bars = 500 µm (b), 200 µm (c, e), 10 µm (insets, e). See also Supplementary Fig. 1
Fig. 2
Fig. 2
Activity stimulation enhances oligodendrogenesis in juvenile mice. a Experimental timeline illustrating onset of CNO/EdU administration in juvenile mice that had been electroporated with plasmids containing either hM3Dq and Gfp (hM3Dq) or Gfp only (Control) in utero at E15.5. b Coronal sections through the corpus callosum at P19+7 were immunolabeled with OPC (PDGFRa) and mature oligodendrocyte (ASPA) markers and the number of proliferating (EdU+) OPCs (open arrowheads, b’) and newly differentiated oligodendrocytes (filled arrowheads, b”) was quantified. cf Activity stimulation resulted in increased levels of progenitor cell proliferation (c, d), as well as enhanced differentiation and oligodendrogliogenesis (e, f). Welch’s corrected unpaired two-tailed t-test: **P < 0.01, *P < 0.05; n = 4 Control mice (GFP only), n = 5 hM3Dq/GFP mice, ± s.e.m. Scale bars = 200 µm (b), 20 µm (b’, b”). See also Supplementary Figs. 2, 3
Fig. 3
Fig. 3
Activity stimulation in adult mice results in increased oligodendrogenesis. a Experimental timelime indicating onset of CNO/EdU administration in adult mice that had been electroporated with plasmids containing either hM3Dq and Gfp (hM3Dq) or Gfp only (Control) in utero at E15.5. b Coronal sections through the corpus callosum at P60+14 were immunolabeled with OPC (PDGFRa) and mature oligodendrocyte (ASPA) markers and the number of proliferating (EdU+) OPCs (open arrowheads, b’) and newly differentiated oligodendrocytes (filled arrowheads, b”) was quantified. cf Activity stimulation resulted in increased levels of OPC proliferation and cell cycle entry (c, d), which in turn resulted in increased EdU+ incorporation in adult ASPA+ cells (f), although the difference in overall number of mature oligodendrocytes was not significant between the groups (e). Welch’s corrected unpaired two-tailed t-test: *P < 0.05; n = 4 mice/group,  ± s.e.m. Scale bars = 200 µm (b), 20 µm (b’, b”). See also Supplementary Fig. 4
Fig. 4
Fig. 4
Activity stimulation results in increased myelination in an axon-selective manner. a, b Representative examples of GFP control (a) or hM3Dq/GFP (b) mouse callosal axons labeled with PAN-NF (blue), GFP (green), and MBP (red), with white arrows indicating myelinated GFP+ axons. c, d Although the total number of MBP+ rings in the corpus callosum was similar (c), the proportion of myelin rings with GFP+ axons was significantly higher in the hM3Dq-expressing mice compared to controls (d). e The percentage of GFP+ axons that colocalized with MBP+ rings was significantly higher in hM3Dq/GFP mice compared to GFP controls. f An equivalent percentage of PAN-NF+ axons co-expressed GFP in the hM3Dq/GFP and GFP control groups. g The percentage of PAN-NF+ axons that colocalized with MBP+ rings was higher in hM3Dq/GFP mice compared to GFP controls. h The percentage of GFP+ and GFP PAN-NF+ axons that were colocalized with MBP+ rings in each group. i The overall change in myelination in hM3Dq/GFP mice was much more pronounced in GFP+ axons compared to GFP axons (values computed as fold change from mean density of GFP+/− PAN-NF+ MBP+ axons in GFP control mice). Welch’s corrected unpaired two-tailed t-test: ****P < 0.0001, ***P < 0.001, **P < 0.01, *P < 0.05; n = 8 Control mice (GFP only), n = 12 hM3Dq/GFP mice,  ± s.e.m. Scale bars = 2 µm (a, b)
Fig. 5
Fig. 5
Inhibiting axonal activity during early development decreases myelination in an axon-selective manner. a Representative images of sagittal sections of the corpus callosum at the midline of P20 mice that had been electroporated with plasmids containing either Kcnj2 and Gfp (Kir2.1) or Gfp only (Control) in utero at E15.5. White arrowheads indicate MBP+/GFP+ axons. b, c GFP+ axons in the Kir2.1-expressing mice displayed reduced myelination compared to GFP only electroporated controls (b), though the density of electroporated axons was comparable in both conditions (c). d Representative images showing MBP+/PAN-NF+ axons in the corpus callosum. e, f There was no difference in either the percentage of myelinated PAN-NF+ axons (e) or the density of MBP+ rings (f) between Kir2.1 mice and controls. g Representative images of the corpus callosum immunolabeled with OPC marker PdgfRa (red) and proliferation marker Ki67 (white). hj There was no change in the density of proliferating cells (h), the total number of OPCs (i) or the density of proliferating OPCs (j) between Kir2.1 mice and controls. k Representative images of the corpus callosum immunolabeled with oligodendrocyte lineage marker OLIG2 (blue), mature oligodendrocyte marker CC1 (red), and GFP (green). l There was no significant difference in the density of mature oligodendrocytes between Kir2.1 and control mice. Welch’s corrected unpaired two-tailed t-test: ***P < 0.001; n = 10 mice/group (af), n = 5 mice/group (gl),  ± s.e.m. Scale bars = 5 µm (a, d), 200 µm (g, k)
Fig. 6
Fig. 6
Stimulation of neuronal activity in juvenile mice promotes myelination and results in thicker myelin sheaths. a, b Representative immunogold electron microscopic images of the corpus callosum of GFP control (a) and hM3Dq/GFP (b) mice at P21, following a week of CNO administration (P14–20). Myelinated and unmyelinated GFP+ axons are pseudo-colored green and red, respectively. c, d Higher magnification of immunogold-positive axons from GFP control (c) and hM3Dq/GFP (d) mice. e No primary antibody control sections had almost no gold deposits. f Analysis of the density of GFP+ axons in each condition. g Quantification of the percentage of GFP+ axons myelinated in each condition; hM3Dq/GFP mice displayed a significant increase in the percentage of GFP+ axons that were myelinated compared to GFP only control mice (Welch’s corrected unpaired two-tailed t-test: **P < 0.01, n = 5 mice/condition). h Quantification of the density of myelinated GFP axons in each condition. i, j Analysis of myelin thickness (g-ratios) for GFP+ and GFP axons in GFP control (i) and hM3Dq/GFP (j) mice. k Comparison of the g-ratios of the GFP+ population in GFP control and hM3Dq/GFP mice. l Breakdown of g-ratios for each group by axonal size. Colors of conditions matched for ik. Two-way ANOVA with Tukey’s multiple comparisons test: *P < 0.05, ****P < 0.0001, n = 5 mice/condition,  ± s.e.m. Scale bars = 5 µm (a, b), 1 µm (c, d), 2.5 µm (e). See also Supplementary Fig. 5
Fig. 7
Fig. 7
Stimulation of neuronal activity in adult mice promotes myelination and results in thicker myelin sheaths. a, b Representative immunogold electron microscopic images of the corpus callosum of GFP control (a) and hM3Dq/GFP (b) mice at P74, following a week of CNO administration (P60–66). Myelinated and unmyelinated GFP+ axons are pseudo-colored green and red, respectively. c, d Higher magnification of immunogold-positive axons from GFP control (c) and hM3Dq/GFP (d) mice. e No primary antibody control sections showed almost no gold deposits. f Analysis of the density of GFP+ axons in each condition. g Quantification of the percentage of GFP+ axons myelinated in each condition; hM3Dq/GFP mice displayed a significant increase in the percentage of GFP+ axons myelinated relative to GFP only control mice (Welch’s corrected unpaired two-tailed t-test: **P < 0.01, n = 5 mice/condition). h Quantification of the density of myelinated GFP axons in each condition. i, j Analysis of myelin thickness (g-ratios) for GFP+ and GFP axons in GFP control (i) and hM3Dq/GFP (j) mice. k Comparison of the g-ratios of the GFP+ population in GFP control and hM3Dq/GFP mice. l Breakdown of g-ratios for each group by axonal size. Colors of conditions matched for ik. Two-way ANOVA with Tukey’s multiple comparisons test: *P < 0.05, **P < 0.01, ***P < 0.001; n = 5 mice/condition,  ± s.e.m. Scale bars = 5 µm (a, b), 1 µm (c, d), 2.5 µm (e). See also Supplementary Fig. 5
Fig. 8
Fig. 8
Newly generated oligodendrocytes preferentially target axons with higher levels of activity. a Representative images of the corpus callosum of PdgfRα-CreERT2: Tau-mGFP mice that had undergone 1 week of treatment with either CNO or saline. Coronal sections were immunolabeled with mature oligodendrocyte marker CC1 (magenta) and GFP (green); insets show a higher number of doubly labeled GFP+/CC1+ cells in CNO-treated mice (bottom inset) compared to saline controls (top inset). b, c Quantification of the density of GFP+ cells (b) and the density of CC1+/GFP+ cells (c) in the corpus callosum of CNO- or saline-treated mice. d, e Quantification of the percentage of all CC1+ cells that were GFP+ (d) and the total density of CC1+ cells (e) in stimulated and non-stimulated mice. f Representative images of newly differentiated cortical oligodendrocytes, demonstrating colocalization with PAN-NF+ or mCherry+ axons. g Analysis of the total number of internodes per oligodendrocyte. h Quantification of the number of internodes that were ensheathing PAN-NF+ or mCherry+ axons in each condition. i The total cortical area occupied by either PAN-NF+ or mCherry+ processes was similar in both CNO- and saline-treated mice. j The percentage of all internodes per oligodendrocytes that ensheathed mCherry+ axons was higher in CNO-treated mice compared to saline controls. Welch’s corrected unpaired two-tailed t-test: ***P < 0.001, **P < 0.01, *P < 0.05; n = 4 mice/condition, ± s.e.m. Scale bars = 200 µm (a), 40 µm (insets), 20 µm (f)

References

    1. Bercury KK, Macklin WB. Dynamics and mechanisms of CNS myelination. Dev. Cell. 2015;32:447–458. doi: 10.1016/j.devcel.2015.01.016. - DOI - PMC - PubMed
    1. Mitew S, et al. Mechanisms regulating the development of oligodendrocytes and central nervous system myelin. Neuroscience. 2014;276:29–47. doi: 10.1016/j.neuroscience.2013.11.029. - DOI - PubMed
    1. Lee S, et al. A culture system to study oligodendrocyte myelination processes using engineered nanofibers. Nat. Methods. 2012;9:917–922. doi: 10.1038/nmeth.2105. - DOI - PMC - PubMed
    1. Bechler ME, Byrne L, Ffrench-Constant C. CNS myelin sheath lengths are an intrinsic property of oligodendrocytes. Curr. Biol. 2015;25:2411–2416. doi: 10.1016/j.cub.2015.07.056. - DOI - PMC - PubMed
    1. Moore CL, Kalil R, Richards W. Development of myelination in optic tract of the cat. J. Comp. Neurol. 1976;165:125–136. doi: 10.1002/cne.901650202. - DOI - PubMed

Publication types