. 2018 Jan 8:8:1914.
doi: 10.3389/fimmu.2017.01914. eCollection 2017.

Feeding Immunity: Physiological and Behavioral Responses to Infection and Resource Limitation

Affiliations

Feeding Immunity: Physiological and Behavioral Responses to Infection and Resource Limitation

Sarah A Budischak et al. Front Immunol. .

Abstract

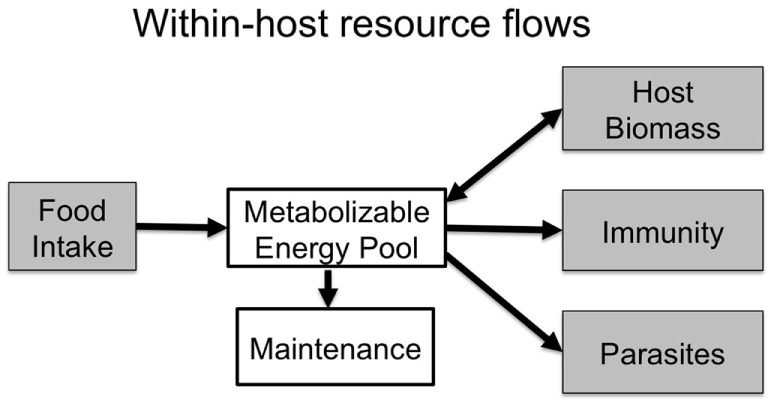
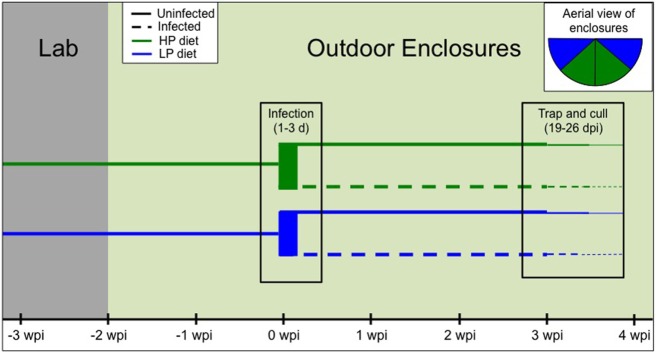
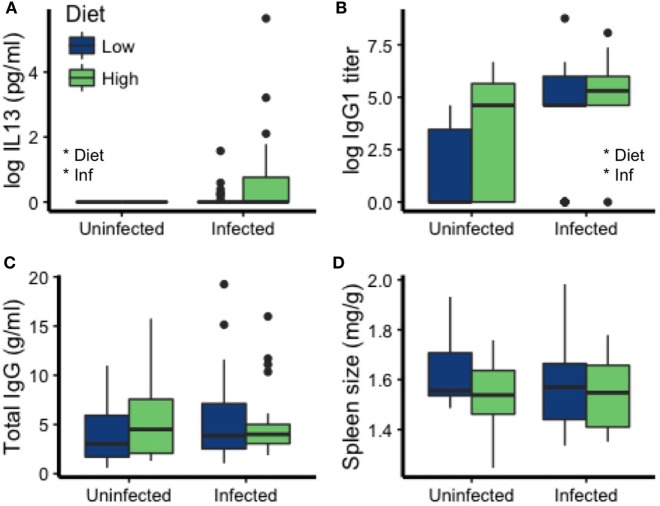
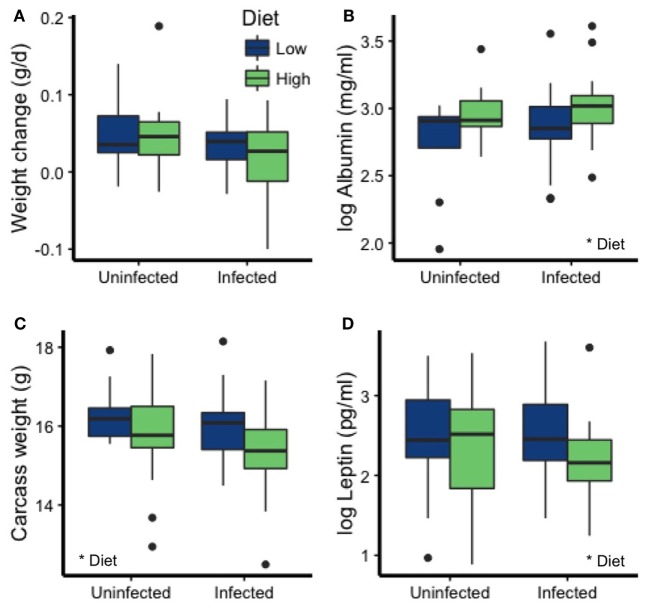
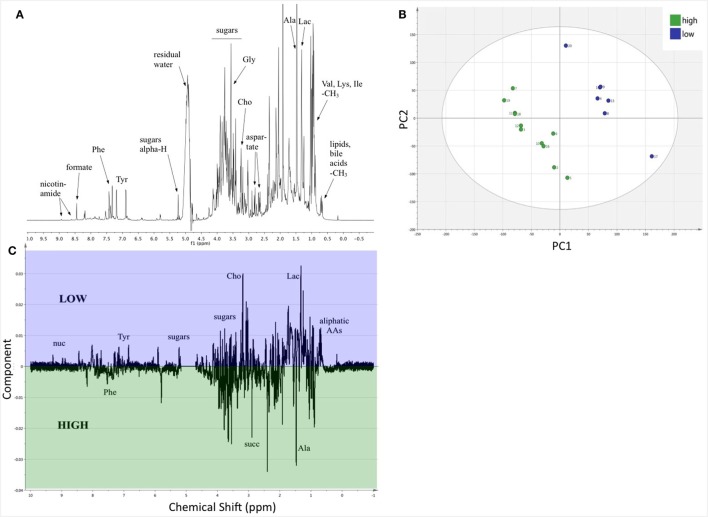
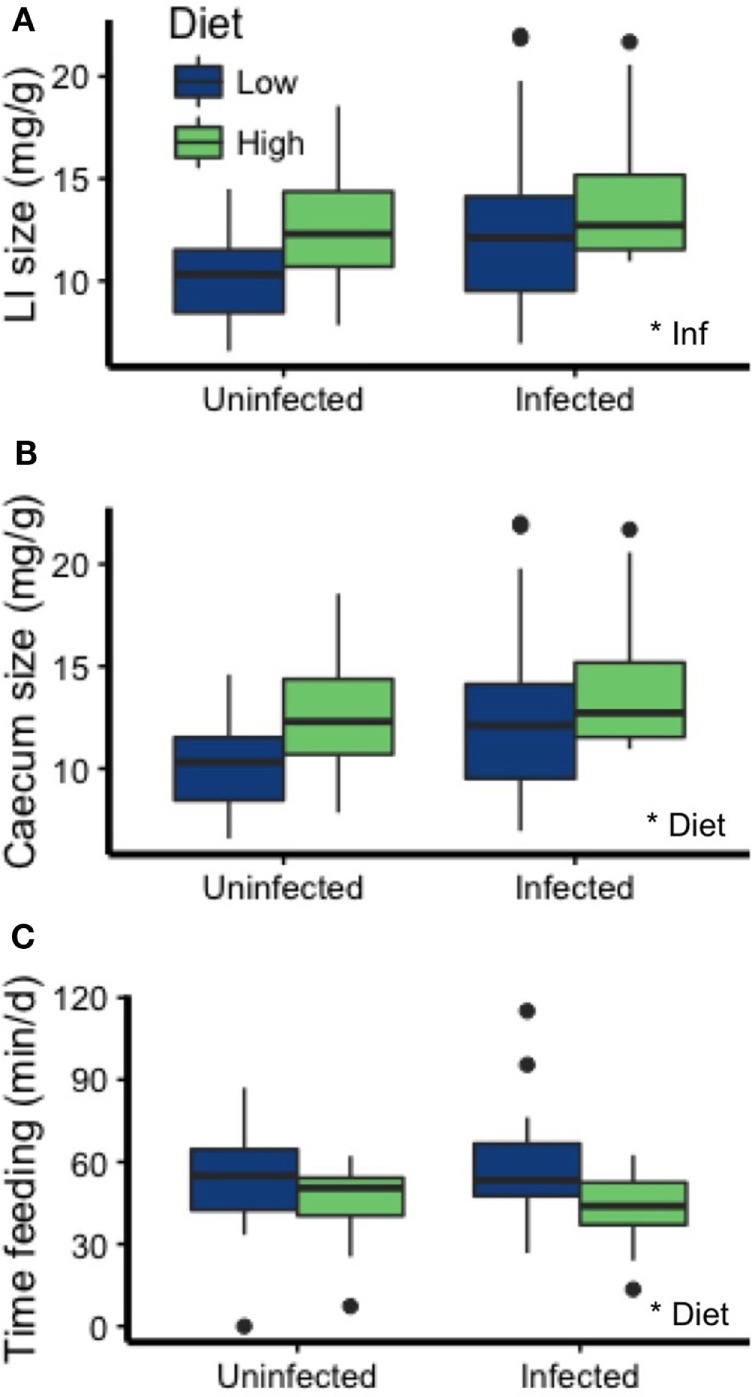
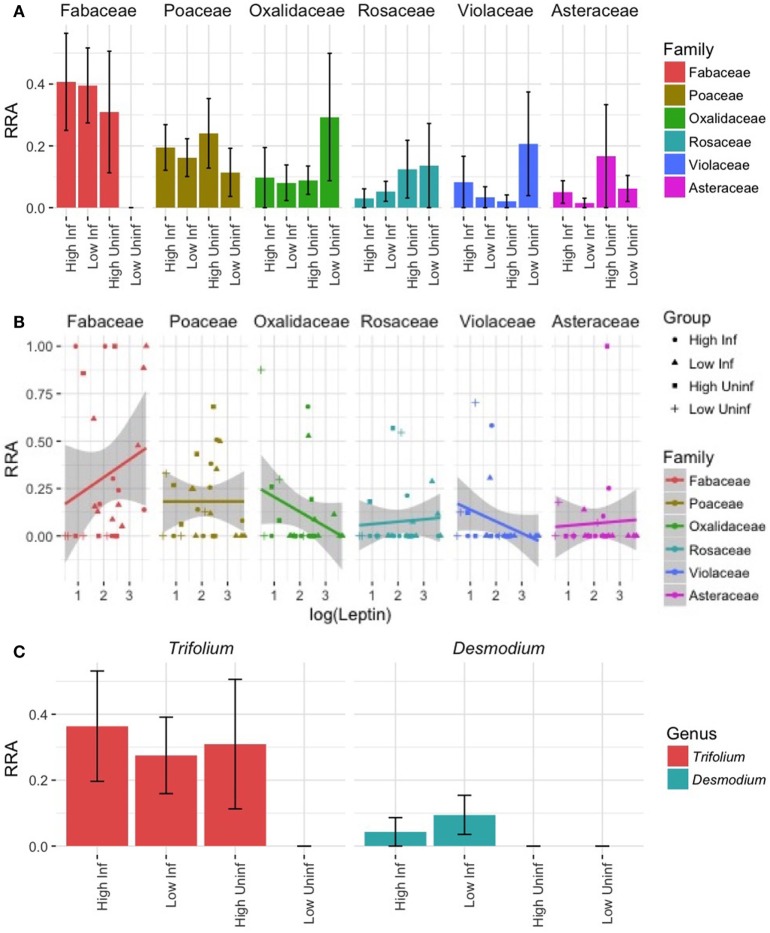
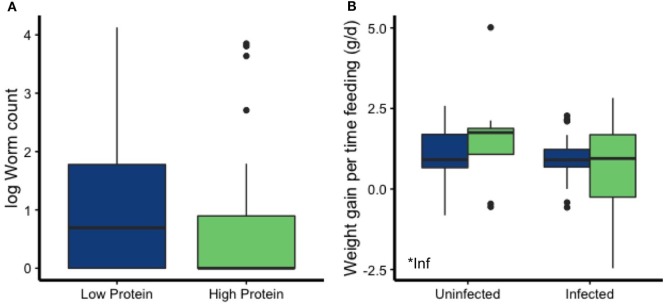
Resources are a core currency of species interactions and ecology in general (e.g., think of food webs or competition). Within parasite-infected hosts, resources are divided among the competing demands of host immunity and growth as well as parasite reproduction and growth. Effects of resources on immune responses are increasingly understood at the cellular level (e.g., metabolic predictors of effector function), but there has been limited consideration of how these effects scale up to affect individual energetic regimes (e.g., allocation trade-offs), susceptibility to infection, and feeding behavior (e.g., responses to local resource quality and quantity). We experimentally rewilded laboratory mice (strain C57BL/6) in semi-natural enclosures to investigate the effects of dietary protein and gastrointestinal nematode (Trichuris muris) infection on individual-level immunity, activity, and behavior. The scale and realism of this field experiment, as well as the multiple physiological assays developed for laboratory mice, enabled us to detect costs, trade-offs, and potential compensatory mechanisms that mice employ to battle infection under different resource conditions. We found that mice on a low-protein diet spent more time feeding, which led to higher body fat stores (i.e., concentration of a satiety hormone, leptin) and altered metabolite profiles, but which did not fully compensate for the effects of poor nutrition on albumin or immune defenses. Specifically, immune defenses measured as interleukin 13 (IL13) (a primary cytokine coordinating defense against T. muris) and as T. muris-specific IgG1 titers were lower in mice on the low-protein diet. However, these reduced defenses did not result in higher worm counts in mice with poorer diets. The lab mice, living outside for the first time in thousands of generations, also consumed at least 26 wild plant species occurring in the enclosures, and DNA metabarcoding revealed that the consumption of different wild foods may be associated with differences in leptin concentrations. When individual foraging behavior was accounted for, worm infection significantly reduced rates of host weight gain. Housing laboratory mice in outdoor enclosures provided new insights into the resource costs of immune defense to helminth infection and how hosts modify their behavior to compensate for those costs.

Keywords: DNA metabarcoding; Trichuris muris; compensatory feeding; nuclear magnetic resonance spectroscopy metabolite profiling; resource–immune trade-offs; rewilding mice.


Figures

Figure 1
Figure 1
Within an infected host, resources are metabolized and allocated to baseline maintenance costs. Remaining resources are put toward immunity and host biomass, or are captured by parasites to use for their own growth and reproduction. Resources, therefore, must trade-off between these competing demands unless hosts are able to increase the quality or quantity of food intake to compensate for those costs.
Figure 2
Figure 2
Timeline of the experimental design. First, mice were randomly assigned to diet treatment and cohort [−3 weeks postinfection (wpi)]. Diets were provided to the second cohort 2 days later, but since both groups subsequently followed the same timeline, only one cohort is depicted for clarity. After 10 days in the lab (−2 wpi), all mice were moved to four outdoor enclosures (n = 22/enclosure). After 2 weeks, 16 mice per enclosure were trapped and infected with 200 T. muris eggs over the course of 1–3 days. Final trapping and culling occurred around 3–4 wpi (19–26 days postinfection). Inset shows an aerial view of the enclosures by diet treatment, and infected and uninfected mice were cohoused.
Figure 3
Figure 3
Diet and infection status affected some mediators of immunity to T. muris but not others. Specifically, (A) interleukin 13 (IL13) and (B) immunoglobulin G1 (IgG1) were affected by diet and infection, but not (C) total IgG concentration or (D) spleen size (weight/carcass weight). Asterisks denote significant effects of diet or infection (Inf).
Figure 4
Figure 4
Diet, but not infection status, affected most measures of condition. (A) Weight change over the course of the experiment (corrected for no. of days in the enclosure) was not affected by diet or T. muris infection. However, the LP diet led to reduced (B) albumin concentration and increased (C) carcass weight and (D) leptin levels. Asterisks denote significant effects of diet.
Figure 5
Figure 5
The relative composition of fecal metabolites differed between the two diets. (A) A representative 1H-NMR spectrum, the average of the 18 samples, with identification of selected metabolites. (B) PLS-DA scores plot (UV scaling); the subgroups of mice on HP and LP diets are clearly separated into distinct clusters. For three components R2Y(cum) = 0.993 and Q2(cum) = 0.533, showing decent validity of the statistics. The ellipse denotes Hotelling’s T2. (C) Loading data along the NMR spectrum (Pareto scaling) reveals that there are a great number of metabolites, which are present in distinct quantity in the separated clusters of samples. All the negative intensities belong to peaks of metabolites, which are present in greater quantity in the cohort on HP diet (green), while the positive intensities depict metabolites in larger concentration in the LP diet group (blue), respectively. Some tentative assignments are shown on the plot. Abbreviations: AAs, amino acids; Ala, alanine; Cho, aldehydes; Gly, glycine; Ile, isoleucine; Lac, lactones; Lys, lysine; nuc, nucleic acids; Phe, phenylalanine; Tyr, tyrosine; succ, succinate; Val, valine.
Figure 6
Figure 6
Mouse physiology and feeding behavior were affected by infection and diet. (A) Infection was associated with a heavier large intestine size (emptied of contents, relative to carcass weight), whereas (B) the HP diet was associated with a heavier cecum relative to carcass weight. (C) Mice on the LP diet spent more time feeding than mice on the HP diet. Asterisks denote significant effects of diet or infection (Inf).
Figure 7
Figure 7
Dietary DNA metabarcoding revealing the diversity of wild plants eaten by lab mice. (A) The mean (±SE) relative read abundances (RRA) of plants representing the top-6 most heavily utilized families of wild plants reveal considerable dietary variation within and among treatment groups. Families are ordered according to decreasing total RRA across all samples. (B) The correlations between leptin, a measure of body fat, and the RRA of plant families in each sample suggest differing relationships, but none reached significance (all p > 0.05). (C) Within the family exhibiting the highest overall RRA (Fabaceae), an OTU-representing Trifolium (clover) was common in all but the LP-uninfected treatment and an OTU-representing Desmodium (beggar’s lice) was eaten only by infected mice.
Figure 8
Figure 8
Despite there being no differences in worm counts by diet, infected mice gained less body weight than uninfected mice when corrected for time spent feeding. (A) Among infected mice, worm counts did not differ by diet. (B) Infection status affected weight gain for the amount of time individual mice spent feeding.

References

    1. Fittkau EJ, Klinge H. On biomass and trophic structure of the Central Amazonian rain forest ecosystem. Biotropica (1973) 5:2–14.10.2307/2989676 - DOI
    1. McNaughton SJ. Ecology of a grazing ecosystem: the Serengeti. Ecol Monogr (1985) 55:260–94.10.2307/1942578 - DOI
    1. Lindeman RL. The trophic-dynamic aspect of ecology. Ecology (1942) 23:399–417.10.2307/1930126 - DOI
    1. Thompson RM, Brose U, Dunne JA, Hall RO, Hladyz S, Kitching RL, et al. Food webs: reconciling the structure and function of biodiversity. Trends Ecol Evol (2012) 27:689–97.10.1016/j.tree.2012.08.005 - DOI - PubMed
    1. Cressler CE, Nelson WA, Day T, McCauley E. Disentangling the interaction among host resources, the immune system and pathogens. Ecol Lett (2014) 17:284–93.10.1111/ele.12229 - DOI - PMC - PubMed

LinkOut - more resources