

Quantization of collagen organization in the stroma with a new order coefficient
- PMID: 29359095
- PMCID: PMC5772573
- DOI: 10.1364/BOE.9.000173
Quantization of collagen organization in the stroma with a new order coefficient
Abstract
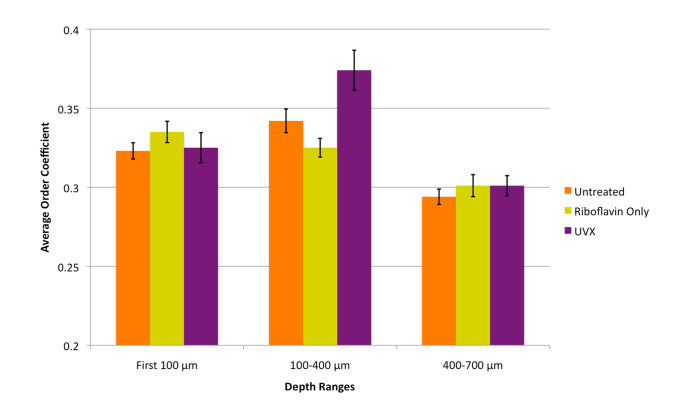
Many optical and biomechanical properties of the cornea, specifically the transparency of the stroma and its stiffness, can be traced to the degree of order and direction of the constituent collagen fibers. To measure the degree of order inside the cornea, a new metric, the order coefficient, was introduced to quantify the organization of the collagen fibers from images of the stroma produced with a custom-developed second harmonic generation microscope. The order coefficient method gave a quantitative assessment of the differences in stromal collagen arrangement across the cornea depths and between untreated stroma and cross-linked stroma.
Keywords: (100.2960) Image analysis; (170.3880) Medical and biological imaging; (170.6900) Three-dimensional microscopy; (170.6935) Tissue characterization; (180.4315) Nonlinear microscopy.
Conflict of interest statement
The authors declare that there are no conflicts of interest related to this article.
Figures


Similar articles
-
Corneal Collagen Ordering After In Vivo Rose Bengal and Riboflavin Cross-Linking.Invest Ophthalmol Vis Sci. 2020 Mar 9;61(3):28. doi: 10.1167/iovs.61.3.28. Invest Ophthalmol Vis Sci. 2020. PMID: 32186674 Free PMC article.
-
Stromal Collagen Arrangement Correlates with Stiffness of the Canine Cornea.Bioengineering (Basel). 2019 Dec 25;7(1):4. doi: 10.3390/bioengineering7010004. Bioengineering (Basel). 2019. PMID: 31881719 Free PMC article.
-
Fast Fourier transform-based analysis of second-harmonic generation image in keratoconic cornea.Invest Ophthalmol Vis Sci. 2012 Jun 14;53(7):3501-7. doi: 10.1167/iovs.10-6697. Invest Ophthalmol Vis Sci. 2012. PMID: 22570347
-
Evolution of the vertebrate corneal stroma.Prog Retin Eye Res. 2018 May;64:65-76. doi: 10.1016/j.preteyeres.2018.01.002. Epub 2018 Feb 2. Prog Retin Eye Res. 2018. PMID: 29398348 Review.
-
Corneal and scleral collagens--a microscopist's perspective.Micron. 2001 Apr;32(3):261-72. doi: 10.1016/s0968-4328(00)00041-x. Micron. 2001. PMID: 11006506 Review.
Cited by
-
Corneal Collagen Ordering After In Vivo Rose Bengal and Riboflavin Cross-Linking.Invest Ophthalmol Vis Sci. 2020 Mar 9;61(3):28. doi: 10.1167/iovs.61.3.28. Invest Ophthalmol Vis Sci. 2020. PMID: 32186674 Free PMC article.
-
Quantitative Discrimination of Healthy and Diseased Corneas With Second Harmonic Generation Microscopy.Transl Vis Sci Technol. 2019 Jun 27;8(3):51. doi: 10.1167/tvst.8.3.51. eCollection 2019 May. Transl Vis Sci Technol. 2019. PMID: 31293806 Free PMC article.
-
Quantitative Analysis of the Corneal Collagen Distribution after In Vivo Cross-Linking with Second Harmonic Microscopy.Biomed Res Int. 2019 Jan 10;2019:3860498. doi: 10.1155/2019/3860498. eCollection 2019. Biomed Res Int. 2019. PMID: 30756083 Free PMC article.
-
Three-dimensional collagen fiber mapping and tractography of human uterine tissue using OCT.Biomed Opt Express. 2020 Sep 11;11(10):5518-5541. doi: 10.1364/BOE.397041. eCollection 2020 Oct 1. Biomed Opt Express. 2020. PMID: 33149968 Free PMC article.
-
A review of the epithelial and stromal effects of corneal collagen crosslinking.Ocul Surf. 2023 Oct;30:150-159. doi: 10.1016/j.jtos.2023.09.003. Epub 2023 Sep 6. Ocul Surf. 2023. PMID: 37683969 Free PMC article. Review.
References
-
- Komai Y., Ushiki T., “The three-dimensional organization of collagen fibrils in the human cornea and sclera,” Invest. Ophthalmol. Vis. Sci. 32(8), 2244–2258 (1991). - PubMed
-
- Abahussin M., Hayes S., Knox Cartwright N. E., Kamma-Lorger C. S., Khan Y., Marshall J., Meek K. M., “3D collagen orientation study of the human cornea using X-ray diffraction and femtosecond laser technology,” Invest. Ophthalmol. Vis. Sci. 50(11), 5159–5164 (2009). - PubMed
-
- Caporossi A., Mazzotta C., Baiocchi S., Caporossi T., “Long-term results of riboflavin ultraviolet a corneal collagen cross-linking for keratoconus in Italy: the Siena eye cross study,” Am. J. Ophthalmol. 149(4), 585–593 (2010). - PubMed
LinkOut - more resources
Full Text Sources
Other Literature Sources