. 2017 Dec 20;9(1):322-334.
doi: 10.1364/BOE.9.000322. eCollection 2018 Jan 1.

Compact, multi-exposure speckle contrast optical spectroscopy (SCOS) device for measuring deep tissue blood flow

Affiliations

Compact, multi-exposure speckle contrast optical spectroscopy (SCOS) device for measuring deep tissue blood flow

Tanja Dragojević et al. Biomed Opt Express. .

Abstract

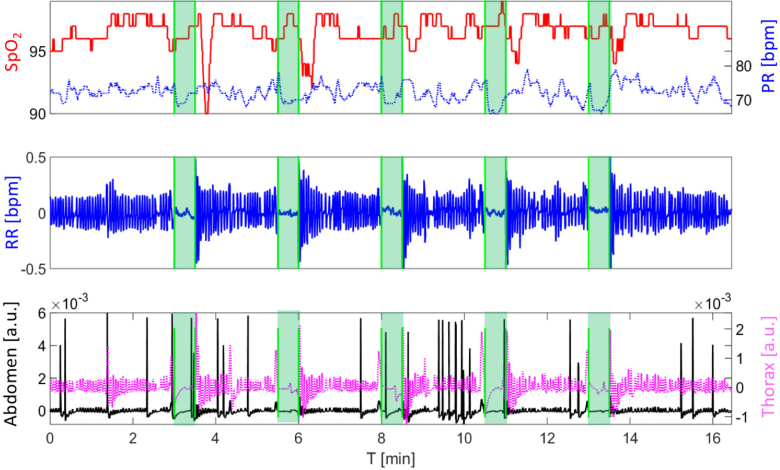
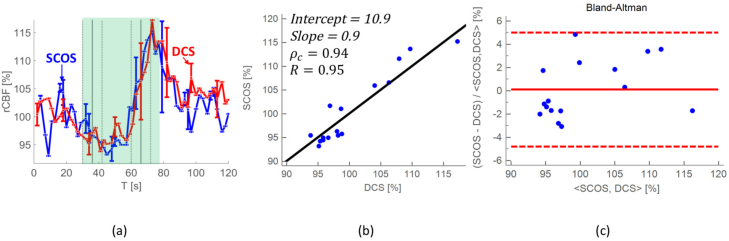
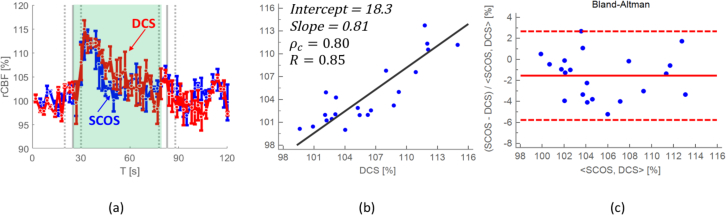
Speckle contrast optical spectroscopy (SCOS) measures absolute blood flow in deep tissue, by taking advantage of multi-distance (previously reported in the literature) or multi-exposure (reported here) approach. This method promises to use inexpensive detectors to obtain good signal-to-noise ratio, but it has not yet been implemented in a suitable manner for a mass production. Here we present a new, compact, low power consumption, 32 by 2 single photon avalanche diode (SPAD) array that has no readout noise, low dead time and has high sensitivity in low light conditions, such as in vivo measurements. To demonstrate the capability to measure blood flow in deep tissue, healthy volunteers were measured, showing no significant differences from the diffuse correlation spectroscopy. In the future, this array can be miniaturized to a low-cost, robust, battery operated wireless device paving the way for measuring blood flow in a wide-range of applications from sport injury recovery and training to, on-field concussion detection to wearables.

Keywords: (170.0170) Medical optics and biotechnology; (170.1470) Blood or tissue constituent monitoring; (170.3890) Medical optics instrumentation; (300.6480) Spectroscopy, speckle.


Conflict of interest statement

ICFO has equity ownership in the spin-off company HemoPhotonics S.L. that commercializes DCS technology. Potential financial conflicts of interest and objectivity of research have been monitored by ICFO’s Knowledge & Technology Transfer Department. No financial conflicts of interest were identified or declared by the authors.

Figures

Fig. 1
Fig. 1
Detection block diagram. The detection board hosts the 32 by 2 SPAD array and two FPGAs, able to compute the speckle contrast. The platform board handles the serial interfaces and transfers data to the PC by means of USB 2.0 controller.
Fig. 2
Fig. 2
Simplified block diagram of the logic implemented into both FPGA devices. Each FPGA receives the 32 pixel outputs (16 by 2 pixels, half of the array) and employs 18 bit counters to measure the light intensity. The exposure time generator gates the counters to perform the measurement during proper exposure times. The pre-processing logic block computes a partial result of the mean intensity and the variance of the measured light, optimizing resources and processing time. Then a processor unit computes the speckle contrast and transfers the result to the PC through the SPI interface.
Fig. 3
Fig. 3
SCOS/DCS probe geometry (a), with laser source fiber (785 nm) placed at 2 cm distance from SPAD array and DCS detector. For the arm cuff occlusion (b) SCOS/DCS probe was placed on the flexor carpi ulnaris muscle of a right arm; For the cerebral blood flow measurement (c) the probe was placed on the frontal bone (frontal eminence) of the left hemisphere of the subject head during voluntary apnea measurement and verbal fluency task.
Fig. 4
Fig. 4
Averaged rBF with the mean standard deviation error for seven subjects during arm cuff occlusion is shown in panel (a). A concordance plot with the concordance correlation coefficient (ρc =0.98) and the Pearson’s correlation coefficient (R=0.96), including the slope (1.14) and the intercept (6.03) of a linear fit are shown in panel (b). The Bland-Altman (difference) plot is shown in panel (c) with a p-value of 0.1, showing that there is no significant difference between the SCOS and the DCS results for the shaded region in panel (a).
Fig. 5
Fig. 5
Embletta result for one representative subject during the whole voluntary apnea protocol. The oxygen saturation (SpO2, left axis, solid line) and the pulse rate (PR, right axis, dotted line) are shown in the top panel. Shaded regions correspond to the 30 s breath-hold period. There is a decrease of the SpO2 after the apnea challenge, and alteration of the PR during the challenge. In the second panel the respiration rate (RR) is shown. In the bottom plot the abdomen and the thorax movement are shown in left (solid line) and right (dotted line) axis respectively. During the breath-hold (shaded region) subject is not breathing (respiration panel), and there is no movement of the thorax and the abdomen (bottom panel).
Fig. 6
Fig. 6
Averaged rCBF over seven subjects with the standard error of the mean computed for all epochs from all seven subjects is shown in panel (a); Concordance plot with Pearson’s correlation coefficient (R=0.95), linear regression fit (the slope (0.9) and the intercept (10.9)), and concordance coefficient (ρc =0.94) are shown in panel (b). The Bland-Altman plot, panel (c) with the p-value of 0.06, showing that there is no significant difference between two techniques for the shaded region in panel (a).
Fig. 7
Fig. 7
Averaged rCBF over three subjects and four letters with the standard deviation of the mean error is shown in panel (a). The concordance correlation coefficient (ρc = 0.80) with Pearson’s R-value (R=0.82) including the slope (0.81) and the intercept (18.3) of the linear regression fit are shown in panel (b). The Bland-Altman plot with the p-value of 0.05, showing that there is no significant difference between the SCOS and the DCS (c) during VTF (shaded region) is shown in panel (c).

References

    1. Zauner A., Muizelaar J. P., “Brain metabolism and cerebral blood flow,” Head Inj. 1997 89–99 (1997).
    1. Devor A., Sakadžić S., Srinivasan V. J., Yaseen M. A., Nizar K., Saisan P. A., Tian P., Dale A. M., Vinogradov S. A., Franceschini M. A., et al. , “Frontiers in optical imaging of cerebral blood flow and metabolism,” J. Cereb. Blood Flow Metab. 32, 1259–1276 (2012).10.1038/jcbfm.2011.195 - DOI - PMC - PubMed
    1. Durduran T., Choe R., Baker W., Yodh A. G., “Diffuse optics for tissue monitoring and tomography,” Rep. Prog. Phys. 73, 076701 (2010).10.1088/0034-4885/73/7/076701 - DOI - PMC - PubMed
    1. Rajan V., Varghese B., van Leeuwen T. G., Steenbergen W., “Review of methodological developments in laser doppler flowmetry,” Lasers Med. Sci. 24, 269–283 (2009).10.1007/s10103-007-0524-0 - DOI - PubMed
    1. Boas D. A., Dunn A. K., “Laser speckle contrast imaging in biomedical optics,” J. Biomed. Opt. 15, 011109 (2010).10.1117/1.3285504 - DOI - PMC - PubMed