. 2017:2017:2145386.
doi: 10.1155/2017/2145386. Epub 2017 Nov 22.

Immune Response and Protective Efficacy of a Heterologous DNA-Protein Immunization with Leishmania Superoxide Dismutase B1

Affiliations

Immune Response and Protective Efficacy of a Heterologous DNA-Protein Immunization with Leishmania Superoxide Dismutase B1

Abebe Genetu Bayih et al. Biomed Res Int. 2017.

Abstract

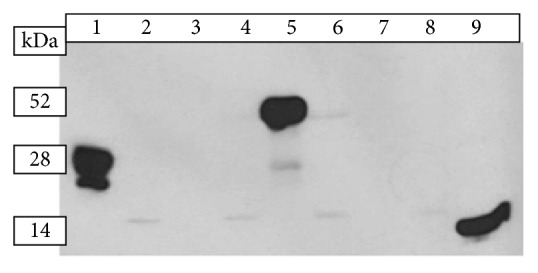
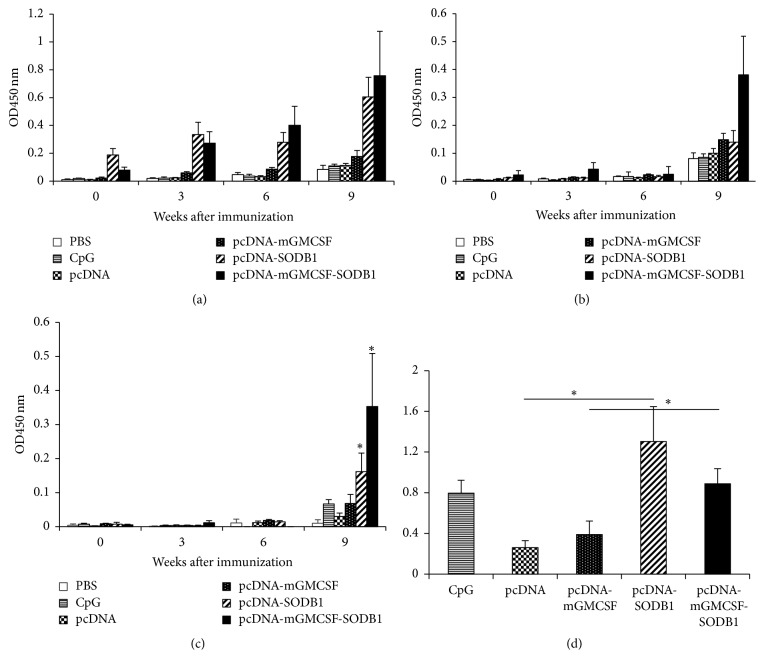
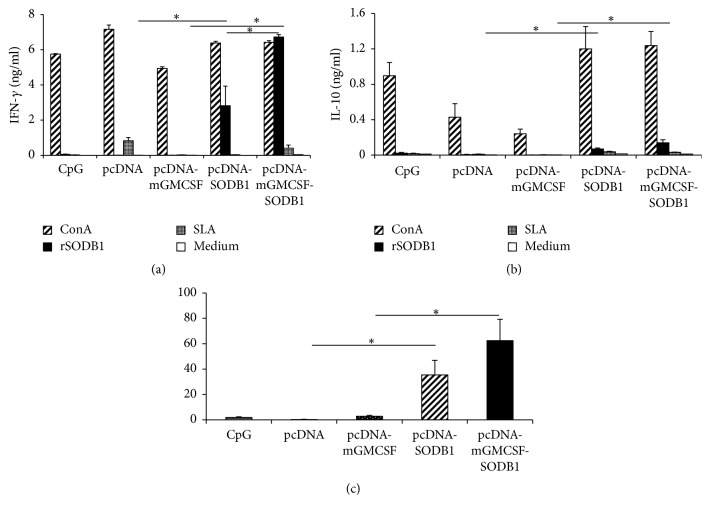
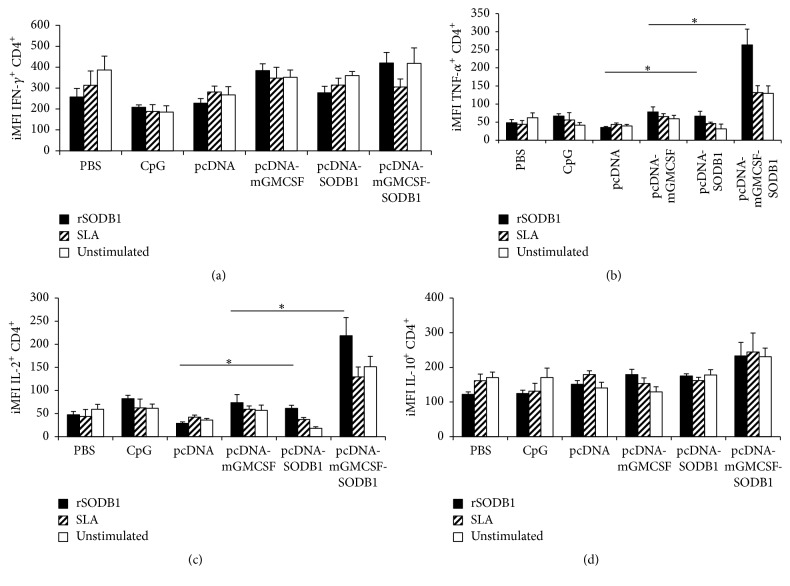
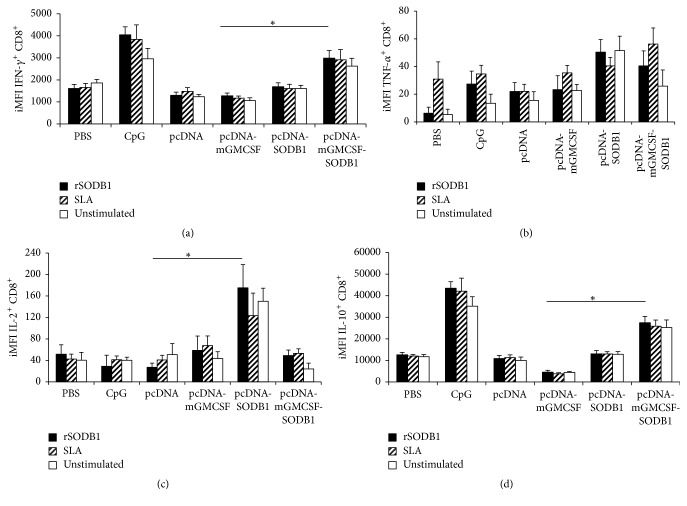
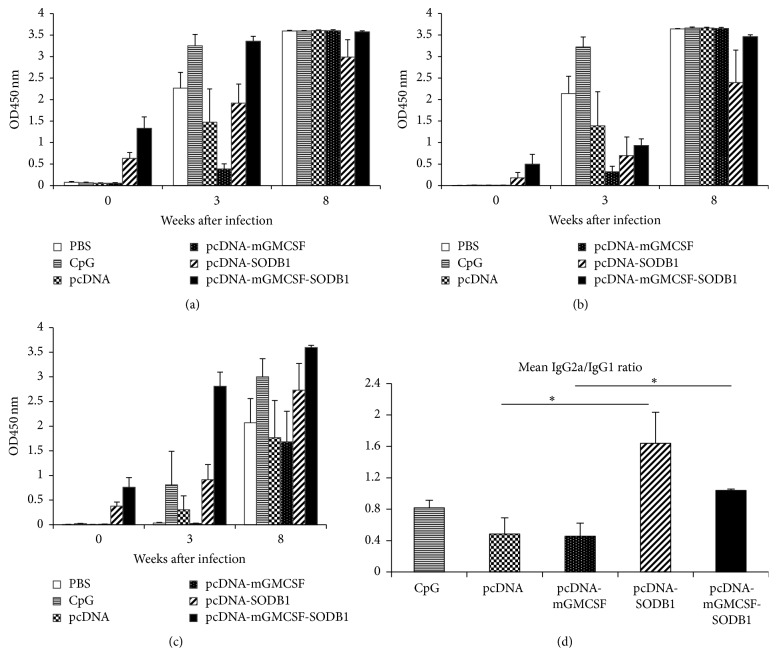
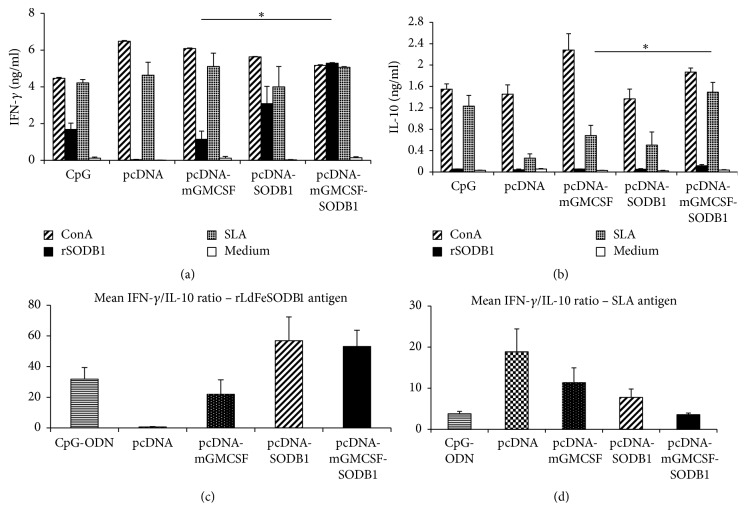
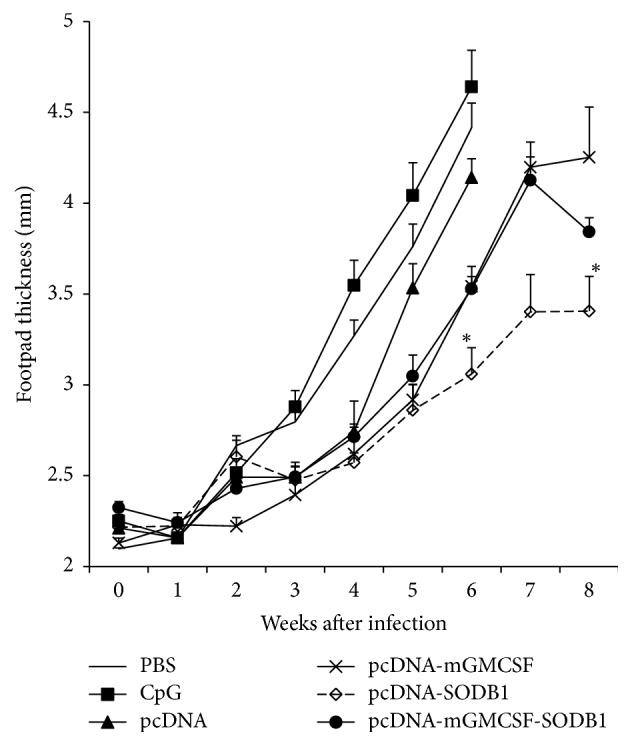
Growing evidence shows that antioxidant proteins of Leishmania could be used as vaccine candidates. In this study, we report the efficacy of Leishmania donovani iron superoxide dismutase B1 (LdFeSODB1) as a vaccine antigen in BALB/c mice in a DNA-protein prime-boost immunization regimen in the presence or absence of murine granulocyte macrophage colony stimulating factor (mGMCSF) DNA adjuvant. The expression study confirmed that LdFeSODB1 is expressed in mammalian cells and mGMCSF fusion mediates the secretion of the recombinant protein. Heterologous immunization with LdFeSODB1 induced a strong antibody- and cell-mediated immune response in mice. Immunization triggered a mixed Th1/Th2 response as evidenced by the ratio of IgG2a to IgG1. Antigen-stimulated spleen cells from the immunized mice produced high level IFN-γ. Multiparametric flow cytometry data showed that immunization with LdFeSODB1 induced significantly higher expression of TNF-α or IL-2 by antigen-stimulated T cells. Eight weeks after L. major infection, immunization with the antigen shifted the immune response to a more Th1 type than the controls as demonstrated by IgG2a/IgG1 ratio. Moreover, IFN-γ production by antigen-stimulated spleen cells from immunized mice remained high. The footpad swelling experiment showed that immunization with LdFeSODB1 resulted in partial protection of mice from a high dose L. major infection.


Figures

Figure 1
Figure 1
Western blotting of samples from CHO cells transfected with LdFeSODB1 gene cloned in pcDNA and pcDNA-mGMCSF. Cell culture supernatant (SUP) and cell lysate (LYS) proteins of transfected CHO cells were run on 12% denaturing polyacrylamide gel and Western blotting was done using rabbit-anti-mGMCSF and ECL-anti-rabbit IgG-HRP (donkey) primary and secondary antibodies, respectively and Lanes: (1) pcDNA-mGMCSF-SUP, (2) pcDNA-mGMCSF-LYS, (3) pcDNA-LdFeSODB1-SUP, (4) pcDNA-LdFeSODB1-LYS, (5) pcDNA-mGMCSF-LdFeSODB1-SUP, (6) pcDNA-mGMCSF-LdFeSODB1-LYS, (7) pcDNA-SUP, (8) pcDNA-LYS, and (9) recombinant mGMCSF protein.
Figure 2
Figure 2
Antigen-specific antibody response in BALB/c mice before challenge. Mice were immunized twice with LdFeSODB1 DNA antigens and controls followed by a boost with the recombinant LdFeSODB1 protein. All immunizations were given in three-week intervals. Blood samples were collected before immunization, at the time of each immunization and upon euthanasia. Total IgG (a), IgG1 (b), and IgG2a (c) against rLdFeSODB1 were measured using ELISA and the result is depicted as mean OD450 nm of five mice per group and standard error of the mean (SEM). The mean IgG2a/IgG1 ratio is depicted in (d). Statistical comparison between groups was performed using Mann–Whitney U test. The assay was done in duplicate wells for each mouse serum. This is one of two experiments with similar result. The asterisk shows statistically significant difference between the vaccine antigen and the respective control groups (p < 0.05).
Figure 3
Figure 3
Prechallenge cytokine response of mice immunized with LdFeSODB1 antigen. The level of cytokine production was assessed in stimulated spleen cells. (a) IFN-γ, (b) IL-10, and (c) mean IFN-γ/IL-10 ratio. Mice were immunized twice with pcDNA-LdFeSODB1 or pcDNA-mGMCSF-LdFeSODB1 and boosted with rLdFeSODB1 protein. The control mice received three doses of pcDNA, pcDNA-mGMCSF, or CpG ODN alone. The level of IFN-γ and IL-10 was measured from stimulated spleen cells using cytokine ELISA kit (BD Biosciences). The concentration of the cytokines (ng/ml) was calculated by correlating the optical density to concentration of the protein standard included in the kit. The mean concentration and standard error of the mean (SEM) of five mice per group are shown. This is one of two experiments with similar result. The IFN-γ/IL-10 ratio was calculated from cells that were stimulated with rLdFeSODB1. Statistical comparison between groups was performed using Mann–Whitney U test. Asterisks indicate statistically significant difference in the cytokine production between mice immunized with antigen and the respective controls (p < 0.05).
Figure 4
Figure 4
Antigen-specific cytokine expressing CD4+ T cells three weeks after the last immunization. Integrated median fluorescent intensity (iMFI) of IFN-γ (a), TNF-α (b), IL-2 (c), and IL-10 (d). Integrated MFI was calculated as a product of the percentage of the cytokine producing CD4+ T cells and the median fluorescent intensity of the cytokine. Mice immunized twice with pcDNA-LdLdFeSODB1 or pcDNA-mGMCSF-LdFeSODB1 were boosted with rLdFeSODB1 protein. The control mice received three doses of pcDNA, pcDNA-mGMCSF, or CpG ODN alone. The percentage of cytokine producing CD4+ T cells as well as MFI was measured in stimulated spleen cells from individual mice. The mean iMFI and standard error of the mean (SEM) of five mice per group are shown. Asterisks indicate statistically significant difference between cells from antigen immunized mice and controls (p < 0.05). Stimulation of spleen cells with PMA/ionomycin produced consistently high response in all groups (data not shown).
Figure 5
Figure 5
Antigen-specific cytokine expressing CD8+ T cells three weeks after the last immunization. Integrated median fluorescent intensity (iMFI) of IFN-γ (a), TNF-α (b), IL-2 (c), and IL-10 (d). Integrated MFI was calculated as a product of the percentage of the cytokine producing CD8+ T cells and the median fluorescent intensity of the cytokine. Mice immunized twice with pcDNA-LdLdFeSODB1 or pcDNA-mGMCSF-LdFeSODB1 were boosted with rLdFeSODB1 protein. The control mice received three doses of pcDNA, pcDNA-mGMCSF, or CpG ODN alone. The percentage of cytokine producing CD8+ T cells as well as MFI was measured in stimulated spleen cells from individual mice. The mean iMFI and standard error of the mean (SEM) of five mice per group are shown. Asterisks indicate statistically significant difference between cells from antigen immunized mice and controls (p < 0.05). Stimulation of spleen cells with PMA/ionomycin produced consistently high response in all groups (data not shown).
Figure 6
Figure 6
Antigen-specific antibody response in BALB/c mice after L. major infection. LdFeSODB1-specific total IgG (a), IgG1 (b), IgG2a (c), and IgG2a/IgG1 ratio; (d) antibody response after infection with L. major. The antibody response was measured using ELISA and the result is depicted as mean OD450 nm of five mice per group and standard error of the mean (SEM). The assay was done in duplicate wells for each mouse serum. Point 0 indicates the time when the mice were infected with L. Major. The statistical difference was compared using compared using Mann–Whitney U test. Asterisks indicate statistically significant difference in IgG2a/IgG1 ratio between mice immunized with the antigen and the control groups (p < 0.05).
Figure 7
Figure 7
Postchallenge cytokine response of mice immunized with LdFeSODB1 antigen. IFN-γ (a) and IL-10 (b) production in stimulated spleen cells was measured using cytokine ELISA. Mice immunized twice with pcDNA-LdFeSODB1 or pcDNA-mGMCSF-LdFeSODB were boosted with rLdFeSODB1. The control mice received three doses of pcDNA, pcDNA-mGMCSF, or CpG ODN alone. Mice were infected with stationary phase L major three weeks after the last immunization. Cytokine ELISA was done on antigen-stimulated and control spleen cells isolated from mice at eight weeks after infection. The data represent the mean cytokine concentration of five mice per group. The mean IFN-γ/IL-10 ratios in cells stimulated with rLdFeSODB1 and SLA are depicted in (c) and (d), respectively. Statistical comparison between groups was performed using Mann–Whitney U test. Asterisks indicate statistically significant difference in the cytokine production between mice immunized with antigen and the respective control (p < 0.05).
Figure 8
Figure 8
Footpad swelling of mice immunized with antigens and controls in DNA/protein immunization strategy and infected with L. major. BALB/c mice (five per group) were immunized twice with DNA antigens and controls in the presence of CpG ODN adjuvant followed by a boost with recombinant LdLdFeSODB1 protein. All immunizations were given in three-week intervals. At week 9, all mice were infected on the footpad with subcutaneous injection of 3 × 10⁶ stationary phase L. major promastigotes in the hind footpad. The footpad swelling was assessed by measuring the thickness of infected footpad weekly for eight weeks using electronic digital caliper. The data represents mean footpad size in millimetre of five mice and standard error of the mean. Asterisks indicate statistically significant difference in footpad swelling between antigen immunized mice and controls (p < 0.05).

Similar articles

Cited by

References

    1. Desjeux P. Leishmaniasis: current situation and new perspectives. Comparative Immunology, Microbiology & Infectious Diseases. 2004;27(5):305–318. doi: 10.1016/j.cimid.2004.03.004. - DOI - PubMed
    1. WHO. WHO, Third WHO Report on Neglected Tropical Diseases, 2015.
    1. Croft S. L., Sundar S., Fairlamb A. H. Drug resistance in leishmaniasis. Clinical Microbiology Reviews. 2006;19(1):111–126. doi: 10.1128/CMR.19.1.111-126.2006. - DOI - PMC - PubMed
    1. Sundar S., Chakravarty J. Leishmaniasis: an update of current pharmacotherapy. Expert Opinion on Pharmacotherapy. 2013;14(1):53–63. doi: 10.1517/14656566.2013.755515. - DOI - PubMed
    1. Khamesipour A., Rafati S., Davoudi N., Maboudi F., Modabber F. Leishmaniasis vaccine candidates for development: a global overview. Indian Journal of Medical Research. 2006;123(3):423–438. - PubMed

MeSH terms

LinkOut - more resources