. 2018 Feb;10(2):139-148.
doi: 10.1038/nchem.2908. Epub 2018 Jan 1.

An integrated native mass spectrometry and top-down proteomics method that connects sequence to structure and function of macromolecular complexes

Affiliations

An integrated native mass spectrometry and top-down proteomics method that connects sequence to structure and function of macromolecular complexes

Huilin Li et al. Nat Chem. 2018 Feb.

Abstract

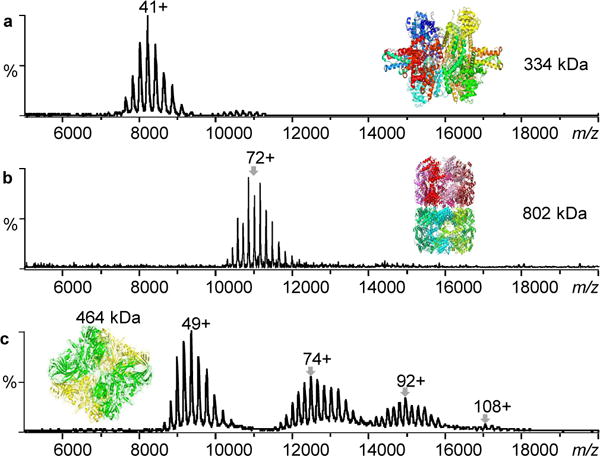
Mass spectrometry (MS) has become a crucial technique for the analysis of protein complexes. Native MS has traditionally examined protein subunit arrangements, while proteomics MS has focused on sequence identification. These two techniques are usually performed separately without taking advantage of the synergies between them. Here we describe the development of an integrated native MS and top-down proteomics method using Fourier-transform ion cyclotron resonance (FTICR) to analyse macromolecular protein complexes in a single experiment. We address previous concerns of employing FTICR MS to measure large macromolecular complexes by demonstrating the detection of complexes up to 1.8 MDa, and we demonstrate the efficacy of this technique for direct acquirement of sequence to higher-order structural information with several large complexes. We then summarize the unique functionalities of different activation/dissociation techniques. The platform expands the ability of MS to integrate proteomics and structural biology to provide insights into protein structure, function and regulation.


Conflict of interest statement

COMPETING FINANCIAL INTERESTS

The authors declare no competing financial interests.

Figures

Figure 1
Figure 1
Macromolecular protein complex with molecular weights up to 1.86 MDa can be transmitted and detected by FTICR mass spectrometry under native ESI condition. a) Glutamate dehydrogenase, b) GroEL, and c) aggregated β-galactosidase.
Figure 2
Figure 2
Structure of Glutamate dehydrogenase (GP). a) Structural states of GP controlled by phosphorylation and allosteric interactions. b) Biological assembly of GP structure (PDB 8GPB). The phosphorylation, AMP, and PLP sites are displayed to present their potential locations.
Figure 3
Figure 3
Native top-down MS analysis of GP. a) ISD-CAD-ECD spectrum of GP. The red dots represent charge-reduced monomers and the black-filled squared are charge-reduced dimers. b) Fragmentation map of GP with ISD-CAD-ECD fragmentation sites colored in red and IRMPD sites in blue. c) IRMPD spectrum of GP. “ω” represents harmonic peaks and the cyan, purple, and orange dots represent noncovalently bound fragment peaks. d) GP structure with ISD-CAD-ECD fragmentation sites in red and IRMPD sites in cyan. e) The C-terminal residues 838–841 form salt bridges with His36′ from the other subunit. f) The N-terminal basic residues (K9RKQISVR16) interact intra-molecularly with a pocket of acidic residues Asp109, Glu110, Glu120, Glu501, Glu505, and Glu509. The first 10 amino acid residues were not presented in the PDB (8GPB) structure.
Figure 4
Figure 4
Structure of bovine glutamate dehydrogenase (GDH) (PDB 1HWZ). a) Hexameric GDH with six subunits displayed in different colors. b) Cartoon structure of one GDH subunit. The N-terminus is shown in yellow and the C-terminus in cyan. Asp6 and Asn8 (yellow spheres) form direct contacts with Lys329 (violet sphere).
Figure 5
Figure 5
Native top-down MS analysis of GDH. a) IRMPD mass spectrum of GDH. Fragment ions labeled in cyan and red dots are 5-mer+b287 and 5-mer+b350, respectively. They are complementary ions of y214 and y151, respectively. b) Expanded spectrum of the low-m/z region of Fig. 5a. The y-ions in black are unmodified, ym represent y-ions with methylation (ym= ym+CH2), and internal fragments are in red *. Detailed peak lists are available in Supplementary Table 3. c) Expanded spectra to show GDH proteoforms with different PTMs. d) Locations of observed PTMs. The potential oxidation sites (Met457, Met465, or Met469) are colored in blue and methylation site (Lys400, Lys420, Lys423, Arg396, Arg403, or Arg419) are in cyan. GTP is in green and NAD is in grey. Mutation sites reported in human GDH are labeled in yellow. e) Structure of GDH with the sequence coverage regions by IRMPD colored in red.
Figure 6
Figure 6
Native top-down MS analysis of β-galactosidase (β-GTD). a) CAD mass spectrum of β-GTD. b) Observed proteoforms with different PTMs and site mutations. c) Relative ratio of proteoforms based on the intensity of fragment ions (Blue: unmodified; Orange: oxidized (+15.98930); Green: +30.98345; and Purple: +43.9905. d) Structure of β-GTD (PDB 1F4A) with the regions sequenced by IRMPD in red, and CAD in purple. e) The activating interface between chain B (yellow) and chain C (green) with the N-terminal tail highlighted in purple (AA 1-50). f) The long interface between chain C (green) and chain D (orange). The C-terminal residues Asp869, Asp954, Arg1013, and His1015 from C chain interact with residues Asp869′, Asp954′, Arg1013′, and His1015′ from D chain through salt bridges.
Figure 7
Figure 7
Native top-down ECD reveals the structural features of protein complexes. a) Group I: ECD yielded direct sequence information for Horse liver alcohol dehydrogenase (hADH, PDB 2OHX), yeast alcohol dehydrogenase (yADH, PDB 4W6Z), aldolase (PDB 1ZAH), and human transferrin receptor (hTfR, PDB 1SUV). b) Group II: No c/z fragments were observed for GPb (PDB 8GPB), pyruvate kinase (PK, PDB 1F3W), GDH (PDB 1HWZ), β-GTD (PDB 1F4A), SOD1 (PDB 2C9V), GroES (PDB 1PCQ), and GroEL (PDB 4HEL). The ECD fragmented residues are displayed in red on the structures; interfacial residues were calculated using PISA (http://www.ebi.ac.uk/pdbe/prot_int/pistart.html) and colored in salmon. The corresponding subunit structure is shown at the right-hand of the each complex structure to demonstrate the relative positions of N- and C-termini to the subunit interaction interfaces (yellow dash-lines).

References

    1. Sharon M. How Far Can We Go with Structural Mass Spectrometry of Protein Complexes? J Am Soc Mass Spectrom. 2010;21:487–500. - PubMed
    1. Heck AJR. Native mass spectrometry: a bridge between interactomics and structural biology. Nat Meth. 2008;5:927–933. - PubMed
    1. Lorenzen K, Duijn EV. Current Protocols in Protein Science. John Wiley & Sons, Inc; 2001.
    1. van Duijn E. Current Limitations in Native Mass Spectrometry Based Structural Biology. J Am Soc Mass Spectrom. 2010;21:971–978. - PubMed
    1. Benesch JLP, Ruotolo BT, Simmons DA, Robinson CV. Protein Complexes in the Gas Phase: Technology for Structural Genomics and Proteomics. Chem Rev. 2007;107:3544–3567. - PubMed

Publication types

MeSH terms

Substances