. 2018 May 16;9(5):976-987.
doi: 10.1021/acschemneuro.7b00399. Epub 2018 Feb 6.

Functional Modulation of Voltage-Gated Sodium Channels by a FGF14-Based Peptidomimetic

Affiliations

Functional Modulation of Voltage-Gated Sodium Channels by a FGF14-Based Peptidomimetic

Syed R Ali et al. ACS Chem Neurosci. .

Abstract

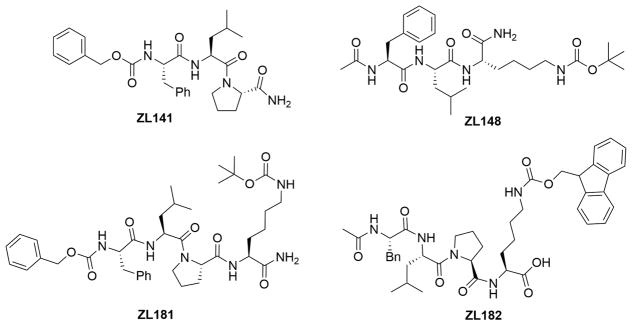
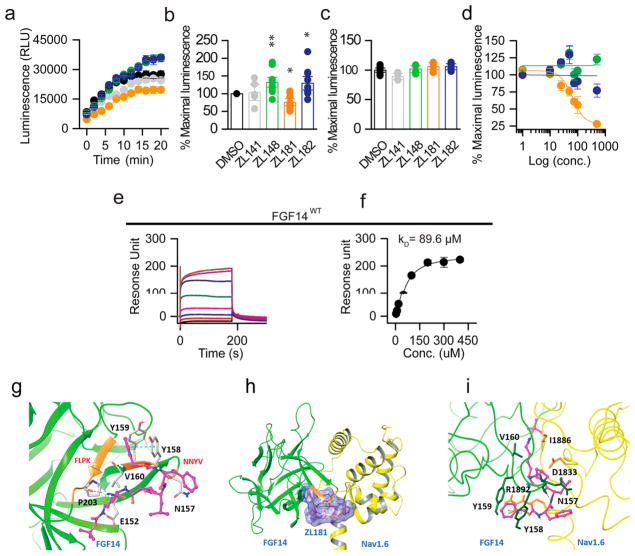
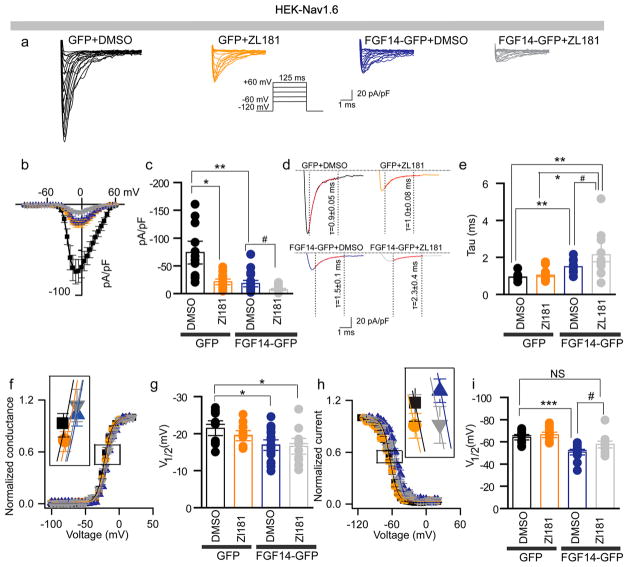
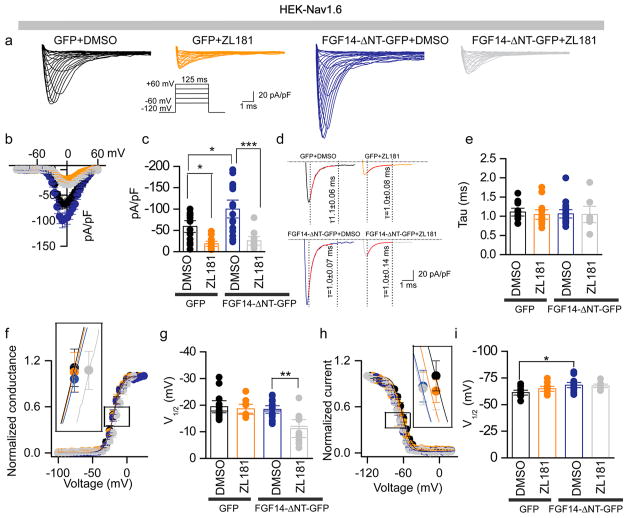
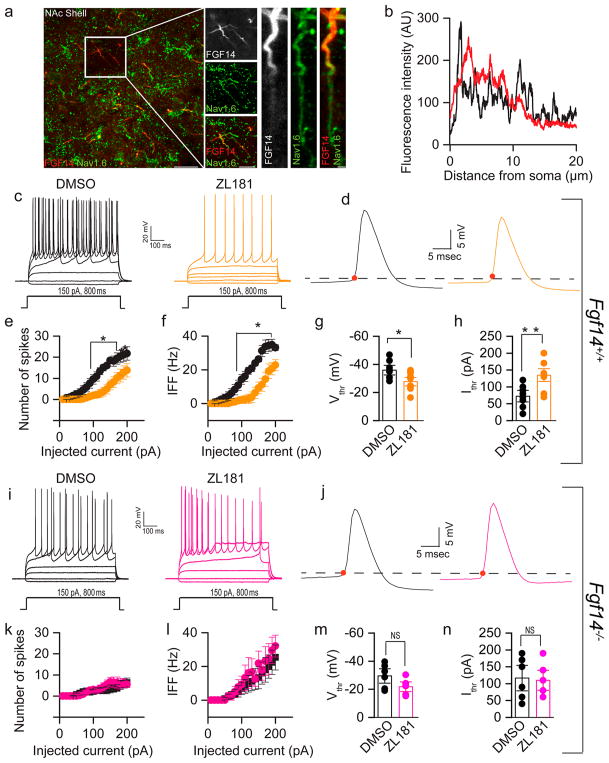
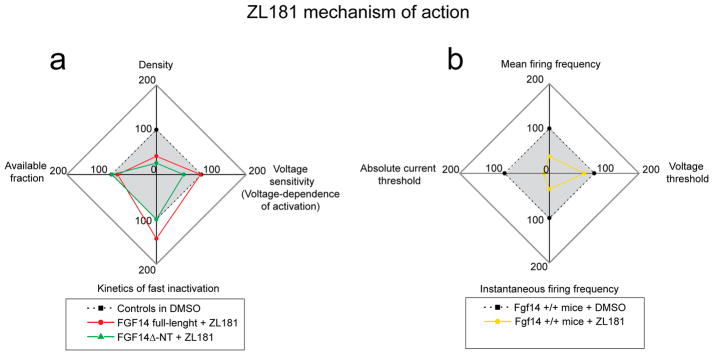
Protein-protein interactions (PPI) offer unexploited opportunities for CNS drug discovery and neurochemical probe development. Here, we present ZL181, a novel peptidomimetic targeting the PPI interface of the voltage-gated Na+ channel Nav1.6 and its regulatory protein fibroblast growth factor 14 (FGF14). ZL181 binds to FGF14 and inhibits its interaction with the Nav1.6 channel C-tail. In HEK-Nav1.6 expressing cells, ZL181 acts synergistically with FGF14 to suppress Nav1.6 current density and to slow kinetics of fast inactivation, but antagonizes FGF14 modulation of steady-state inactivation that is regulated by the N-terminal tail of the protein. In medium spiny neurons in the nucleus accumbens, ZL181 suppresses excitability by a mechanism that is dependent upon expression of FGF14 and is consistent with a state-dependent inhibition of FGF14. Overall, ZL181 and derivatives could lay the ground for developing allosteric modulators of Nav channels that are of interest for a broad range of CNS disorders.

Keywords: CNS drug discovery; Fibroblast growth factor 14 (FGF14); minimal functional domains; neurochemical probes; peptidomimetics; protein:protein interaction (PPI); voltage-gated sodium channels (Nav1.6).


Conflict of interest statement

The authors declare no competing financial interest.

Figures

Figure 1
Figure 1
Chemical structures of four selected newly synthesized peptidomimetics ZL181, ZL141, ZL148, and ZL182.
Figure 2
Figure 2
In-cell and in vitro validation of ZL181. (a) Luminescence values from HEK293 cells expressing CLuc-FGF14 and CD4-Nav1.6-NLuc constructs treated with ZL141 (gray), ZL148 (green), ZL181 (orange), ZL182 (blue) at 50 μM or 0.5% DMSO (black). (b) Bar chart with data points overlap represents percent maximal luminescence of ZL141, ZL148, ZL181, and ZL182 normalized to DMSO. (c) Bar chart with data points overlap represents percent maximal luminescence from HEK293 cells expressing the full-length luciferase treated with ZL141, ZL148, ZL181, and ZL182 and normalized to DMSO. (d) LCA-based dose–responses of ZL148, ZL181, and ZL182 against CLuc-FGF14 and CD4-Nav1.6-NLuc. (e) The representative SPR sensorgram of ZL181 binding to FGF14WT and (f) saturation binding curves (n = 3). (g) Ribbon presentation of ZL181 (purple) docking on FGF14 (green) homology model. FLPK and NYYV sequences are highlighted in orange. Hydrogen bonds are shown as purple dotted lines, and ππ interaction as blue dotted line. (h) ZL181 docking at the PPI of the FGF14 (green) and Nav1.6 (yellow) complex. The binding surface of ZL181 (purple) is shown in blue. (i) Zoomed view of ZL181 (purple) docking pose overlay at the PPI interface of the FGF14:Nav1.6 complex. Data represented as mean ± SEM, *p < 0.05; **p < 0.01.
Figure 3
Figure 3
Complex functional regulation of the Nav1.6-mediated currents by ZL181. (a) Representative traces of Na+ transient currents (INa+) recorded from HEK-Nav1.6 cells transiently expressing GFP or FGF14-GFP constructs in response to depolarizing voltage steps (inset). GFP-expressing cells were treated with 0.2% DMSO (black traces) or with 20 μM ZL181 (orange traces). FGF14-GFP expressing cells were treated with either 0.2% DMSO (blue traces) or 20 μM ZL181 (gray traces). (b) Current–voltage relationships of INa from the experimental groups described in panel (a). (c) Bar chart with data points overlap represents peak current densities derived from panel (a). (d) Representative traces of experimental groups described in panel (a) to illustrate tau (τ) of INa+. (e) Summary bar chart with data points overlap of τ from the indicated experimental groups. Voltage dependence of INa+ activation (f) and steady-state inactivation (h) are plotted as a function of the membrane potential (mV). Bar chart with data points overlap summary of V1/2 of activation (g) and steady-state inactivation (i) in the indicated experimental groups. Data are mean ± SEM; *p < 0.05; **p < 0.01. The fitted parameters are provided in Supporting Information Table S1.
Figure 4
Figure 4
ZL181 functional regulation of Nav1.6-mediated currents is influenced by the FGF14 N-terminal tail. (a) Representative traces of Na+ transient currents (INa+) recorded from HEK-Nav1.6 cells transiently expressing the indicated constructs in response to depolarizing voltage steps (inset); GFP-expressing cells were treated with 0.2% DMSO (black traces) or 20 μM ZL181 (orange traces). FGF14-ΔNT-GFP expressing cells were treated with either 0.2% DMSO (blue traces) or 20 μM ZL181 (gray traces). (b) Current–voltage relationships of INa from the experimental groups described in (a). (c) Bar chart with data points overlap representing peak current densities derived from panel (a). (d) Representative traces of experimental groups described in panel a to illustrate τ of INa+. (e) Summary bar chart with data points overlap of τ from the indicated experimental groups. Voltage dependence of INa+ activation (f) and steady-state inactivation (h) are plotted as a function of the membrane potential (mV). Bar chart with data points overlap summary of V1/2 of activation (g) and steady-state inactivation) (i) in the indicated experimental groups. Data are mean ± SEM; *p < 0.05; **p < 0.01. The fitted parameters are provided in Supporting Information Table S2.
Figure 5
Figure 5
ZL181 suppresses firing of MSNs in the NAc. (a) Representative confocal images showing colocalization of Nav1.6 (green) and FGF14 (red) in the NAc. Note that Nav1.6 and FGF14 immunoreactivities were intense in the proximal region of the AIS. (b) Representative examples of Nav1.6 channels immunofluorescence intensity line scans along the AIS regions in individual neurons expressing FGF14. Nav1.6 (black), FGF14 (red). (c) Representative traces of action potentials (AP) evoked by multiple current steps (−20, 0, 50, 80, and 110 pA current steps of 800 ms duration) in MSNs from Fgf14+/+ mice treated with either 0.05% DMSO (black) or 50 μM ZL181 (orange); (d) single AP traces from the two corresponding experimental groups shown in c. Representative Input–output curves of (e) number of spikes, and (f) average instantaneous firing frequency (IFF) at varying injected current stimuli recorded in MSN from Fgf14+/+ mice in response to 0.05% DMSO (black) or 50 μM ZL181 (orange) treatment. Bar graph with data points overlap represents (g) voltage threshold and (h) current threshold in MSN from Fgf14+/+ mice in response to 0.05% DMSO (black) and 50 μM ZL181 (orange) treatment. Representative traces of AP in MSN from Fgf14−/− after (i) 0.05% DMSO (black), and 50 μM ZL181 (pink) treatment, (j) single AP traces of 0.05% DMSO (black) or 50 μM ZL181 (pink). Representative input–output curves of (k) number of spikes and (l) average IFF at varying injected current stimuli recorded in MSN from Fgf14−/− mice in response to 0.05% DMSO (black) and 50 μM ZL181 (pink) treatment. Bar chart with data points overlap represents (m) voltage threshold and (n) current threshold in MSN from Fgf14−/− mice in response to 0.05% DMSO (black) and 50 μM ZL181 (pink) treatment. Data are mean ± SEM; *p < 0.05, **p < 0.01, ***p < 0.005.
Figure 6
Figure 6
Radial plots summarizing the mechanism of action of ZL181 in heterologous cells and in MSNs. (a) Peak current density (top), V1/2 of activation (right, defined as “voltage-sensitivity”), tau of fast inactivation (bottom) and available fraction of channels calculated from V1/2 of steady-state inactivation (left) in HEK-Nav1.6 cells treated with ZL181 and expressing either full-length FGF14-GFP (red) or FGF14-ΔNT-GFP (green); data sets are normalized to respective controls treated with DMSO (either full-length FGF14-GFP or FGF14-ΔNT-GFP; these two control data sets are displayed in blue in Figures 3 and 4, respectively). The data points inside the gray box represent suppression (green line) or increase (red line) of Nav1.6 channel function in the presence of ZL181 compared to respective DMSO control. (b) Mean firing frequency (top), action potential voltage threshold (right), instantaneous firing frequency (bottom), and action potential current threshold (left) in Fgf14+/+ wild type MSNs exposed to ZL181 (yellow line) compared to DMSO controls (dotted line); data are normalized to their respective controls treated with DMSO (displayed in black in Figure 5a–h). The action potential current threshold value is absolute as it refers to absolute Vm values (i.e., a Vthr of –40 mV is referred to as “40 mV”). The data points inside the gray box represent suppression (yellow line) of intrinsic firing in the presence of ZL181 compared to respective DMSO control.

References

    1. Catterall WA. Voltage-gated sodium channels at 60: structure, function and pathophysiology. J Physiol. 2012;590:2577–2589. - PMC - PubMed
    1. Leterrier C, Brachet A, Fache MP, Dargent B. Voltage-gated sodium channel organization in neurons: protein interactions and trafficking pathways. Neurosci Lett. 2010;486:92–100. - PubMed
    1. Wildburger NC, Ali SR, Hsu WC, Shavkunov AS, Nenov MN, Lichti CF, LeDuc RD, Mostovenko E, Panova-Elektronova NI, Emmett MR, Nilsson CL, Laezza F. Quantitative proteomics reveals protein-protein interactions with fibroblast growth factor 12 as a component of the voltage-gated sodium channel 1.2 (nav1.2) macromolecular complex in Mammalian brain. Mol Cell Proteomics. 2015;14:1288–1300. - PMC - PubMed
    1. Fleidervish IA, Lasser-Ross N, Gutnick MJ, Ross WN. Na+ imaging reveals little difference in action potential-evoked Na+ influx between axon and soma. Nat Neurosci. 2010;13:852–860. - PMC - PubMed
    1. Hu W, Tian C, Li T, Yang M, Hou H, Shu Y. Distinct contributions of Na(v)1.6 and Na(v)1.2 in action potential initiation and backpropagation. Nat Neurosci. 2009;12:996–1002. - PubMed

Publication types

LinkOut - more resources