. 2018 Apr;103(4):749-759.
doi: 10.1002/JLB.5A0817-324R. Epub 2018 Jan 23.

Adrenomedullin surges are linked to acute episodes of the systemic capillary leak syndrome (Clarkson disease)

Affiliations

Adrenomedullin surges are linked to acute episodes of the systemic capillary leak syndrome (Clarkson disease)

Zhihui Xie et al. J Leukoc Biol. 2018 Apr.

Abstract

Background: Systemic Capillary Leak Syndrome (SCLS) is an extremely rare and life-threatening vascular disorder of unknown etiology. SCLS is characterized by abrupt and transient episodes of hypotensive shock and edema due to plasma leakage into peripheral tissues. The disorder has garnered attention recently because its initial presentation resembles more common vascular disorders including systemic anaphylaxis, sepsis, and acute infections with the Ebola/Marburg family of filoviruses. Although approximately 70-85% of patients with SCLS have a concurrent monoclonal gammopathy of unknown significance (MGUS), any contribution of the paraprotein to acute flares is unknown.

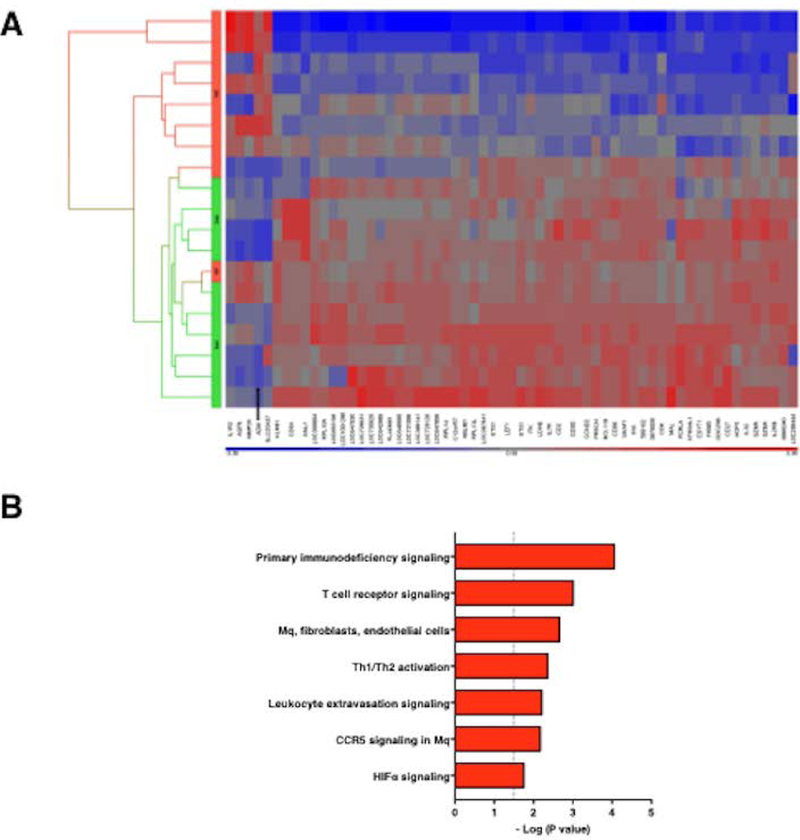
Procedure: To identify circulating factors that might trigger acute SCLS crises, we profiled transcriptomes of paired peripheral blood mononuclear cell fractions obtained from patients during acute attacks and convalescent intervals by microarray.

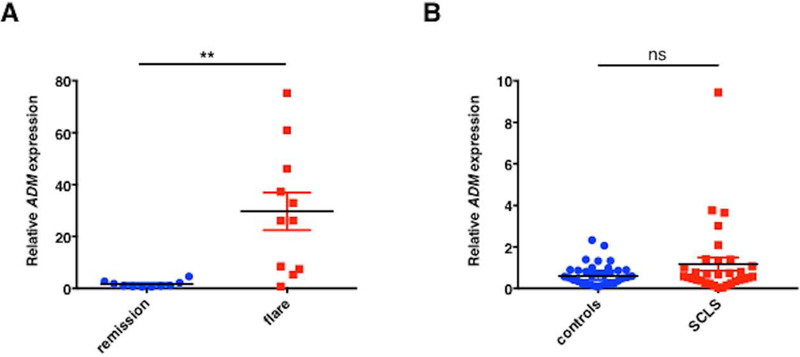
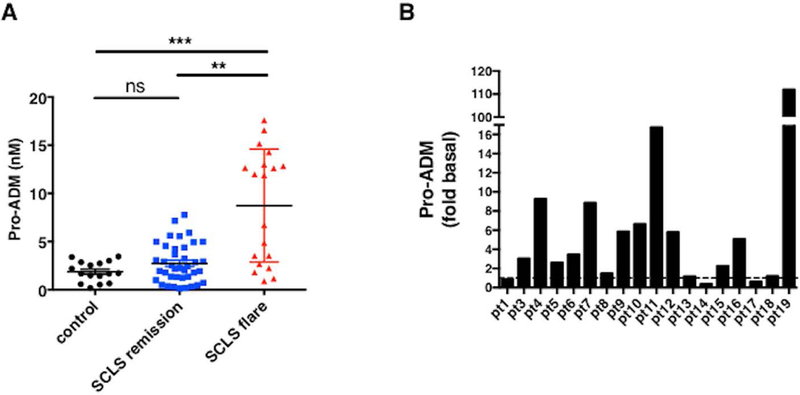
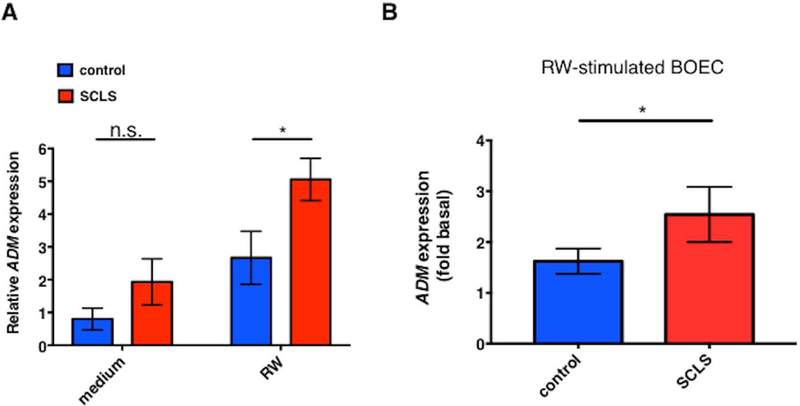
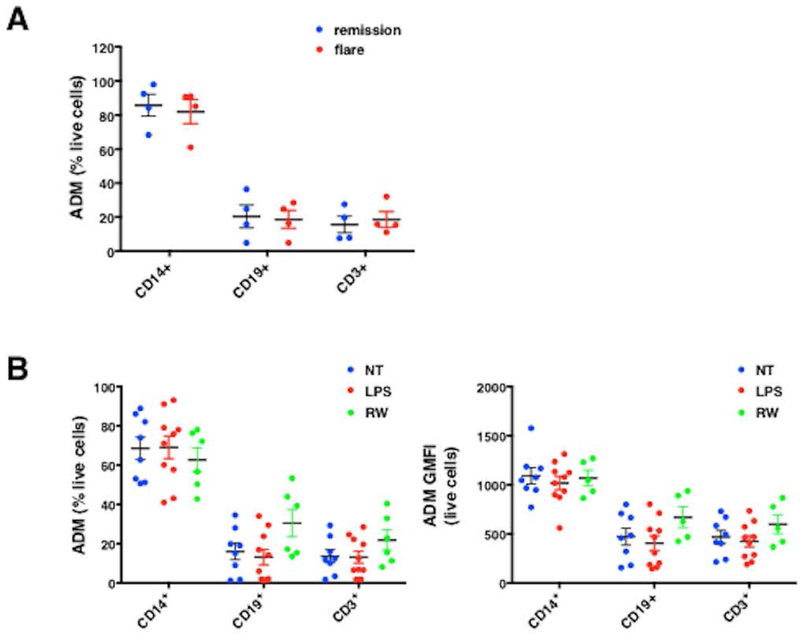
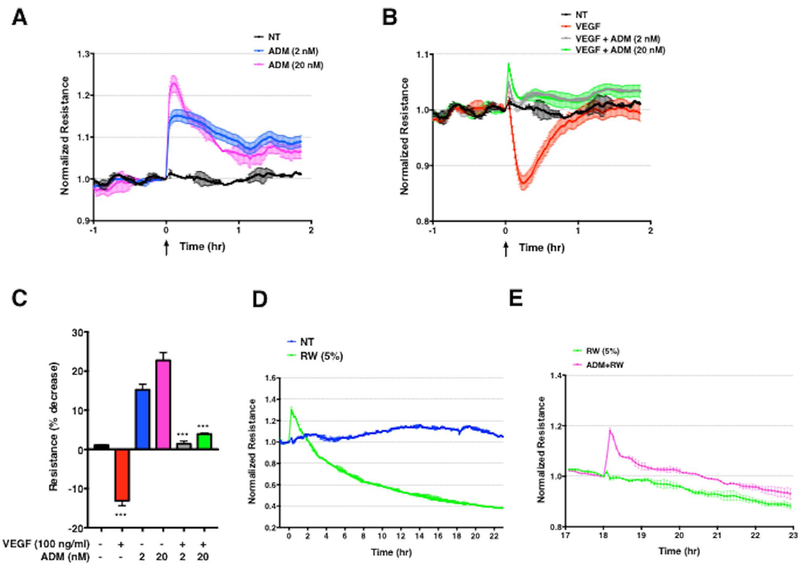
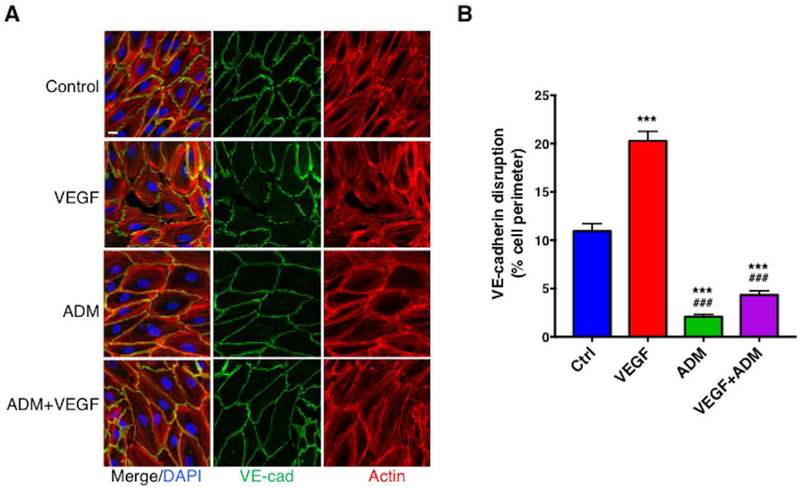
Results: This study uncovered 61 genes that were significantly up- or downregulated more than 2.5-fold in acute samples relative to respective baselines. One of the most upregulated genes was ADM, which encodes the vasoactive peptide adrenomedullin. A stable ADM protein surrogate (pro-ADM) was markedly elevated in SCLS acute sera compared to remission samples or sera from healthy controls. Monocytes and endothelial cells (ECs) from SCLS subjects expressed significantly more ADM in response to proinflammatory stimuli compared to healthy control cells. Application of ADM to ECs elicited protective effects on vascular barrier function, suggesting a feedback protective mechanism in SCLS.

Conclusions: Since ADM has established hypotensive effects, differentiating between these dual actions of ADM is crucial for therapeutic applications aimed at more common diseases associated with increased ADM levels.

Keywords: adrenomedullin; angiogenesis; endothelium; vascular leak.


Conflict of interest statement

Conflict of Interests

The authors declare no conflicts of interest.

Figures

Figure 1
Figure 1. HeatMap of significantly altered genes in SCLS subjects during disease flares relative to disease quiescence.
(A) PBMCs from 12 SCLS subjects, obtained during either remission (basal) or acute (episodic) phases, were isolated from peripheral blood. RNA was extracted and subjected to microarray analysis as described in the Methods. 61 genes were significantly changed for at least 2.5-fold by 2-Way ANOVA, as shown in the Hierarchical Clustering HeatMap (A) (p < 0.05). y-axis is color coded to indicate basal (green) or acute episodic (red) samples. (B) Ingenuity pathway analysis of transcriptome analysis of acute vs. basal PBMCs graphed by Benjamini-Hochberg corrected p-value. Dash p=0.05; Mq=macrophage.
Figure 2
Figure 2. ADM expression in PBMCs.
(A-B) Total RNA was extracted from PBMCs obtained from SCLS patients (during periods of remission or flares) or from healthy controls and reversed transcribed into cDNA. TaqMan gene-specific probes were used to analyze relative ADM. Data are mean ± s.e.m.; **p= 0.004; Wilcoxon paired t test; ns = not significant, unpaired t test.
Figure 3
Figure 3. Elevated pro-ADM serum levels during SCLS flares.
Sera from SCLS subjects (obtained during flares or periods of remission) or from healthy donors were analyzed by ADM-specific ELISA. (A) Data show mean ± s.e.m., n=16–20 per group; ***p < 0.0003, Kruskal-Wallis. (B) Data are fold change over basal pro-ADM levels for each individual SCLS subject.
Figure 4
Figure 4. ADM expression in leukocytes and ECs in SCLS.
(A-B) ADM expression was assessed in purified monocytes (A) or blood outgrowth ECs (BOEC, B) from SCLS or controls by qPCR. Cells were left untreated or stimulated with 10% RW medium for 24 hours prior to RNA extraction and cDNA synthesis. Plots in (A) show mean ± s.e.m. of 6–8 subjects/group. In B, values are the relative expression in stimulated cells relative to unstimulated cells in each group (‘fold basal’). *p = 0.04, 2-way ANOVA.
Figure 5
Figure 5. Monocytes are a major source of ADM within PBMCs.
(A-B) Intracellular ADM expression in PBMCs from SCLS patients obtained during flares or remissions (A) or from controls left untreated (no treatment, NT) or stimulated with LPS (100 ng/ml) or 10% conditioned macrophage medium (“RW”) for 24 hours was evaluated by flow cytometry in the presence of monensin (B). Frequency of ADM producing cells is expressed as percentage of total live cells (A, B left panel), or geometric mean of fluorescence intensity of ADM expression/per cell (GMFI, B right panel).
Figure 6
Figure 6. ADM enhances endothelial barrier function in vitro.
(A–C) Representative electrical resistance measurements across HMVEC monolayers over time following stimulation of ADM alone (A) or together with VEGF-A (B) at the indicated concentrations. NT = cells incubated with medium plus 0.2% BSA. In C, bar chart represents mean ± s.e.m. of the maximal percent decrease in resistance compared to baseline, measured in two independent experiments run in duplicate. ***p = 0.0002, one-way ANOVA, Tukey’s multiple comparisons. (D–E) Impedance measurements in HMVECs stimulated with RW medium (5% vol/vol) (D) or RW medium for 18 hours followed by application of ADM (E). Graphs are from a single experiment representative of three similar experiments.
Figure 7
Figure 7. ADM inhibits VEGF-mediated adherens junction disruption.
(A–B) Confluent HMVECs were treated with VEGF-A (100 ng/ml), ADM (20 nM) or both together for 15 min at 37°C. Cells were immunostained with anti-VE-cadherin (green) and phalloidin (Actin, red) and cell nuclei were counterstained with DAPI (blue) (A). (B) VE-cadherin disruption was quantified as described in the Methods. Data are plotted as mean ± s.e.m. and analyzed using one-way ANOVA. ***p< 0.001 vs. control; ###p<0.001 vs. VEGF-A. n≧119 cells for each group measured in three independent experiments. Bar = 15 μm.

References

    1. Kapoor P, Greipp PT, Schaefer EW, et al. Idiopathic systemic capillary leak syndrome (Clarkson’s disease): the Mayo clinic experience. Mayo Clin Proc 2010;85(10):905–912. - PMC - PubMed
    1. Gousseff M, Arnaud L, Lambert M, et al. The systemic capillary leak syndrome: a case series of 28 patients from a European registry. Ann Intern Med 2011;154(7):464–471. - PubMed
    1. Druey KM, Greipp PR. Narrative review: the systemic capillary leak syndrome. Ann Intern Med 2010;153(2):90–98. - PMC - PubMed
    1. Eo TS, Chun KJ, Hong SJ, et al. Clinical Presentation, Management, and Prognostic Factors of Idiopathic Systemic Capillary Leak Syndrome: A Systematic Review. J Allergy Clin Immunol Pract 2017(in press) - PubMed
    1. Xie Z, Ghosh CC, Patel R, et al. Vascular endothelial hyperpermeability induces the clinical symptoms of Clarkson disease (the systemic capillary leak syndrome). Blood 2012;119(18):4321–4332. - PMC - PubMed

Publication types

MeSH terms