

Variation in Intraocular Pressure and the Risk of Developing Open-Angle Glaucoma: The Los Angeles Latino Eye Study
- PMID: 29360458
- PMCID: PMC5871564
- DOI: 10.1016/j.ajo.2018.01.013
Variation in Intraocular Pressure and the Risk of Developing Open-Angle Glaucoma: The Los Angeles Latino Eye Study
Abstract
Purpose: To determine whether measures of intraocular pressure (IOP) variation are independently associated with the risk of developing open-angle glaucoma (OAG).
Design: A population-based, longitudinal study.
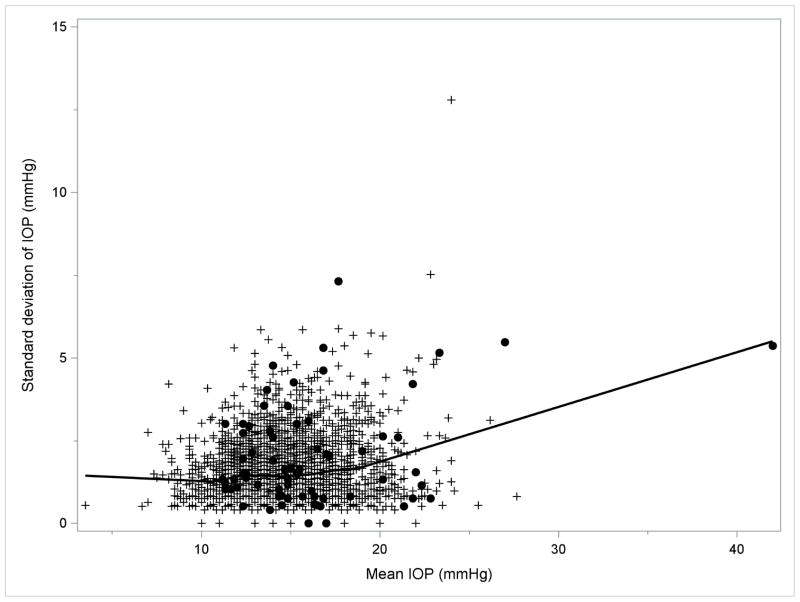
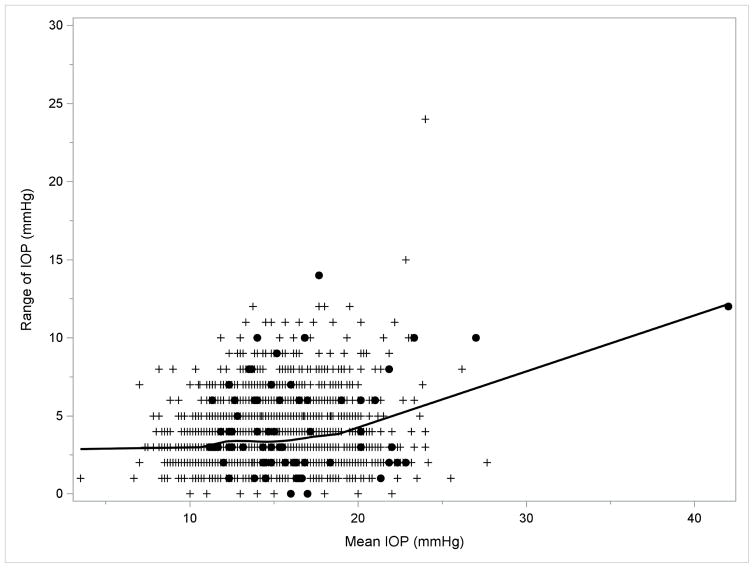
Methods: A total of 3666 Latinos free of OAG at the baseline of the Los Angeles Latino Eye Study were followed up 4 years later. Maximum IOP, standard deviation (SD) of IOP, range of IOP, and mean IOP were derived from 6 readings obtained at the 2 visits. OAG diagnosis at each visit was based on the consensus of experts who had access to all clinical examination data from that visit. Multivariate logistic regression was performed.
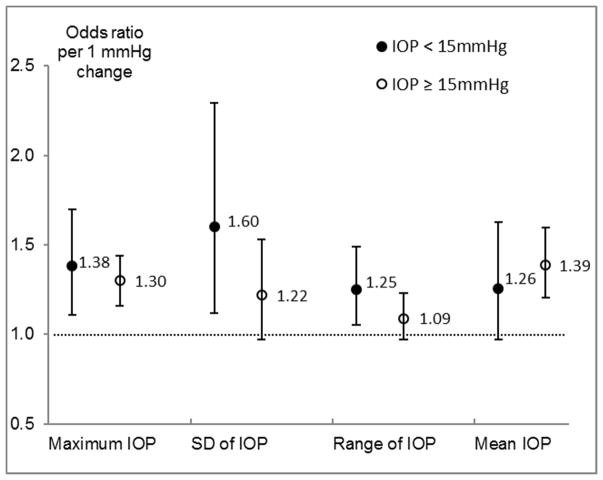
Results: Maximum, SD, and range of IOP were all associated with risk of developing OAG, and SD and range of IOP remained significantly associated even after adjustment for mean IOP. Maximum IOP provided the best fit to the data and other IOP measures were not associated with OAG risk in the model that had included maximum IOP. The effect of IOP variation varied by the level of IOP. Among participants with higher IOPs (≥15 mm Hg), only higher levels of maximum IOP were associated with a higher OAG risk (P < .05), while SD and range of IOP were not associated with OAG risk. Among participants with lower IOPs (<15 mm Hg), higher levels of maximum, SD, and range of IOP were all associated with a higher risk of developing OAG (P < .05). Mean IOP was associated with OAG risk only in participants with higher IOPs and not in those with lower IOPs. Results were similar when participants were stratified as <18 and ≥18 mm Hg.
Conclusions: IOP variation was an independent risk factor for OAG. Maximum IOP was the most consistent IOP measure for predicting OAG risk across the entire spectrum of IOPs, possibly by capturing the effect of IOP variation among persons with relative lower IOPs as well as mean IOP effects in those with higher IOPs.
Copyright © 2018 Elsevier Inc. All rights reserved.
Conflict of interest statement
Figures
References
-
- Collaer N, Zeyen T, Caprioli J. Sequential office pressure measurements in the management of glaucoma. J Glaucoma. 2005;14(3):196–200. - PubMed
-
- Singh K, Shrivastava A. Intraocular pressure fluctuations: how much do they matter? Curr Opin Ophthalmol. 2009;20(2):84–7. - PubMed
-
- Singh K, Sit AJ. Intraocular pressure variability and glaucoma risk: complex and controversial. Arch Ophthalmol. 2011;129(8):1080–1081. - PubMed
-
- Tajunisah I, Reddy S, Fathilah J. Diurnal variation of intraocular pressure in suspected glaucoma patients and their outcome. Graefes Arch Clin Exp Ophthalmol. 2007;245(12):1851–7. - PubMed
Publication types
MeSH terms
Grants and funding
LinkOut - more resources
Full Text Sources
Other Literature Sources
