. 2018 Feb 1;141(2):422-458.
doi: 10.1093/brain/awx350.

Concussion, microvascular injury, and early tauopathy in young athletes after impact head injury and an impact concussion mouse model

Affiliations

Concussion, microvascular injury, and early tauopathy in young athletes after impact head injury and an impact concussion mouse model

Chad A Tagge et al. Brain. .

Abstract

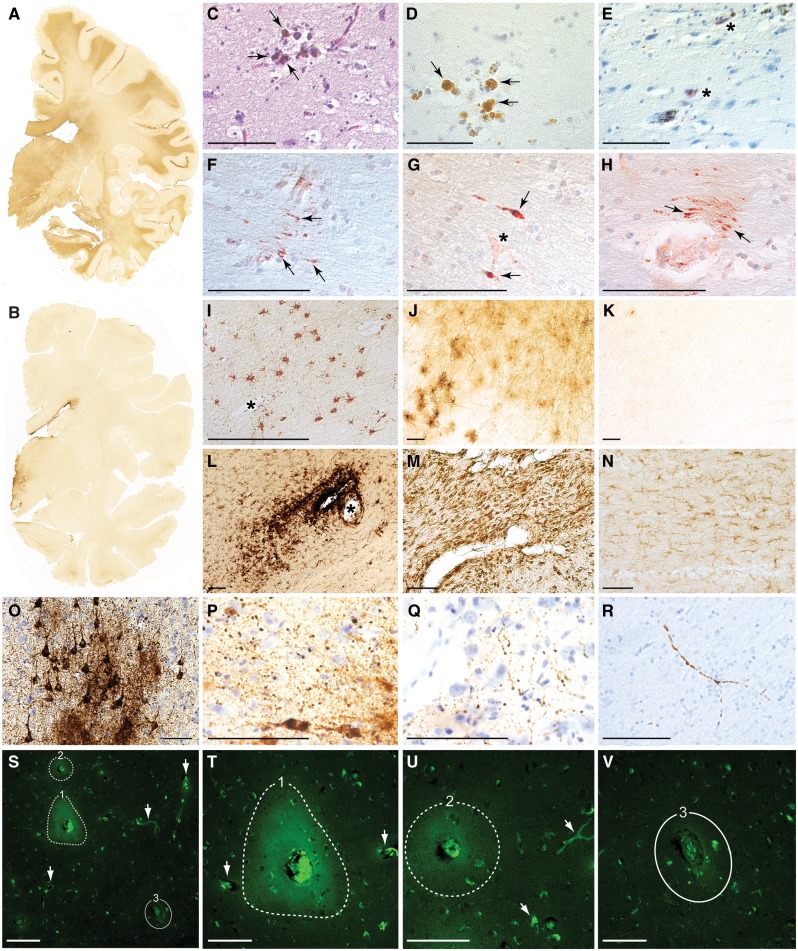
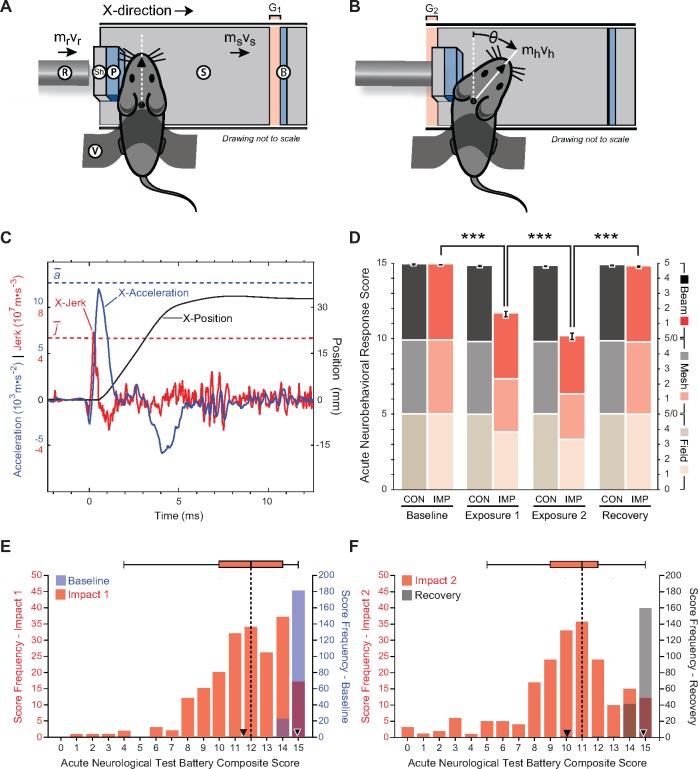
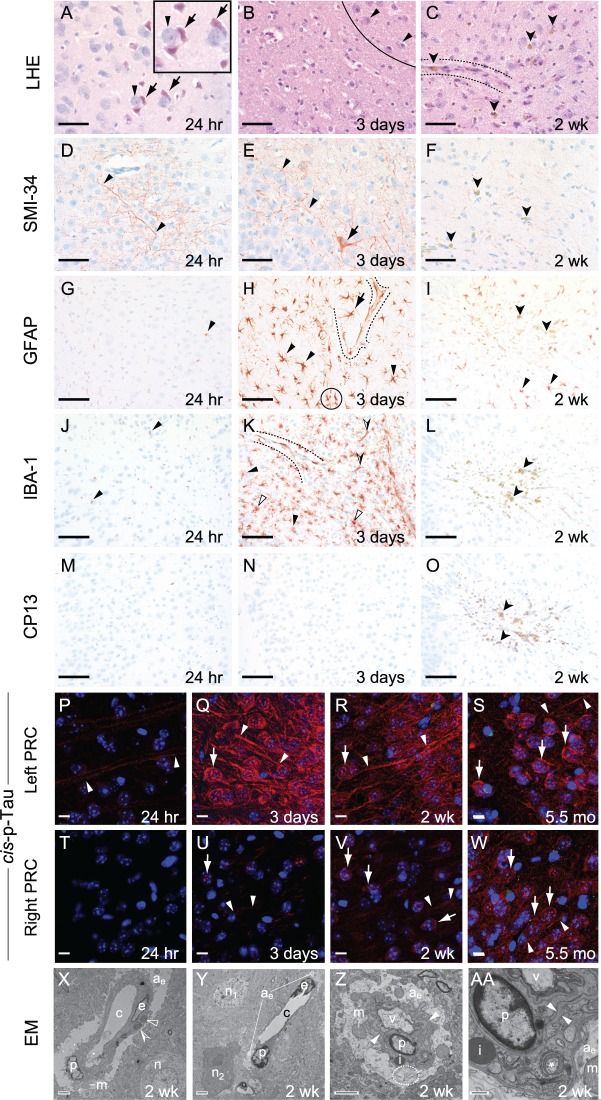
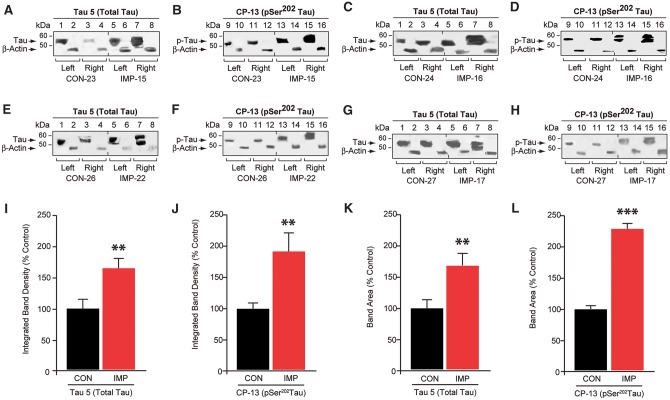
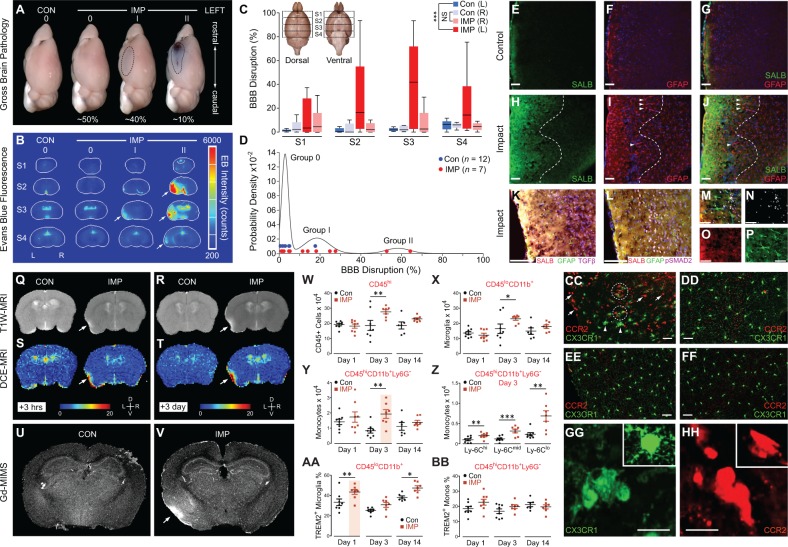
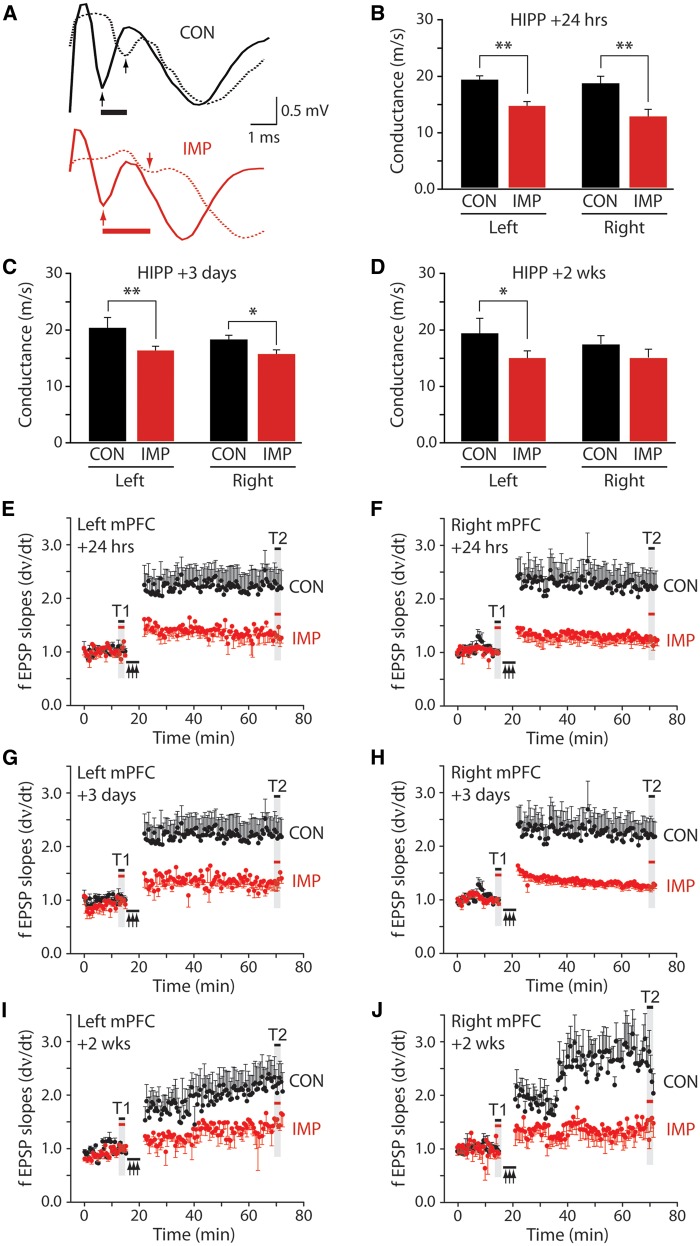
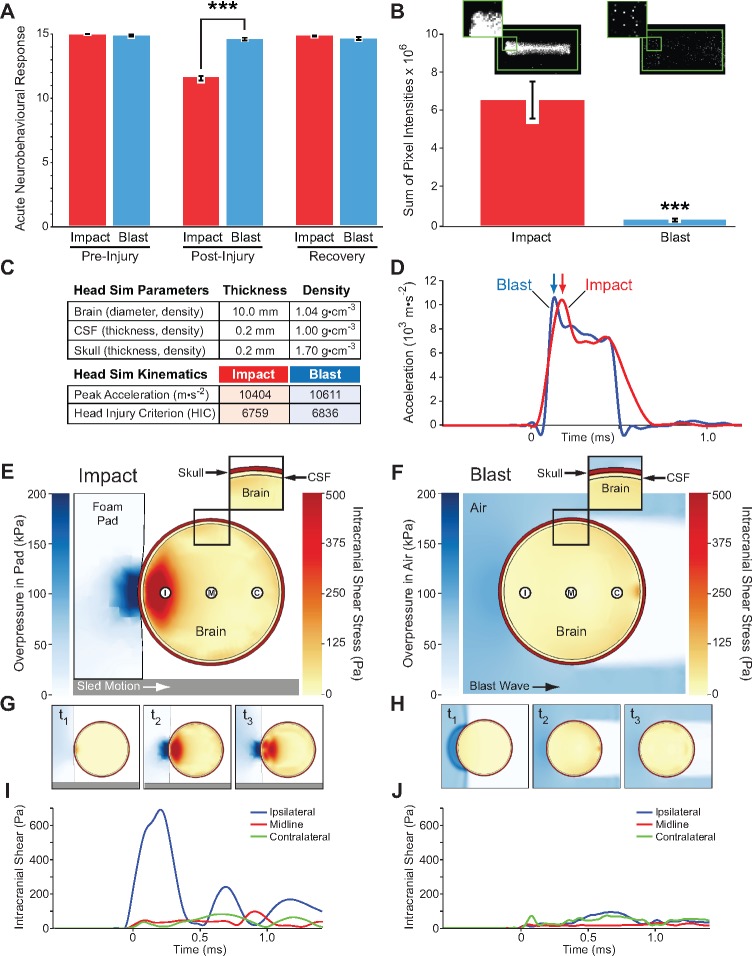
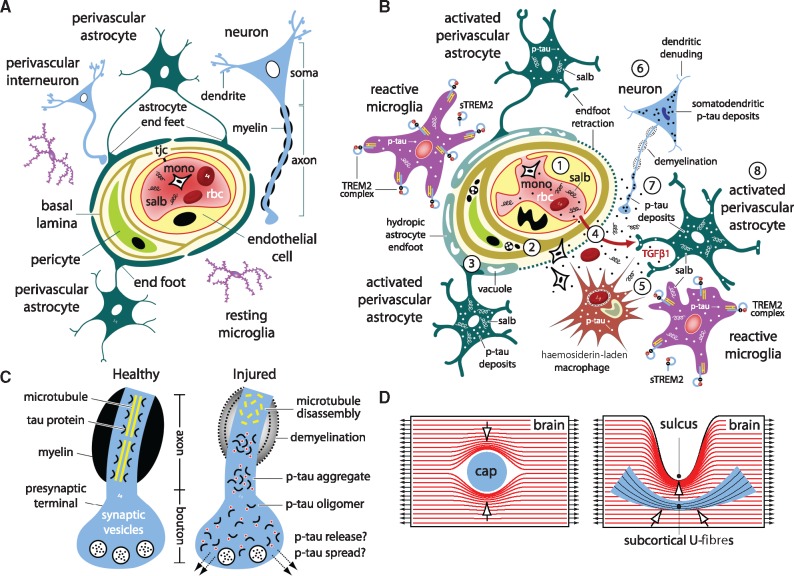
The mechanisms underpinning concussion, traumatic brain injury, and chronic traumatic encephalopathy, and the relationships between these disorders, are poorly understood. We examined post-mortem brains from teenage athletes in the acute-subacute period after mild closed-head impact injury and found astrocytosis, myelinated axonopathy, microvascular injury, perivascular neuroinflammation, and phosphorylated tau protein pathology. To investigate causal mechanisms, we developed a mouse model of lateral closed-head impact injury that uses momentum transfer to induce traumatic head acceleration. Unanaesthetized mice subjected to unilateral impact exhibited abrupt onset, transient course, and rapid resolution of a concussion-like syndrome characterized by altered arousal, contralateral hemiparesis, truncal ataxia, locomotor and balance impairments, and neurobehavioural deficits. Experimental impact injury was associated with axonopathy, blood-brain barrier disruption, astrocytosis, microgliosis (with activation of triggering receptor expressed on myeloid cells, TREM2), monocyte infiltration, and phosphorylated tauopathy in cerebral cortex ipsilateral and subjacent to impact. Phosphorylated tauopathy was detected in ipsilateral axons by 24 h, bilateral axons and soma by 2 weeks, and distant cortex bilaterally at 5.5 months post-injury. Impact pathologies co-localized with serum albumin extravasation in the brain that was diagnostically detectable in living mice by dynamic contrast-enhanced MRI. These pathologies were also accompanied by early, persistent, and bilateral impairment in axonal conduction velocity in the hippocampus and defective long-term potentiation of synaptic neurotransmission in the medial prefrontal cortex, brain regions distant from acute brain injury. Surprisingly, acute neurobehavioural deficits at the time of injury did not correlate with blood-brain barrier disruption, microgliosis, neuroinflammation, phosphorylated tauopathy, or electrophysiological dysfunction. Furthermore, concussion-like deficits were observed after impact injury, but not after blast exposure under experimental conditions matched for head kinematics. Computational modelling showed that impact injury generated focal point loading on the head and seven-fold greater peak shear stress in the brain compared to blast exposure. Moreover, intracerebral shear stress peaked before onset of gross head motion. By comparison, blast induced distributed force loading on the head and diffuse, lower magnitude shear stress in the brain. We conclude that force loading mechanics at the time of injury shape acute neurobehavioural responses, structural brain damage, and neuropathological sequelae triggered by neurotrauma. These results indicate that closed-head impact injuries, independent of concussive signs, can induce traumatic brain injury as well as early pathologies and functional sequelae associated with chronic traumatic encephalopathy. These results also shed light on the origins of concussion and relationship to traumatic brain injury and its aftermath.awx350media15713427811001.

Keywords: TREM2; chronic traumatic encephalopathy; concussion; tau protein; traumatic brain injury.


Figures

Figure 1
Figure 1
Post-mortem pathologies in brains from teenage athletes in the acute-subacute period after mild closed-head impact injury. (A) Coronal brain section immunostained for the astrocytic marker glial fibrillary acid protein (GFAP) in Case 3, a 17-year-old male high school American football player who died by suicide 2 days after a closed-head impact injury. Widespread GFAP immunoreactivity (brown staining) indicative of reactive astrocytosis was diffusely present in white matter fibre tracts throughout the brain. Representative whole-mount brain section, 50 µm thickness. (B) Coronal brain section immunostained for GFAP in control Case 8, a 22-year-old male former high school American football player without history of recent head injury who died by suicide. GFAP immunoreactivity is restricted to the periventricular area and diencephalon. Representative whole-mount brain section, 50 µm thickness. (C and D) Haemosiderin-laden macrophages (arrows) surrounding a small blood vessel consistent with prior microhaemorrhage in Case 1, an 18-year-old male high school American football player who died by suicide 4 months after a closed-head impact injury. Representative Luxol fast blue haematoxylin and eosin (C) and haematoxylin (D) staining, 10 µm paraffin sections. Scale bars = 100 µm. (E) Case 1, microhaemorrhage surrounded by neurites immunoreactive for phosphorylated tau protein (asterisks) detected by monoclonal antibody AT8 directed against hyperphosphorylated tau protein (pSer202, pThr205) with haematoxylin counterstain, 10 µm paraffin section. Scale bar = 100 µm. (F–H) Perivascular anti-amyloid precursor protein (APP)-immunoreactive axonal swellings (arrows) in the corpus callosum from Case 3. Representative APP immunostaining with haematoxylin counterstain, 10 µm paraffin sections. Asterisk in G marks a small blood vessel. Scale bars = 100 µm. (I and J) Perivascular astrocytosis in white matter from Case 3. Representative GFAP immunostaining with haematoxylin counterstain, 10 µm paraffin section (I) and 50 µm free-floating section (J). Asterisk in I marks a small blood vessel. Scale bars = 100 µm. (K) Minimal GFAP-immunoreactive astrocytosis in the white matter from control Case 8. Representative GFAP immunostaining, 50 µm free-floating section. Scale bar = 100 µm. (L) Perivascular clusters of activated microglia around a small blood vessel in the subcortical white matter from Case 4, a 17-year-old male high school American football player who sustained three closed-head impact injuries 26 days, 6 days, and 1 day before death. Representative LN3 immunostaining directed against human leukocyte antigen DR-II (HLA-DR II), 50 µm free-floating section. Asterisk indicates small blood vessel. Scale bar = 100 µm. (M) Microgliosis in brainstem white matter in Case 1. Representative LN3 immunostaining, 50 µm free-floating section. Scale bar = 100 µm. (N) Few activated microglia in brainstem white matter in control Case 8. Representative LN3 immunostaining, 50 µm free-floating section. Scale bar = 100 µm. (O) Phosphorylated tau protein-containing neurofibrillary tangles, pretangles, and neurites in the sulcal depths of the cerebral cortex consistent with neuropathological diagnosis of early-stage CTE in Case 4. Representative CP13 immunostaining directed against hyperphosphorylated tau protein (pSer202), 50 µm free-floating section. Scale bar = 100 µm. (P and Q) Perivascular dot-like neurites immunoreactive for CP13-immunoreactive phosphorylated tau protein in frontal cortex sulcal depths consistent with early-stage CTE in Case 4. Representative CP13 immunostaining, 50 µm free-floating section. Scale bar = 100 µm. (R) Dystrophic axons immunoreactive for CP13-immunoreactive phosphorylated tau protein in frontal cortex white matter in Case 4. Representative CP13 immunostaining, 50 µm free-floating section. Scale bar = 100 µm. (S) Persistent vascular leakage in Case 1 demonstrated by anti-IgG immohistofluorescence in the brain parenchyma surrounding two blood vessels (dashed lines, 1 and 2) in the dorsolateral frontal cortex. These findings are consistent with focal blood–brain barrier disruption. Another blood vessel of similar calibre in the same field (denoted by solid line, number 3) does not exhibit evidence of blood–brain barrier disruption, consistent with the high degree of focality. Other smaller blood vessels (white arrows) are also devoid of perivascular IgG immunoreactivity, thereby confirming specificity of the microvascular pathology. Scale bar = 200 µm. (T) High magnification photomicrograph of the same field in Case 1 showing perivascular IgG immunoreactivity in the brain parenchyma surrounding blood vessel 1 (dashed line, 1). The intensely immunoreactive material in the centre of the lesion is residual blood in the vessel lumen. Two nearby blood vessels (arrows) do not show evidence of blood–brain barrier disruption. Scale bar = 100 µm. (U) High magnification photomicrograph of the same field in Case 1 showing perivascular IgG immunoreactivity in the brain parenchyma surrounding blood vessel 2 (dashed line, 2). Scale bar = 100 µm. (V) High magnification photomicrograph of the same field in Case 1 showing the absence of perivascular IgG immunoreactivity in the brain parenchyma surrounding blood vessel 3 (solid line, 3). Scale bar = 100 µm.
Figure 2
Figure 2
Experimental closed-head impact injury in awake, unanaesthetized (anaesthesia-naïve) mice induces abrupt onset, transient course, and rapid resolution of neurobehavioural impairments that resemble human concussion. (A and B) Schematic of momentum transfer instrument before (A) and after (B) experimental closed-head impact injury. The developed instrument was designed for use with unanaesthetized C57BL/6 mice and is compatible with 100% survival without evidence of skull fracture; subdural, epidural, or subarachnoid haemorrhage; cervical trauma or spinal cord injury; commotio cordis or retinae; or post-traumatic apnoea. Animal subjects are secured across the thorax and positioned prone such that the head is in physical contact with a helmet analogue composed of an inner foam pad (P) and an outer hard shell (Sh) fixed to a mobile sled (S). Sled movement is constrained to linear translation by a low-friction monorail track (not shown). Sled motion is initiated by an operator-triggered computer program that actuates a solenoid valve, releases a bolus of pressurized gas, and accelerates a stainless-steel slug within the instrument barrel. Vent holes in the barrel convert slug motion to constant velocity. Sequential momentum transfer from the slug to a captive stainless-steel rod (R; known mass, mr, empirically-determined velocity, vr) and finally to the sled (S; known mass, ms, empirically-determined velocity, vs). Sled motion results in closure of the distal gap (G1), opening of the proximal gap (G2), and termination by the backstop (B). A detailed schematic of the developed instrument is shown in Supplementary Fig. 1A. (C) Head motion analysis (time-history plot) during experimental closed-head impact injury reconstructed from high-speed videographic records (100 000 fps; 100 kHz). Head position, acceleration, and jerk are plotted as a function of time after initiation of head motion (t = 0). Maximal head acceleration and jerk are observed within the first millisecond after impact. Experimental parameters were selected to kinematically match head motion in our blast neurotrauma mouse model (Supplementary Table 2). Blue dashed line, mean peak X-acceleration (n = 18 mice). Red dashed line, mean peak X-jerk (n = 18 mice). (D) Composite and subtest scores on the acute neurobehavioural response test battery (Supplementary Fig. 1B) assessed in awake unanaesthetized (anaesthesia-naïve) mice: (i) at pre-injury (baseline test); (ii) at 2 min after experimental closed-head impact injury (IMP) or exposure to the sham (no injury) control condition (CON) (post-injury test); and (iii) after a 3-h rest period (recovery test). Mice subjected to experimental impact injury showed significant decrements in composite scores and all three sub-test scores (open-field, inverted wire mesh, beam walk). IMP, n = 203 mice. CON; n = 117. Values represent means ± SEM. ***P < 0.001. Transient neurobehavioural impairments spanned multiple functional domains (including arousal, responsivity to environmental stimuli, locomotion, exploration, motor performance, habituation) that recapitulate features of concussion in humans (Supplementary Video 1). (E) Histogram and box-and-whiskers plot for population frequency distribution of composite scores on the acute neurobehavioural response test battery at baseline (pre-impact) and after first impact in awake (anaesthesia-naïve) mice exposed to experimental closed-head injury (n = 203). Baseline test: median score, 15; mean ± SEM, 14.9 ± 0.0 (white-bordered black inverted triangle). Impact 1 test: median score, 12; mean ± SEM, 11.6 ± 0.2 (black inverted triangle). (F) Histogram and box-and-whiskers plot for population (n = 203) frequency distribution of composite scores on the acute neurobehavioural response test battery after second impact and 3-h recovery. Impact 2 test: median score, 11; mean, 10.1 ± 0.2 (black inverted triangle). Recovery test: median score, 15; mean, 14.8 ± 0.0 (white-bordered black inverted triangle).
Figure 3
Figure 3
Experimental closed-head injury induces early and progressive brain pathologies associated with CTE in cerebral cortex ipsilateral and subjacent to impact. (A–C) Luxol fast blue haematoxylin and eosin (LHE) staining in ipsilateral (left) perirhinal cortex 24 h (A), 3 days (B), 2 weeks (C) post-injury. (A) LHE staining at 24 h post-injury revealed dying neurons (arrows) with pyknotic basophilic nuclei and intensely eosinophilic cytoplasm interspersed with normal-appearing neurons (arrowheads). Black box, magnified view showing neuronal necrosis. Scale bar = 100 μm. (B) Decreased neuronal density (below line) indicative of neuronal demise, ipsilateral (left) perirhinal cortex 3 days post-injury. Normal-appearing neurons (arrowheads, above line). Scale bar = 100 μm. (C) Decreased neuronal density (below line) indicative of neuronal demise and gliosis near a small blood vessel (between dashed lines). Clusters of haemosiderin-laden macrophage (darts) represent microhaemorrhage residua. Scale bar = 100 μm. Contralateral (right) perirhinal cortex was histopathologically normal by LHE staining (Supplementary Fig. 2A–C). (D–F) Immunostaining with monoclonal antibody SMI-34 (phosphorylated neurofilament) in ipsilateral (left) perirhinal cortex 24 h (D), 3 days (E), 2 weeks (F) post-injury. (D and E) SMI-34 immunostaining revealed neurons with swollen, beaded neuronal processes (arrowheads) and cytoplasmic immunoreactivity (arrow, E). Scale bars = 100 μm. (F) Haemosiderin-laden macrophages (darts), but not SMI-34 immunoreactivity, were observed in the ipsilateral (left) perirhinal cortex 2 weeks post-injury. Scale bar = 100 μm. Contralateral (right) perirhinal cortex was histopathologically normal by SMI-34 immunostaining (Supplementary Fig. 2D–F). (G–I) Immunostaining for astrocytic glial fibrillary acidic protein (GFAP) in ipsilateral (left) perirhinal cortex 24 h (D), 3 days (E), 2 weeks (F) post-injury. (G) Sparse GFAP-immunoreactivity (arrowhead) was present 24 h post-injury. Scale bar = 50 μm. (H) Brisk reactive astrocytosis at 3 days post-injury. Clusters of hypertrophied GFAP-immunopositive reactive astrocytes (arrowheads) with ramified processes and perivascular astrocytes (arrow) with hydropic end-feet terminating on small blood vessels (dashed lines) were present 3 days post-injury. Overlapping astrocytic processes (black circle) indicate disruption of domain restriction. Scale bars = 50 μm. (I) Reactive astrocytes (arrowheads) were present 2 weeks post-injury. Haemosiderin-laden macrophages (darts), representing microhaemorrhage residua, were scattered throughout the affected region. Scale bar = 50 μm. Contralateral (right) perirhinal cortex was histopathologically normal by GFAP immunostaining (Supplementary Fig. 2G–I). (J–L) Immunostaining for the myeloid cell marker Iba1 (arrowheads) in ipsilateral (left) perirhinal cortex revealed minimal microgliosis at 24 h (J), brisk microgliosis at 3 days (K), resolved microgliosis at 2 weeks (L) post-injury. Scale bars = 50 μm. (K) Peak microgliosis at 3 days post-injury revealed clusters of intensely Iba1-immunoreactive, ramified myeloid cells (arrowheads) and less abundant amoeboid and rodlike Iba1-immunoreactive microglia (open and half-filled arrowheads, respectively). Iba1-immunoreactive perivascular myeloid cells were associated with the parenchymal (abluminal) surface of a small blood vessel (between dashed lines). Scale bar = 50 μm. (L) Microgliosis was largely resolved by 2 weeks post-injury. Haemosiderin-laden macrophage (darts) were observed throughout the affected region. Scale bar = 50 μm. Contralateral (right) perirhinal cortex was histopathologically normal by Iba1 immunostaining (Supplementary Fig. 2J–L). (M–O) Phosphorylated tau protein immunostaining with monoclonal antibody CP13 (pS202) was negative throughout the brain at 24 h (M), 3 days (N), and 2 weeks (O) post-injury. Haemosiderin-laden macrophage (darts) were observed throughout the affected region by 2 weeks post-injury (O). Scale bars = 50 μm. The contralateral (right) perirhinal cortex did not demonstrate CP13 immunostaining (Supplementary Fig. 2M–O). (P–W) Immunohistofluorescence staining for cis-p-tau (cis-motif, pThr231-Pro), a highly pathogenic early phosphorylated tau proteoform, was present at 24 h (P), 3 days (Q), 2 weeks (R), and 5.5 months (S) post-injury in ipsilateral (left) perirhinal cortex. Faint cis-p-tau immunoreactivity was observed in axons (arrowheads) in the ipsilateral (left, P) but not contralateral (right, T) perirhinal cortex 24 h post-injury. By 3 days post-injury, cis-p-tau immunoreactivity in the ipsilateral perirhinal cortex (Q) was intense, not only in axons (arrowheads), but also as dot-like inclusions in neuronal soma and dendrites (arrow). Cis-p-tau immunoreactivity in the contralateral perirhinal cortex (U) was present but faint at this time point. By 2 weeks post-injury, cis-p-tau immunoreactivity was observed in axons (arrowheads) and as dot-like inclusions in neuronal soma and dendrites (arrow) in both hemispheres. Cis-p-tau immunoreactivity was more pronounced in the ipsilateral (left, R) than contralateral (right, V) perirhinal cortex. Surprisingly, we detected cis-p-tau immunoreactivity 5.5 months post-injury (the longest time point measured) in axons (arrowheads) and as dot-like inclusions in neuronal soma and dendrites (arrow) in perirhinal cortex of both hemispheres (left, S; right, W). Scale bars = 20 µm. Sham (no-injury) control mice did not show evidence of cis-p-tau immunoreactivity in either hemisphere at any of the analysed time points (Supplementary Fig. 2P–W). (X–AA) Ultrastructural evidence of persistent traumatic microvascular injury revealed by electron microscopy 2 weeks post-injury. (X) Low-power electron micrograph of CA1 region of the left hippocampus shows abnormal capillary (c) and nearby neuron (n). A capillary endothelial cell (e) and adjacent pericyte (p) are encircled by hydropic astrocytic end-feet (ae). Perivascular astrocyte processes exhibit pale oedematous cytoplasm with few mitochondria (m), subcellular organelles, or cytoskeletal elements. The capillary basal lamina is thickened, highly branched, and tortuous. Electron-dense inclusion bodies (open arrowheads) and lipofuscin granules with lipid droplets (partially-filled arrowhead) are evident. These ultrastructural pathologies are inconsistent with processing artefact. Magnification ×1500. Scale bar = 2 µm. (Y) Low-power electron micrograph of left medial prefrontal cortex 2 weeks after injury shows an abnormal capillary (c) and two nearby neurons, one with normal ultrastructure (n1) and the other undergoing cellular involution (n2). Endothelial cell (e), perivascular pericyte (p), and hydropic astrocytic end-feet (ae) are present. Magnification ×1200. Scale bar = 2 µm. (Z) Electron micrograph of the CA1 region of the left hippocampus shows a hydropic astrocytic end-foot (ae) and pericyte (p) of an involuting capillary. The basal laminae are thickened and tortuous (arrowheads). Electron-dense inclusion body (i), swollen mitochondria (m), and autophagosomic vacuoles (v, dashed ellipse) are present. Magnification ×3000. Scale bar = 2 µm. (AA) High magnification electron micrograph of the same CA1 region of the left hippocampus showing ultrastructural details of the hydropic astrocytic end-foot (ae) and pericyte (p). Thickened, tortuous basal lamina (arrowheads), inclusion body (i), swollen mitochondrion (m), and degenerating mitochondrion (asterisk) are present. Magnification ×10 000. Scale bar = 500 nm. n = 4 mice per group.
Figure 4
Figure 4
Unilateral closed-head impact injury induces persistent bilateral phosphorylated tau proteinopathy in awake, anaesthesia-naïve mice. (A–H) Phosphorylated tau protein immunoblot analysis of brain homogenates from left and right hemispheres from mice exposed to experimental left-lateral closed-head impact injury (IMP) or sham (no injury) control exposure (CON) probed for total tau protein (Tau 5; A, C, E and G), phosphorylated tau protein (CP-13, pSer202; B, D, F and H), and β-actin (A–H) 2 weeks after CON (lanes 1–4, 9–12) or IMP (lanes 5–8, 13–16) exposure. Immunoblot analysis revealed a broad band of CP-13-immunoreactive phosphorylated tau protein that migrated with an apparent molecular mass of 53 kD (arrows). (I–L) Densitometric quantitation of total tau protein (I and K) and CP-13 phosphorylated tau protein (J and L) in brain homogenates from mice 2 weeks after IMP or CON exposure. n = 8 mice per group, mean values ± SEM in arbitrary densitometric units (a.u.) normalized to control values. ***P < 0.001, **P < 0.01 (unpaired two-tailed Student’s t-test).
Figure 5
Figure 5
Unilateral, closed-head impact injury induces focal blood–brain barrier disruption, serum albumin extravasation, astrocytosis, myeloid inflammatory cell infiltration, and TREM2+ microglial activation in cerebral cortex ipsilateral and subjacent to impact. (A) Gross pathology in representative brains from a control mouse (CON) exposed to sham (no injury) control condition compared to brains from mice subjected to experimental closed-head impact injury (IMP) with varying degrees of gross brain pathology (Grade 0, I, II, respectively) 24 h post-injury. Grade 0: absence of gross brain pathology with no evidence of macroscopic tissue damage (contusion, necrosis, hematoma, haemorrhage, or extravasated Evans blue) was observed in 100% of brains from CON mice and ∼50% of brains from IMP mice. Grade I: minimal brain pathology marked only by focal Evans blue extravasation (indicative of disruption of the blood–brain barrier, BBB) was observed in ∼40% of IMP mice but none (0%) of the CON mice. Grade II: relatively rare brains marked by complex lesions that included Evans blue extravasation and contusion observed in ˜10% of IMP mice but none (0%) in CON mice. (B) Evans blue-specific fluorescence imaging of representative mouse brain sections showing blood–brain barrier disruption 24 h post-injury. Arrows, left-lateral fluorescence signal indicating area of blood–brain barrier disruption (in Evans blue-specific fluorescence intensity counts) in cerebral cortex ipsilateral and subjacent to experimental impact injury (IMP) but not sham (no-injury) control condition (CON). Serial brain sections (anterior to caudal, S1–S4, respectively) and gross pathology injury grade (0, I, II) as indicated. (C) Quantitative analysis of blood–brain barrier disruption by coronal section Evans blue-specific fluorescence brain imaging 24 h after IMP or CON exposure. Blood–brain barrier disruption localized to the perirhinal, insular, entorhinal, and piriform cortices and basolateral amygdala of the left hemisphere ipsilateral and subjacent to the impact contact zone. Inset: rostral-to-caudal brain sections, S1–S4. ***P < 0.001; NS = not statistically different. (D) Gaussian mixed model analysis of Evans blue fluorescence brain imaging yielded three groups that corresponded to gross pathology classification (Grades 0, I, II). (E–J) Anatomical localization of extravasated serum albumin (SALB; E, G, H and J) and co-localizing reactive astrocytosis (GFAP; F, G, I and J) in left perirhinal cortex ipsilateral to impact 3 days post-injury (H–J) but not in corresponding cortex from CON mice (E–G). DAPI (blue channel: F, G, I and J), cell nuclei. Hashed lines (H–J) demarcate cortical region with maximal post-injury serum albumin extravasation (H and J) and co-localization with reactive astrocytosis (I and J). Arrowheads, GFAP-immunopositive processes of activated astrocytes. Scale bars = 100 µm. (K–P) Left perirhinal cortex at peak of reactive astrocytosis 3 days post-injury. Composite fluorescence microscopic images showing co-localization of extravasated serum albumin (SALB, red: K, L, M and O) with reactive astrocytosis (GFAP, green: K, L, M and P); TGFβ expression (TGFβ, violet: K) and phosphorylated-SMAD2, a marker downstream of TGF-β signalling (pSMAD2, violet: L, M and N). Cell nuclei (DAPI, blue: K, L and M). Yellow-white areas indicate overlapping SALB and GFAP immunoreactivity (K, L and M). High magnification (×40) composite fluorescence image (M) and fluorescence channels (N, pSMAD2; O, SALB; P, GFAP). Magnification: K and L = ×20; M–P = ×40. Scale bars in K and L = 100 µm; M–P = 50 µm. Serum albumin extravasation, GFAP-immunoreactive astrocytosis, and pSMAD2-TGFβ upregulation were not observed in the contralateral perirhinal cortex of IMP mice nor in perirhinal cortex of either hemisphere in CON mice (Supplementary Fig. 4A–F). (Q–V) Focal blood–brain barrier disruption and co-localizing serum albumin extravasation detected in the brains of living mice by dynamic contrast-enhanced MRI (DCE-MRI) neuroimaging with gadofosveset trisodium, an FDA-approved gadolinium-based contrast agent that binds serum albumin. High-field (11.7 T) T1-weighted MRI (Q and R) and DCE-MRI (S and T) with systemically administered gadofosveset trisodium. T1-weighted MRI and DCE-MRI were conducted 3 h (Q, T1-weighted MRI (T1W-MRI); S, DCE-MRI) and 3 days (R, T1-weighted MRI; T, DCE-MRI) after IMP or CON exposure. T1-weighted hyperintensity (Q and R) co-localized with blood–brain barrier permeability defect detected by DCE-MRI (S and T) in the left perirhinal cortex (arrows) 3 h and 3 days after IMP but not CON exposure. Non-specific signal was observed in the ventricles and sagittal sinus. D = dorsal, V = ventral; L = left, R = right. (U and V) Confirmation of serum albumin extravasation indicating blood–brain barrier disruption by gadolinium metallomic imaging mass spectrometry (Gd-MIMS) in perfused post-mortem brains from the same mice imaged by T1-weighted MRI (Q and R) and DCE-MRI (S and T). Enhanced gadolinium accumulation was observed in the left lateral perirhinal and piriform cortices (arrow) 2 weeks after IMP (V) but not CON (U) exposure. Gadolinium accumulation detected by Gd-MIMS co-localized with T1-weighted hyperintensity and blood–brain barrier permeability defect detected by DCE-MRI, thus confirming intracerebral blood–brain barrier disruption. (W–BB) Flow cytometry analysis showed that IMP triggers increased number of CD45+ inflammatory cells and activation of TREM2+ microglia in the brain post-injury. CD45+ inflammatory cells (W) and CD45loCD11b+ microglia (X) were significantly increased 3 days after IMP compared to CON exposure. (Y) CD45hiCD11b+Ly6G inflammatory cells accumulated in the brain 3 days after IMP compared to CON exposure. (Z) All three major subpopulations (Ly-6Chi, Ly-6Cmid, Ly-6Clo) were represented in CD45hiCD11b+Ly6G inflammatory cells detected 3 days post-injury. (AA and BB) Upregulation of TREM2 expression in microglia (AA) but not CD45+ inflammatory cells (BB) at 1 and 14 days after IMP compared to CON exposure. For flow cytometry experiments, n = 6–8 mice per group per time point. ***P < 0.001; **P < 0.01; *P < 0.05. See Supplementary Fig. 4G–I for flow cytometry population dot plots. (CC–HH) Brain accumulation of Ccr2RFP-expressing inflammatory cells (red-labelled cells) and activation of brain-resident Cx3cr1GFP-expressing microglia (green-labelled cells) were confirmed by fluorescence microscopy in perirhinal cortex ipsilateral and subjacent to experimental impact injury in Ccr2RFP/Cx3cr1GFP mice at 3 days post-injury (IMP: CC, DD, GG and HH) or control (CON: EE and FF). Representative fluorescence microscopy images show red-labelled Ccr2RFP-expressing inflammatory cells (arrows, CC) throughout the ipsilateral (left) perirhinal and adjacent cortex, basolateral amygdala, and overlying dura and leptomeninges (CC and HH) 3 days post-injury. The affected cortex was also notable for large numbers of ameboid Cx3cr1GFP-expressing microglia (arrowheads; CC and GG) that were also present, but to a lesser degree, in the contralateral (right) hemisphere (DD). Note clustering of Ccr2RFP-expressing inflammatory cells and Cx3cr1GFP-expressing microglia in the left perirhinal cortex (dashed circles, CC), the primary locus of post-traumatic brain pathology ipsilateral and subjacent to the impact. By contrast, Ccr2RFP-expressing inflammatory cells were minimally present and amoeboid Cx3cr1GFP-expressing microglia were absent in brains from Ccr2RFP/Cx3cr1GFP mice 3 days after CON exposure (EE and FF). Bars (CCFF), 40 microns; (GG, HH), 20 microns.
Figure 6
Figure 6
Unilateral closed-head impact injury induces early, persistent, bilateral impairments in hippocampal axonal conduction velocity and medial prefrontal cortical long-term potentiation of synaptic neurotransmission. (A–D) Time course of impaired axonal conduction velocity in the hippocampus (HIPP) CA1 subregion of mice exposed to unilateral (left-sided) closed-head impact injury (IMP, red) or sham (no injury) control (CON, black). Time points: 24 h, 3 days, 2 weeks post-exposure. Experimental testing arrangement in relation to neuroanatomy and circuitry is shown in Supplementary Fig. 5A. (A) Representative stimulus-evoked compound action potentials at proximal (solid lines) and distal (dashed lines) recording sites in the CA1 subregion of hippocampus slices obtained from mice exposed to unilateral impact (IMP, red) versus sham (no-injury) control mice (CON, black). Arrows indicate peak negativities used to calculate conduction velocity. (B) Conduction velocity measurements from first peak compound action potential delay as a function of distance between recording electrodes in CA1 pyramidal cell axons in the stratum alveus of hippocampus slices from mice subjected to unilateral left-sided IMP (red bars: left, n = 9, right n = 10) compared to CON (black bars: left, n = 10; right, n = 7) 24 h post-exposure. Each bar is mean axonal conduction velocity ± SEM of n slices. **P < 0.01. (C) Conduction velocity measurements in CA1 pyramidal cell axons in stratum alveus of hippocampus slices from mice subjected to unilateral left-sided IMP (red bars: left, n = 14; right, n = 16) compared to CON (black bars: left n = 7; right, n = 9) 3 days post-exposure. **P < 0.01; *P < 0.05. (D) Axonal conduction velocity measurements in CA1 pyramidal cell axons in the stratum alveus of hippocampus slices from mice subjected to unilateral IMP (red bars: left, n = 16; right, n = 12) compared to CON (black bars; left, n = 7; right, n = 8) 2 weeks post-exposure. *P < 0.05. (E–J) Impaired theta burst-evoked long-term potentiation (LTP) of mixed excitatory inputs to the medial prefrontal cortex (mPFC) in slices from mice after unilateral (left-sided) closed-head impact injury (IMP, filled red circle) compared to sham (no injury) control condition (CON, filled black circle). LTP calculated as ratio of field excitatory postsynaptic potential (fEPSP) slope at time points T1/T2 (vertical grey bands). Theta burst high-frequency stimulation, arrows. Each point is mean ± SEM of fEPSP slope in N slices. (E) Time course of LTP in left (ipsilateral) mPFC from mice 24 h after exposure to left-lateral IMP (filled red circle, n = 7) or CON (filled black circle, n = 7). (F) Time course of LTP in right (contralateral) mPFC from mice 24 h after exposure to left-lateral IMP (filled red circle, n = 8) or CON (filled black circles, n = 6). (G) Time course of LTP in left (ipsilateral) mPFC from mice 3 days after exposure to left-lateral IMP (filled red circles, n = 11) or CON (filled black circles, n = 8). (H) Time course of LTP in right (contralateral) mPFC from mice 3 day after exposure to left-lateral IMP (filled red circles, n = 10) or CON (filled black circles, n = 8). (I) Time course of LTP in left (ipsilateral) mPFC from mice 2 weeks day after exposure to left-lateral IMP (filled red circles, n = 9) or CON (filled black circles, n = 6). (J) Time course of LTP in right (contralateral) mPFC from mice 2 weeks day after exposure to left-lateral IMP (filled red circles, n = 10) or CON (filled black circles, n = 6). White matter-evoked synaptic field potential input-output relations were not affected by experimental impact injury (Supplementary Fig. 5D).
Figure 7
Figure 7
Differential force loading on the head and ipsilateral shear stress in the brain differentiate the presence or absence of acute concussion-like neurobehavioural deficits after unilateral closed-head impact injury or blast exposure. (A) Mean composite scores on the acute neurobehavioural response test battery in awake, unanaesthetized (anaesthesia-naïve) mice 2 min after unilateral closed-head impact injury (red bars; n = 203) or blast exposure (blue bars; n = 24) under experimental conditions matched for comparable head kinematics (Supplementary Table 2). Unilateral closed-head impact triggered abrupt onset of transient neurobehavioural deficits (Supplementary Video 1). Impact-induced decrements in mean test battery composite scores recovered to baseline when tested after 3-h recovery period. By contrast, blast exposure under conditions that produce comparable head motion did not induce decrements in mean composite scores on the post-exposure test battery. Mean composite scores ± SEM. ***P < 0.001, linear mixed-effects regression analysis. (B) Evaluation of force loading regimes during impact injury (red bar) compared to blast exposure (blue bar) at the surface of a mouse headform. Experimental conditions were identical to those utilized in the live animal experiments. Representative images of pressure-sensitive film strips (black boxes, above) after exposure to impact (left) or blast (right) with corresponding pixel intensity histograms (below). Large green boxes indicate pressure signal summation areas. Inset boxes show magnified view of the summation area and reveal differences in the spatial distribution of the pressure signals. Mean sum of pixel values ± SEM in arbitrary units (a.u.). ***P < 0.001, one-tailed Student’s t-test. (C) Material densities and head geometry used in the computational simulation analyses and resulting kinematics. (D) Computational simulations showing comparable head kinematics and peak acceleration at the centre of the brain in the impact and blast simulation models. Arrows, corresponding peak head x-acceleration for impact (red) and blast (blue) models. Kinematic results for the models were statistically indistinguishable. The small initial negative deflection on the blast simulation is a filtering artefact. (E and F) Simulation results showing intracranial shear (von Mises) stress and extracranial overpressure during impact (E, slice of three-dimensional simulation) and blast (F, slice of two-dimensional simulation) exposure at peak head x-acceleration time points indicated by arrows in D. Computed extracranial overpressure measurements at peak head acceleration are shown calibrated to scale (light-dark blue scale; kPa) for the foam padding (impact model) and ambient air (blast model). Computed shear (von Mises) stresses in the skull, CSF, and brain parenchyma at peak head x-acceleration are shown calibrated to scale (yellow–red scale; Pa) for both simulation models. Intracranial Lagrangian tracers: C = contralateral with respect to impact or blast contact surface on the head; I = ipsilateral; M = midline. Insets: relationship of intracranial compartments in the mouse head simulation models. (G and H) Representative time sequence frames (t1: contact, t2: peak head x-acceleration, t3: 150 µs after peak head x-acceleration) for intracranial shear (von Mises) stress and extracranial overpressure (padding, ambient air) in the impact (G) and blast (H) simulations. Impact induces focal point loading on the head and 7-fold greater magnitude shear stress in the brain that localizes to (and persists in) a discrete region of brain ipsilateral and subjacent to the impact contact zone. Sustained asymmetric shear stress in the simulation recapitulates the ipsilateral locus of post-traumatic brain pathology observed in the animal experiments. Note that impact produces peak shear stress in the brain before onset of gross motion of the head. By contrast, blast exposure under conditions that induces comparable head kinematics results in distributed loading on the head and lower magnitude shear stress in the brain. (I and J) Time dependence of the intracranial shear stress for impact (I) and blast (J) simulation models at the ipsilateral, midline, and contralateral Lagrangian tracer locations. Full-sequence computational simulation time histories for impact and blast are available for viewing (Supplementary Video 2).
Figure 8
Figure 8
Model of traumatic microvascular injury, blood–brain barrier disruption, microglial activation, perivascular neuroinflammation, myelinated axonopathy, and phosphorylated tauopathy after closed-head impact injury. (A) Brain capillary with intact blood–brain barrier and neurovascular unit. The contents within the capillary lumen include blood plasma, blood proteins (including serum albumin, salb) and formed elements (red blood cells, rbc; circulating monocytes, mono; other white blood cells and platelets, not shown). The capillary luminal wall is a structurally continuous sheath formed by endothelial cell membranes that are joined at intercellular clefts by tight junction complexes (tjc). The basal lamina separates endothelial cells from pericytes, multifunctional mural cells that support microvascular and neurovascular unit function. Astrocyte endfeet ensheath the abluminal capillary wall. The neurovascular unit comprises endothelial cells, astrocytes, pericytes, neurons, and extracellular matrix components that regulate blood–brain barrier function, gas exchange, and bidirectional transit of fluid, metabolites, nutrients, and signalling molecules between the blood and brain. (B) Injured brain capillary after neurotrauma. (1) Intraparenchymal shearing forces initiated by focal mechanical injury disrupt local microvascular structure and blood–brain barrier functional integrity. (2) Compensatory changes in the extracellular matrix, elaboration and expansion of the basal lamina, formation of stress granules, inclusion bodies, and autophagosomic vacuoles are indicative of traumatic microvascular injury and post-traumatic repair and remodelling. (3) Astrocytic endfoot engorgement (astrocytic hydrops), organelle degradation (autophagy, mitophagy), and vacuolization are prominent ultrastructural features of capillaries damaged by neurotrauma. Perivascular astrocytes assume a reactive phenotype with concomitant loss of endfoot organellar integrity and secondary fluid accumulation (presumably from vascular fluid transit and pump failure or endfoot membrane loss). Together these processes lead to loss of cellular polarity and astrocyte endfoot retraction (involution) along the abluminal capillary wall. (4) Post-traumatic alterations in microvascular structure further compromise blood–brain barrier integrity and promote extravasation of pro-inflammatory plasma proteins (e.g. serum albumin, salb) into the brain parenchyma. Damaged capillaries may also facilitate inflammatory cell diapedesis and red blood cell transit (microhaemorrhage) into the brain parenchymal. (5) Serum albumin and other blood proteins (e.g. fibrinogen) are highly stimulatory to astrocytes, microglia, and CNS-resident macrophage and drive cellular transformation from resting to reactive phenotypes. These and other molecular triggers induce local activation and phenotypic transformation of brain-resident microglia, including increased expression of the triggering receptor expressed on myeloid cells 2 (TREM2), an innate immune receptor expressed on the surface of activated microglia. Microglial TREM2 expression may be accompanied by endoproteolytic cleavage of the TREM2 ectodomain and shedding of the resulting cleavage product (sTREM2). Our results indicate that post-traumatic microglial activation and phenotypic transformation precede infiltration and accumulation of peripheral inflammatory cells at sites of focal brain injury. Localized clusters of hemosiderin-laden macrophage represent chronic residua of prior microhaemorrhage. (6) Secondary changes in neurons triggered by neurotrauma lead to axonopathy (e.g. demyelination, blebbing, axonal transport dysfunction, phosphorylated tau protein aggregation), dendritic denuding, hyperexcitability, synaptic dysfunction, and neurodegeneration. (7) Tau protein dissociates from microtubules, undergoes pathogenic phosphorylation (p-tau), aggregates abnormally within axons, and stimulates pathogenic transport to and miscompartmentalization within the soma and dendrites of traumatized neurons. (8) P-tau also accumulates in activated microglia, reactive astrocytes, and possibly other brain cells. P-tau propagation and spread may proceed via extracellular, paracellular, transcellular, and/or glympathic mechanisms. (C) Schematic representation of the axonal compartment of a healthy neuron (left) and traumatized neuron (right). In healthy neurons, tau protein associates with and stabilizes microtubules in axons and dendrites. In traumatized neurons, tau protein dissociates from microtubules and undergoes aberrant phosphorylation. P-tau is prone to pathogenic oligomerization, aggregation, and accumulation within axons, terminals, dendrites, spines, and soma of affected neurons. Miscompartmentalization of abnormally processed phosphorylated tau promotes release and transmission of p-tau species that contribute to progressive neurotoxicity and neurodegeneration. (D) Internal force lines (red) show increased stress concentration at structural dishomogeneities in the brain. Anatomical features such as capillaries (cap), depths of cortical sulci, and grey-white matter interfaces are subject to shear stress amplification (stress concentration) and focal mechanical trauma (arrows). See text for details and discussion.

References

    1. Abbas K, Shenk TE, Poole VN, Breedlove EL, Leverenz LJ, Nauman EA, et al. Alteration of default mode network in high school football athletes due to repetitive subconcussive mild traumatic brain injury: a resting-state functional magnetic resonance imaging study. Brain Connect 2015; 5: 91–101. - PubMed
    1. Adams JH, Graham DI, Murray LS, Scott G. Diffuse axonal injury due to nonmissile head injury in humans: an analysis of 45 cases. Ann Neurol 1982; 12: 557–63. - PubMed
    1. Alosco M, Kasimis A, Stamm J, Chua A, Baugh C, Daneshvar D, et al. Age of first exposure to American football and long-term neuropsychiatric and cognitive outcomes. Transl Psychiatry 2017; 7: e1236. - PMC - PubMed
    1. Angoa PM, Kane MJ, Briggs DI, Herrera MN, Viano DC, Kuhn DM. Animal models of sports-related head injury: bridging the gap between preclinical research and clinical reality. J Neurochem 2014; 129: 916–31. - PMC - PubMed
    1. Annegers JF, Hauser WA, Coan SP, Rocca WA. A population-based study of seizures after traumatic brain injuries. N Eng J Med 1998; 338: 20–4. - PubMed

Publication types

MeSH terms