. 2018 Apr 1;35(4):1003-1017.
doi: 10.1093/molbev/msy006.

Estimating Time to the Common Ancestor for a Beneficial Allele

Affiliations

Estimating Time to the Common Ancestor for a Beneficial Allele

Joel Smith et al. Mol Biol Evol. .

Erratum in

Abstract

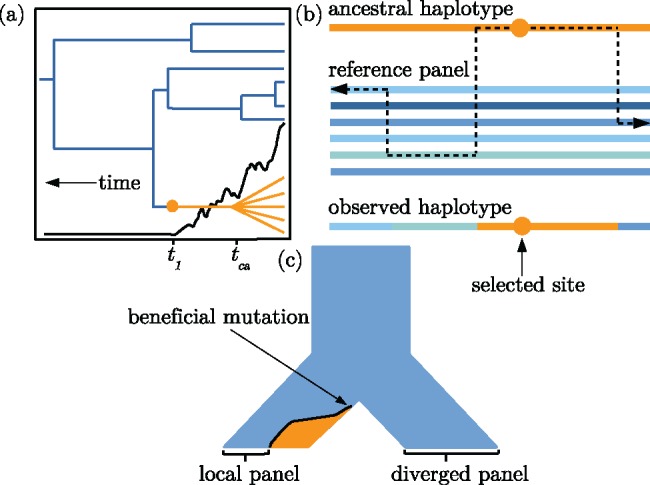
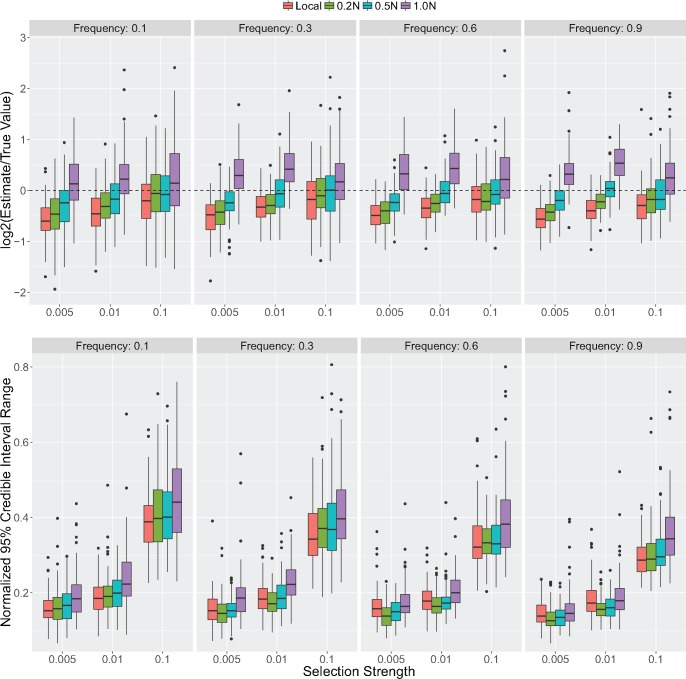
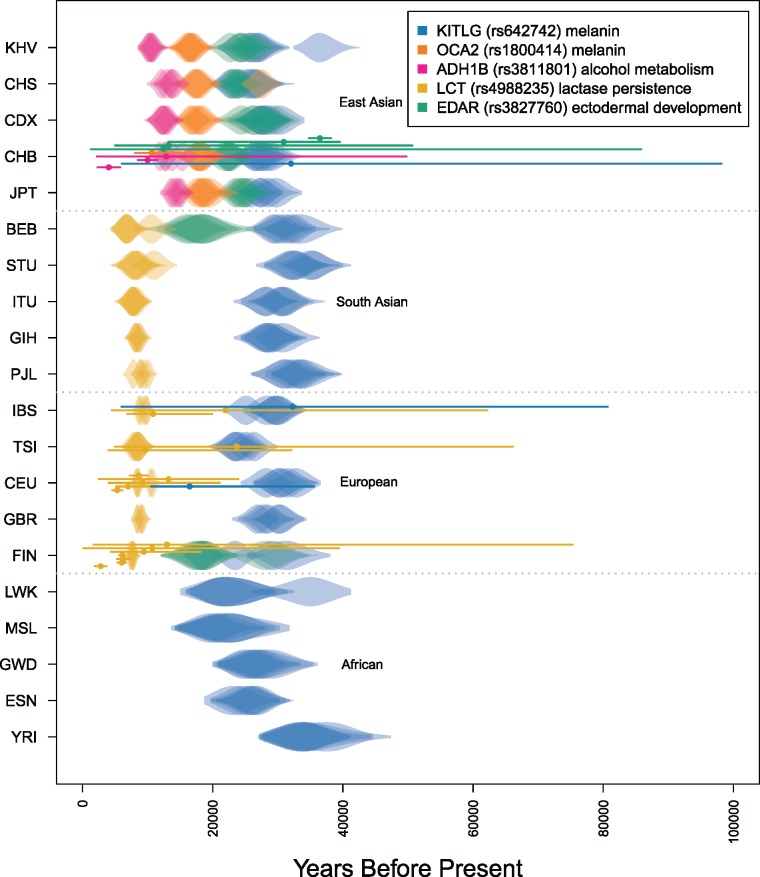
The haplotypes of a beneficial allele carry information about its history that can shed light on its age and the putative cause for its increase in frequency. Specifically, the signature of an allele's age is contained in the pattern of variation that mutation and recombination impose on its haplotypic background. We provide a method to exploit this pattern and infer the time to the common ancestor of a positively selected allele following a rapid increase in frequency. We do so using a hidden Markov model which leverages the length distribution of the shared ancestral haplotype, the accumulation of derived mutations on the ancestral background, and the surrounding background haplotype diversity. Using simulations, we demonstrate how the inclusion of information from both mutation and recombination events increases accuracy relative to approaches that only consider a single type of event. We also show the behavior of the estimator in cases where data do not conform to model assumptions, and provide some diagnostics for assessing and improving inference. Using the method, we analyze population-specific patterns in the 1000 Genomes Project data to estimate the timing of adaptation for several variants which show evidence of recent selection and functional relevance to diet, skin pigmentation, and morphology in humans.


Figures

<sc>Fig</sc>. 1.
Fig. 1.
Visual descriptions of the model. (a) An idealized illustration of the effect of a selectively favored mutation’s frequency trajectory (black line) on the shape of a genealogy at the selected locus. The orange lineages are chromosomes with the selected allele. The blue lineages indicate chromosomes that do not have the selected allele. Note the distinction between the time to the common ancestor of chromosomes with the selected allele, tca, and the time at which the mutation arose, t1. (b) The copying model follows the ancestral haplotype (orange) moving away from the selected site until recombination events within the reference panel lead to a mosaic of nonselected haplotypes surrounding the ancestral haplotype. (c) A demographic history with two choices for the reference panel: Local and diverged. After the ancestral population at the top of the figure splits into two sister populations, a beneficial mutation arises and begins increasing in frequency. The orange and blue colors indicate frequency of the selected and nonselected alleles, respectively.
<sc>Fig</sc>. 2.
Fig. 2.
Accuracy results from simulated data. Accuracy of TMRCA point estimates and 95% credible interval ranges from posteriors inferred from simulated data under different strengths of selection, final allele frequencies and choice of reference panel. Credible interval range sizes are in units of generations and are normalized by the true TMRCA for each simulated data set. See Materials and Methods below for simulation details.
<sc>Fig</sc>. 3.
Fig. 3.
Comparison of TMRCA estimates with previous results. Violin plots of posterior distributions for the complete set of estimated TMRCA values for the five variants indicated in the legend scaled to a generation time of 29 years. Each row indicates a population sample from the 1000 Genomes Project panel. Replicate MCMCs are plotted with transparency. Points and lines overlaying the violins are previous point estimates and 95% confidence intervals for each of the variants indicated by a color and rs number in the legend (see supplementary tables 3 and 4, Supplementary Material online). The population sample abbreviations are defined in text.

References

    1. Akey JM, Eberle MA, Rieder MJ, Carlson CS, Shriver MD, Nickerson DA, Kruglyak L.. 2004. Population history and natural selection shape patterns of genetic variation in 132 genes. PLoS Biol. 2:1591–1599. - PMC - PubMed
    1. Allentoft ME, Sikora M, Sjögren K-G, Rasmussen S, Rasmussen M, Stenderup J, Damgaard PB, Schroeder H, Ahlström T, Vinner L.. 2015. Population genomics of Bronze Age Eurasia. Nature 5227555: 167–172. - PubMed
    1. Auton A, McVean G.. 2012. Estimating recombination rates from genetic variation in humans In: Anisimova M. ed, Evolutionary genomics. Methods in Molecular Biology (Methods and Protocols), vol 856. New York: Humana Press. - PubMed
    1. Barrett RDH, Hoekstra HE.. 2011. Molecular spandrels: tests of adaptation at the genetic level. Nat Rev Genet. 1211: 767–780.10.1038/nrg3015 - DOI - PubMed
    1. Baudat F, Buard J, Grey C, Fledel-Alon A, Ober C, Przeworski M, Coop G, Massy BD.. 2010. PRDM9 is a major determinant of meiotic recombination hotspots in humans and mice. Science 3275967: 836–840. - PMC - PubMed

Publication types