. 2018 Mar 16;46(5):2446-2458.
doi: 10.1093/nar/gky004.

Single-particle trajectories reveal two-state diffusion-kinetics of hOGG1 proteins on DNA

Affiliations

Single-particle trajectories reveal two-state diffusion-kinetics of hOGG1 proteins on DNA

Christian L Vestergaard et al. Nucleic Acids Res. .

Abstract

We reanalyze trajectories of hOGG1 repair proteins diffusing on DNA. A previous analysis of these trajectories with the popular mean-squared-displacement approach revealed only simple diffusion. Here, a new optimal estimator of diffusion coefficients reveals two-state kinetics of the protein. A simple, solvable model, in which the protein randomly switches between a loosely bound, highly mobile state and a tightly bound, less mobile state is the simplest possible dynamic model consistent with the data. It yields accurate estimates of hOGG1's (i) diffusivity in each state, uncorrupted by experimental errors arising from shot noise, motion blur and thermal fluctuations of the DNA; (ii) rates of switching between states and (iii) rate of detachment from the DNA. The protein spends roughly equal time in each state. It detaches only from the loosely bound state, with a rate that depends on pH and the salt concentration in solution, while its rates for switching between states are insensitive to both. The diffusivity in the loosely bound state depends primarily on pH and is three to ten times higher than in the tightly bound state. We propose and discuss some new experiments that take full advantage of the new tools of analysis presented here.


Figures

Figure 1.
Figure 1.
Experimental measurements of diffusion coefficients of hOGG1 proteins on flow-stretched λ DNA. (A) Workflow for estimation of diffusion coefficients from experimental tracking data of diffusing particles on DNA. (B) Experimental setup (not to scale): Proteins (green) on flow-stretched DNA (black) attached to cover slip at one end and fluctuating in a shear flow. (C) Image of several fluorescent hOGG1 molecules bound to and diffusing on a DNA molecule at higher density than during data acquisition for illustration (27). Scale-bar = 1 μm. (D) Transverse coordinates y of the trajectories of three hOGG1 proteins diffusing on DNA and recorded with time-lapse Δt = 11 ms. The mean residence time of proteins on DNA ranges from 50 to 500 ms, depending on solution conditions. (E) Longitudinal coordinates x of the same three proteins. (F) Periodogram formula image of the transverse coordinate of a protein diffusing on DNA. The transverse fluctuations fit a Lorentzian plus a constant. The corner frequency (3 dB frequency) fc of the Lorentzian is 6.7 Hz. (G) Periodogram formula image of longitudinal displacements of the same protein. The periodogram of displacements Δx is used, because diffusion is an unbounded process, making the periodogram of x a bad statistics. The expected value of formula image, the power spectrum PΔx, is the sum of a diffusion term, a white-noise term, and a single Lorentzian term describing longitudinal DNA fluctuations. The corner frequency of these fluctuations is fc, x = 2fc, in agreement with our assumption that DNA fluctuations in the y- and z-directions contribute equally to DNA fluctuations in the x-direction. Shown values for data in F, G are block averages, each over 20 periodogram values, and the grey areas mark the 68% confidence interval (CI) for the block averages.
Figure 2.
Figure 2.
Estimated parameter values as functions of the protein’s position formula image on DNA. Results for molecule no. 5 (pH 7.5 and [NaCl] = 0.01 M). Averages are weighted means and error bars are weighted s.e.m., except for estimates of diffusion coefficients; their averages are simple mean values. Data close to the DNA ends (open gray symbols) are excluded in the following analysis to avoid bias (see discussion in Supplementary Section S3A). (A) MLE of the corner frequency fc of transverse (y-direction) DNA motion. Measured values vary by a factor two between the tethered and the free end. (The hypothesis that fc is constant is refuted with P = 6 × 10⁻⁷.) The faster dynamics near the tethered end is due to larger tension in the DNA there. (The corner frequency of the DNA’s longitudinal motion is twice the corner frequency of its transverse motion.) (B) The diffusivity formula image of longitudinal DNA fluctuations is constant along the DNA, corresponding to increasing amplitude in the downstream direction in consequence of decreasing tension; formula image (P = 0.93). (C) The diffusivity formula image of transverse DNA fluctuations is also constant along the DNA; formula image (P = 0.19). (D) The CVE overestimates σ2, the variance of localization errors, by almost a factor two because it does not account for DNA motion. The MLE of σ2 increases slightly towards the free end. The assumption that it is constant has negligible support: P = 0.003. (E) Estimated diffusion coefficients. The uncorrected CVE overestimates diffusion coefficients significantly, because it does not account for DNA motion. The MLE does not, and shows that diffusion coefficients do not depend on the protein’s position on the DNA (P = 0.10). (F) Experimental estimates of the bias bD of the CVE, calculated as formula image, and theoretical estimates, calculated from Equation (1) using weighted means of estimates of fc and Kx (Materials and Methods and Supplementary Section S3D). The theory generally agrees excellently with experiments. The bias increases near the DNA’s free end, where DNA fluctuations are larger and slower.
Figure 3.
Figure 3.
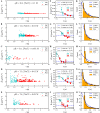
Estimated diffusion coefficients and residence times for proteins on DNA. Each row shows results for the experimental conditions listed in the top of the left panels. (A–E) Estimated diffusion coefficients formula image versus residence times for proteins on DNA. (F–J) Block averages of diffusion coefficient estimates in A–E binned on the time axis. (A, F, K) DNA molecule no. 1 (pH 6.6 and [NaCl] = 0.1 M); (B, G, L) DNA molecules nos. 2 and 3 (pH 7.0 and [NaCl] = 0.01 M); (C, H, M) DNA molecule no. 4 (pH 7.0 and [NaCl] = 0.075 M); (D, I, N) DNA molecule no. 5 (pH 7.5 and [NaCl] = 0.01 M); (EJO) DNA molecule no. 6 (pH 7.8 and [NaCl] = 0.05 M). A clear dependence on the residence time is seen in the measured diffusion coefficients, quite contrary to what one finds for a simple diffusion process. (K–O) Distribution of protein residence times on DNA. The distributions are not simple exponentials, so the rate of detachment of protein from DNA is not constant but decreases with the time bound. Dashed blue lines and full black lines in F–O mark combined ML fits of the one- and two-state models, respectively, to data in the second and third columns (P-values are given in legends and in Table 1, and estimated parameter values are given in Table 2).
Figure 4.
Figure 4.
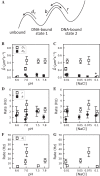
Two-state model for hOGG1’s diffusion on DNA. (A) Schematic free energy landscape for the two-state model for diffusion on DNA. Maximum likelihood fits of this two-state model to data shown in Figure 3 give P-values which support the two-state model and Akaike weights which overwhelmingly favor the two-state model over the one-state model (Table 1). (B–G) Maximum likelihood estimates of parameters in the model as a function of pH-value (BDF) and salt concentration (C, E, G). (B, C) Diffusion coefficients in the loosely bound state, D1, and in the tightly bound state, D2. *The low value of D1 found for [NaCl] = 0.1 M is explained by the low value of the pH (pH 6.6) for this DNA molecule. (D, E) Rates of transitions, b from the loosely to the tightly bound state and r for returning. These rates for changing between states do not show significant dependence on pH (D) or salt concentration (E). (F, G) Detachment rate d1 from the loosely bound state. **Salt concentration is varied 8-fold between the two measurements at pH 7.0, which explains the difference in detachment rates.

References

    1. Brameshuber M., Schütz G.J.. Detection and quantification of biomolecular association in living cells using single-molecule microscopy. Methods Enzymol. 2012; 505:159–186. - PubMed
    1. Alberts B., Bray D., Lewis J., Raff M., Roberts K., Watson J.D.. Molecular Biology of the Cell. 1994; 3rd ednGarland Publishing, Inc; 95–563.
    1. van Loenhout M.T.J., de Grunt M.V., Dekker C.. Dynamics of DNA supercoils. Science. 2012; 338:94–97. - PubMed
    1. Wang Y.M., Austin R.H., Cox E.C.. Single molecule measurements of repressor protein 1D diffusion on DNA. Phys. Rev. Lett. 2006; 97:048302. - PubMed
    1. Granéli A., Yeykal C.C., Robertson R.B., Greene E.C.. Long-distance lateral diffusion of human Rad51 on double-stranded DNA. Proc. Natl. Acad. Sci. U.S.A. 2006; 103:1221–1226. - PMC - PubMed

Publication types