Exploring DNA variant segregation types in pooled genome sequencing enables effective mapping of weeping trait in Malus
- PMID: 29361034
- PMCID: PMC5888915
- DOI: 10.1093/jxb/erx490
Exploring DNA variant segregation types in pooled genome sequencing enables effective mapping of weeping trait in Malus
Abstract
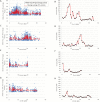
To unlock the power of next generation sequencing-based bulked segregant analysis in allele discovery in out-crossing woody species, and to understand the genetic control of the weeping trait, an F1 population from the cross 'Cheal's Weeping' × 'Evereste' was used to create two genomic DNA pools 'weeping' (17 progeny) and 'standard' (16 progeny). Illumina pair-end (2 × 151 bp) sequencing of the pools to a 27.1× (weeping) and a 30.4× (standard) genome (742.3 Mb) coverage allowed detection of 84562 DNA variants specific to 'weeping', 92148 specific to 'standard', and 173169 common to both pools. A detailed analysis of the DNA variant genotypes in the pools predicted three informative segregation types of variants: <lm×mm> (type I) in weeping pool-specific variants, and <lm×ll> (type II) and <hk×hk> (type III) in variants common to both pools, where the first allele is assumed to be weeping linked and the allele shown in bold is a variant in relation to the reference genome. Conducting variant allele frequency and density-based mappings revealed four genomic regions with a significant association with weeping: a major locus, Weeping (W), on chromosome 13 and others on chromosomes 10 (W2), 16 (W3), and 5 (W4). The results from type I variants were noisier and less certain than those from type II and type III variants, demonstrating that although type I variants are often the first choice, type II and type III variants represent an important source of DNA variants that can be exploited for genetic mapping in out-crossing woody species. Confirmation of the mapping of W and W2, investigation into their genetic interactions, and identification of expressed genes in the W and W2 regions provided insight into the genetic control of weeping and its expressivity in Malus.
Figures


Similar articles
-
Exploring DNA Variant Segregation Types Enables Mapping Loci for Recessive Phenotypic Suppression of Columnar Growth in Apple.Front Plant Sci. 2020 Jun 9;11:692. doi: 10.3389/fpls.2020.00692. eCollection 2020. Front Plant Sci. 2020. PMID: 32582242 Free PMC article.
-
Two distinct major QTL for resistance to fire blight co-localize on linkage group 12 in apple genotypes 'Evereste' and Malus floribunda clone 821.Genome. 2009 Feb;52(2):139-47. doi: 10.1139/g08-111. Genome. 2009. PMID: 19234562
-
Fast and cost-effective genetic mapping in apple using next-generation sequencing.G3 (Bethesda). 2014 Jul 16;4(9):1681-7. doi: 10.1534/g3.114.011023. G3 (Bethesda). 2014. PMID: 25031181 Free PMC article.
-
High-density genetic map construction and identification of a locus controlling weeping trait in an ornamental woody plant (Prunus mume Sieb. et Zucc).DNA Res. 2015 Jun;22(3):183-91. doi: 10.1093/dnares/dsv003. Epub 2015 Mar 15. DNA Res. 2015. PMID: 25776277 Free PMC article.
-
A single amino acid substitution in MdLAZY1A dominantly impairs shoot gravitropism in Malus.Plant Physiol. 2023 Sep 22;193(2):1142-1160. doi: 10.1093/plphys/kiad373. Plant Physiol. 2023. PMID: 37394917
Cited by
-
Gravity sensing and responses in the coordination of the shoot gravitropic setpoint angle.New Phytol. 2022 Dec;236(5):1637-1654. doi: 10.1111/nph.18474. Epub 2022 Sep 30. New Phytol. 2022. PMID: 36089891 Free PMC article. Review.
-
Identification of Differentially Up-regulated Genes in Apple with White Rot Disease.Plant Pathol J. 2019 Oct;35(5):530-537. doi: 10.5423/PPJ.NT.10.2018.0210. Epub 2019 Oct 1. Plant Pathol J. 2019. PMID: 31632227 Free PMC article.
-
PpMYB36 Encodes a MYB-Type Transcription Factor That Is Involved in Russet Skin Coloration in Pear (Pyrus pyrifolia).Front Plant Sci. 2021 Nov 8;12:776816. doi: 10.3389/fpls.2021.776816. eCollection 2021. Front Plant Sci. 2021. PMID: 34819942 Free PMC article.
-
Exploring DNA Variant Segregation Types Enables Mapping Loci for Recessive Phenotypic Suppression of Columnar Growth in Apple.Front Plant Sci. 2020 Jun 9;11:692. doi: 10.3389/fpls.2020.00692. eCollection 2020. Front Plant Sci. 2020. PMID: 32582242 Free PMC article.
-
Comparative Transcriptomics and RNA-Seq-Based Bulked Segregant Analysis Reveals Genomic Basis Underlying Cronartium ribicola vcr2 Virulence.Front Microbiol. 2021 Feb 22;12:602812. doi: 10.3389/fmicb.2021.602812. eCollection 2021. Front Microbiol. 2021. PMID: 33776951 Free PMC article.
References
-
- Abe A, Kosugi S, Yoshida K et al. . 2012. Genome sequencing reveals agronomically important loci in rice using MutMap. Nature Biotechnology 30, 174–178. - PubMed
-
- Alston FH, Phillips KL, Evans KM. 2000. A Malus gene list. Acta Horticulturae 538, 561–570.
-
- Bai Y, Dougherty L, Xu K. 2014. Towards an improved apple reference transcriptome using RNA-seq. Molecular Genetics and Genomics 289, 427–438. - PubMed
-
- Brown SK. 1992. Genetics of apple. Plant Breeding Reviews 9, 333–366.
Publication types
MeSH terms
Substances
LinkOut - more resources
Full Text Sources
Other Literature Sources
Miscellaneous

