. 2018 Mar 16;46(5):2459-2478.
doi: 10.1093/nar/gky008.

The prolyl isomerase FKBP25 regulates microtubule polymerization impacting cell cycle progression and genomic stability

Affiliations

The prolyl isomerase FKBP25 regulates microtubule polymerization impacting cell cycle progression and genomic stability

David Dilworth et al. Nucleic Acids Res. .

Abstract

FK506 binding proteins (FKBPs) catalyze the interconversion of cis-trans proline conformers in proteins. Importantly, FK506 drugs have anti-cancer and neuroprotective properties, but the effectors and mechanisms underpinning these properties are not well understood because the cellular function(s) of most FKBP proteins are unclear. FKBP25 is a nuclear prolyl isomerase that interacts directly with nucleic acids and is associated with several DNA/RNA binding proteins. Here, we show the catalytic FKBP domain binds microtubules (MTs) directly to promote their polymerization and stabilize the MT network. Furthermore, FKBP25 associates with the mitotic spindle and regulates entry into mitosis. This interaction is important for mitotic spindle dynamics, as we observe increased chromosome instability in FKBP25 knockdown cells. Finally, we provide evidence that FKBP25 association with chromatin is cell-cycle regulated by Protein Kinase C phosphorylation. This disrupts FKBP25-DNA contacts during mitosis while maintaining its interaction with the spindle apparatus. Collectively, these data support a model where FKBP25 association with chromatin and MTs is carefully choreographed to ensure faithful genome duplication. Additionally, they highlight that FKBP25 is a MT-associated FK506 receptor and potential therapeutic target in MT-associated diseases.


Figures
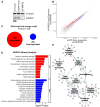
Figure 1.
Figure 1.
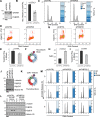
FKBP25 knockdown activates transcriptional networks associated with the stress response and attenuated proliferation. (A) siRNA-mediated knockdown of FKBP25 in HEK293 cells relative to untransfected (UT) and GFP-targeting transfected controls. Western blots show protein expression of FKBP25 and an α-Tubulin loading control. (B) RNA-Seq transcriptome analysis of cells treated with FKBP25 targeting siRNA versus a GFP targeting control. Expression values are shown as log10 read per kilobase of transcript per million mapped reads (RPKM). Red data points indicate a log2 fold change >0.5 and blue indicates a change <−0.5. (C) Number of genes selected for KEGG enrichment analysis based on a log2 fold change of >0.5 (upregulated expression) or <−0.5 (downregulated expression). (D) KEGG pathway terms associated with upregulated (red) or downregulated (blue) gene sets identified in B. (E) Network depiction of upregulated genes enriched in KEGG pathway analysis; expanded view presented in Supplementary Figure S1.
Figure 2.
Figure 2.
FKBP25 is required for timely progression through the cell cycle. (A) Western blot showing FKBP25 knockdown in U2OS cells transfected with siRNAs. GAPDH is shown as a loading control. (B) MTT proliferation assay measuring cell viability 72 h post-knockdown. Results shown are the mean ± SD of six independent transfections plated at three densities. (CE) Cell cycle analysis of FKBP25 knockdown cells by flow-cytometry. (C) Histogram of PI-stained cells depicting cell cycle distribution, inlay bar graphs depict the mean ±SD of three replicates. (D) Dot-plot representing fluorescence intensity of H3pS10 levels versus PI-stain. (E) Quantification of H3pS10 positive mitotic cells as a percent of G2/M cells in D. Shown is the mean ±SD for three replicates. (F) Schematic representation of nocodazole trap; cells incubated for 8 h in nocodazole to halt progression into G1 of the cell cycle. (GI) Flow cytometry analysis of 8 h nocodazole-trapped cells. (G) Dot-plot of H3pS10 expression versus PI-staining. (H) Quantification of cells remaining in G1. Results are shown as the mean ±SD of three replicates. (I) Percentage of G2/M cells in mitosis. Results are presented as the mean ±SD of three replicates. (J) Western blot analysis of mitotic entry 8 h post-nocodazole trap of stable FKBP25 shRNA knockdown U2OS cells. Histone H3 and α-tubulin are shown as loading controls. (K) Schematic representation of synchronization at G2/M border by thymidine block followed by CDK1 inhibition (RO3306). (L) Western blot analysis of mitotic entry in siRNA transfected cells released from G2/M transition block. (M) Flow cytometry analysis of PI-stained stable shRNA FKBP25 knockdown cells released from G2/M transition block.
Figure 3.
Figure 3.
FKBP25 colocalizes with MTs. (A and B) Confocal imaging of the cellular distribution of FKBP25 (red) and α-Tubulin (green) during (A) interphase and (B) throughout mitosis. Chromosomes stained with DAPI (blue). The co-localization of FKBP25 and tubulin was quantified by Pearson’s Correlation Co-efficient (PCC) scores, which take both pixel location and intensity into account to provide a measure of co-distribution, from −1 (mutual exclusion) to 1 (perfect colocalization). Scale bars represent 10 um.
Figure 4.
Figure 4.
FKBP25 binds polymerized MTs via its FKBP domain. (A) In vitro MT spin-down assay. Coomassie stained gels and western blots show supernatant (S) and pellet (P) in the absence or presence of MTs purified from asynchronous or mitotic HeLa S3 cells incubated with recombinant FKBP25 or BSA control and centrifuged over a sucrose cushion. (B and D) Western blots analysis of MT spin-down assay. MT incubated with (B) full-length, N-terminal and C-terminal domains of FKBP25, (C) a catalytic-null FKBP25 mutant (Y198F) or (D) in the presence/absence of 20 nM rapamycin. (E) Tubulin polymerization assays. Tubulin polymerization was monitored using a fluorescence based kit (Cytoskeleton, BK011P) in the presence of 3 µM Paclitaxel (Taxol) or 6 µM of the indicated purified recombinant 6-his tagged FKBP25 proteins.
Figure 5.
Figure 5.
FKBP25 regulates the stability of MTs independent of catalytic activity. (A) U2OS Flp-In T-Rex tetracycline inducible knockdown rescue system. Western blot of cells transfected with siRNA and treated with tetracycline to induce expression of either a wild-type or catalytic-null(Y198F) FKBP25 rescue transgene. GAPDH is shown as a loading control. (B and C) In cell MT stability assay. (B) Representative images showing epi-fluorescence microscopy of α-tubulin (green), indicating polymerized MTs and DAPI (blue) showing the nucleus in Flp-In T-Rex U2OS knockdown/rescue cells pre-extracted with PME buffer containing detergent. (C) Quantification of α-tubulin fluorescence intensity per cell (arbitrary units) in B. Plots show the fluorescence intensity measurements of cells from at least five fields of view and >250 cells per sample. (D) In cell MT stability pelleting assay. Immunoblot of supernatant and pellet of U2OS stable shRNA knockdown cells permeabilized with PEM buffer containing detergent and centrifuged. Pelleted fraction (P) represents stable polymerized MTs and supernatant (S) unpolymerized tubulin. (E) Quantification of immunoblots in D. Results are shown as the mean ±SD for three replicates. (F) MN frequency assay. Boxplot showing the frequency of MN in U2OS stable shRNA cells. Measurements are taken from three independent replicates each with at least five fields of view quantified. A representative image of DAPI stained MN relative to the cell nucleus is also shown. (G) Quantification of binucleated cells in U2OS stable shRNA-expressing cells visualized by Giemsa staining, as shown in representative images. Boxplot depicts the percentage of binucleated cells in at least five fields of view from three replicate experiments. (H) Depletion of FKBP25 renders U2OS cells resistant to Taxol. Stable cell lines expressing the indicated shRNAs were treated with the indicated doses of paclitaxel for 24 h, recovered for 24 h and stained with crystal violet to score viable cells.
Figure 6.
Figure 6.
FKBP25 is multiply phosphorylated upon entry into mitosis. (A) Cell cycle distribution of synchronized cells. Flow cytometry analysis of PI-stained synchronized Flp-In HeLa S3 cells expressing FLAG-tagged FKBP25. (B) Western blotting of FLAG-FKBP25 immunoprecipitate from synchronized cells on SDS-PAGE gels with or without 50 μM Phos-tag. Parental cell line does not have an integrated FKBP25 transgene. (C) Flow cytometry analysis of cell cycle distribution of PI-stained cells synchronized at G2/M border by thymidine/CDK1 block and released. (D) Western blot analysis of FLAG-FKBP25 IP material from cells synchronized and released at G2/M transition run on SDS-PAGE gels with or without 50 μM Phos-tag. (E) Schematic representation of mass spectrometry identified phosphoresidues in immunoprecipitated FLAG-FKBP25 from thymidine/nocodazole-synchronized mitotic cells (this study), phosphoresidues previously detected as described in the PhosphoSitePlus database (67) and characterized DNA binding surfaces (28) are also shown.
Figure 7.
Figure 7.
FKBP25 is phosphorylated by PKC. (AD) In vitro kinase assays. (A) Western blot analysis of recombinant histone H3 alone, incubated with mitotic extract, or incubated with mitotic extract and the Aurora kinase inhibitor MK-0457 (50 μM) in kinase buffer. (B) Purified full-length proteins were incubated with mitotic extract in the presence of γ[32P]-ATP, resolved by SDS-PAGE and visualized by autoradiography. For the Cntrl lane, no recombinant protein included in the reaction. Histone H3 included as a positive control. (C) Identification of putative mitotic kinase by in vitro kinase assay in the presence of mitotic kinase inhibitors. Assays performed as in B with the inclusion of the kinase inhibitors staurosporine (broad range), Gö 6983 (PKC), Tyrphostin AG1112 (CKII), Roscovitine (CDKs), RO3306 (CDK1) and MK-0457(Aurora). (D) In vitro kinase assay with recombinant canonical PKC kinases and CDK1. Recombinant FKBP25 incubated with purified PKCα (12.5 ng), PKCβII (12.5 ng) or CDK1-cyclinB1 (20 ng). (E) Schematic representation of mass spectrometry identified phosphoresidues on recombinant FKBP25 in vitro phosphorylated with either PKCα or PKCβII.
Figure 8.
Figure 8.
Phosphorylation of FKBP25 impairs DNA binding, but not its interaction with MTs. (A) Gel retardation assay measuring DNA binding of FKBP25 with and without in vitro PKC phosphorylation. Coomassie stained SDS-PAGE gels with or without 50 μM Phos-tag show loading and phosphorylation status of FKBP25. (B) In vitro MT spin-down binding assay with recombinant FKBP25 in vitro phosphorylated with PKCα or PKCβII. No kinase sample is shown as a control. (C) In vitro MT spin-down assay with phosphomimetic recombinant FKBP25 8xS/T to E mutant (S32, S36, S77, T98, S100, T103, S152, S163 mutated to glutamate). (DF) Gel retardation assay measuring DNA binding of recombinant FKBP25 (D and E) wild-type sequence and phosphomimetic S/T to E mutants, and (F) FKBP25 domains.
Figure 9.
Figure 9.
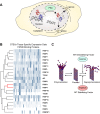
Model depicting the involvement of FKBP25 in MT stability. (A) Model. FKBP25 (PDB ID: 2MPH) is phosphorylated by PKC during mitosis to promote its release from chromatin, freeing FKBP25 to function as a MT stabilizer in the formation of the mitotic spindle apparatus. (B) Heatmap of normalized tissue-specific gene expression from GTEx datasets for human FKBP domain containing proteins. FKBP52 (FKBP4) and FKBP25 (FKBP3) cluster together based on tissue-specific expression patterns, indicated in red. (C) Schematic representation of opposing functions of FKBP52 and FKBP25 on MT stability.

Similar articles

Cited by

References

    1. Weiss M.S., Jabs A., Hilgenfeld R.. Peptide bonds revisited. Nat. Struct. Mol. Biol. 1998; 5:676–676. - PubMed
    1. Stewart D.E., Sarkar A., Wampler J.E.. Occurrence and role of cis peptide bonds in protein structures. J. Mol. Biol. 1990; 214:253–260. - PubMed
    1. Göthel S.F., Marahiel M.A.. Peptidyl-prolyl cis-trans isomerases, a superfamily of ubiquitous folding catalysts. Cell. Mol. Life Sci. 1999; 55:423–436. - PMC - PubMed
    1. Chelu M.G., Danila C.I., Gilman C.P., Hamilton S.L.. Regulation of ryanodine receptors by FK506 binding proteins. Trends Cardiovasc. Med. 2004; 14:227–234. - PubMed
    1. Brichkina A., Nguyen N.T.M., Baskar R., Wee S., Gunaratne J., Robinson R.C., Bulavin D. V. Proline isomerisation as a novel regulatory mechanism for p38MAPK activation and functions. Cell Death Differ. 2016; 23:1592–1601. - PMC - PubMed

Publication types