. 2018 May;175(9):1471-1485.
doi: 10.1111/bph.14152. Epub 2018 Mar 25.

Acute ethanol exposure has bidirectional actions on the endogenous neuromodulator adenosine in rat hippocampus

Affiliations

Acute ethanol exposure has bidirectional actions on the endogenous neuromodulator adenosine in rat hippocampus

Victoria Hughes et al. Br J Pharmacol. 2018 May.

Abstract

Background and purpose: Ethanol is a widely used recreational drug with complex effects on physiological and pathological brain function. In epileptic patients, the use of ethanol can modify seizure initiation and subsequent seizure activity with reports of ethanol being both pro- and anticonvulsant. One proposed target of ethanol's actions is the neuromodulator adenosine, which is released during epileptic seizures to feedback and inhibit the occurrence of subsequent seizures. Here, we investigated the actions of acute ethanol exposure on adenosine signalling in rat hippocampus.

Experimental approach: We have combined electrophysiology with direct measurements of extracellular adenosine using microelectrode biosensors in rat hippocampal slices.

Key results: We found that ethanol has bidirectional actions on adenosine signalling: depressant concentrations of ethanol (50 mM) increased the basal extracellular concentration of adenosine under baseline conditions, leading to the inhibition of synaptic transmission, but it inhibited adenosine release during evoked seizure activity in brain slices. The reduction in activity-dependent adenosine release was in part produced by effects on NMDA receptors, although other mechanisms also appeared to be involved. Low concentrations of ethanol (10-15 mM) enhanced pathological network activity by selectively blocking activity-dependent adenosine release.

Conclusions and implications: The complex dose-dependent actions of ethanol on adenosine signalling could in part explain the mixture of pro-convulsant and anticonvulsant actions of ethanol that have previously been reported.


Figures

Figure 1
Figure 1
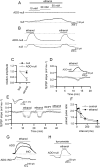
Effect of ethanol on biosensor properties. (A) Traces from an adenosine biosensor (ADO), null sensor and the ADO biosensor (null subtracted). Increasing concentrations of ethanol (10–50 mM) induced an upward shift in the baseline current on both null and ADO biosensor but had no effect on adenosine (10 μM) calibration currents. Subtraction of the null trace from the ADO biosensor trace removed the baseline shift. (B) Graph plotting the mean ratio of the ethanol‐induced current on ADO biosensor versus the null sensor against ethanol concentration (three ADO biosensor and null sensor pairs). (C) Trace from an ADO biosensor (null subtracted). Application of ethanol (50 mM for 25 min) had no effect on biosensor sensitivity to adenosine (10 μM).
Figure 2
Figure 2
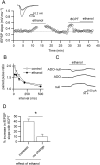
Ethanol increases extracellular adenosine concentration. (A) Example trace from an ADO biosensor (null subtracted) and null sensor that have been placed in area CA1. Ethanol induced a shift in ADO baseline current, which was removed by null subtraction. No net increase in the adenosine biosensor current was observed in 62% of slices. (B) Traces from an ADO biosensor (null subtracted) and null sensor. Ethanol (50 mM) induced an upward shift in the ADO baseline current that persisted after null subtraction. This was the case for 38% of slices. (C) Graph plotting the relative amplitude of currents induced by ethanol (50 mM) for first and second applications measured on the null sensor and the ADO biosensor (null subtracted). Currents were normalized to the amplitude of the current produced by the first application of ethanol. (D) Graph plotting fEPSP slope versus time for an individual slice. Ethanol (50 mM) reversibly decreased fEPSP slope. Inset, trace from an ADO biosensor (null subtracted). (E) Graph plotting fEPSP slope against time for an individual slice. The effect of ethanol (50 mM) was blocked by the A1 receptor antagonist 8CPT (2 μM). Inset, superimposed fEPSP averages in control and in ethanol. (F) Graph of paired pulse ratio against pulse interval in control and in 50 mM ethanol. Ethanol significantly increased the paired pulse ratio at short intervals (up to 100 ms but had no effect on intervals at 200 and 500 ms). (G) Superimposed current traces from an ADO and INO biosensor. Subtracting the scaled INO trace from ADO trace revealed an adenosine current in response to 50 mM ethanol. (H) Trace from an ADO biosensor (null subtracted). The glutamate receptor antagonist kynurenate (5 mM) did not prevent the ethanol (50 mM)‐induced current.
Figure 3
Figure 3
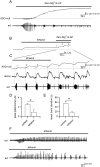
Ethanol can reduce basal A1 receptor continuous activation. (A) Graph plotting fEPSP slope against time for an individual slice. Ethanol (50 mM) reversibly increased fEPSP slope, which was blocked by the A1 receptor antagonist 8CPT (2 μM, the stimulus was reduced to return the fEPSP slope to control values before ethanol was applied). The gap in recording during the first ethanol application is for paired pulse recording. Inset, fEPSP averages in control, 50 mM ethanol and in wash. (B) The paired pulse data taken from (A) showing that ethanol reduces the paired pulse ratio at short intervals (up to 100 ms) but had little effect at longer intervals (n = 6). (C) Traces from an ADO biosensor with the null subtracted, ADO biosensor and null sensor. Ethanol (50 mM) induced a net downward shift in the ADO biosensor with null subtracted consistent with a fall in the extracellular concentration of adenosine. (D) Bar chart plotting the increase in fEPSP slope produced by 8CPT separated into those slices where ethanol enhanced fEPSP slope and those slices where ethanol had little effect (n = 9). *P< 0.05.
Figure 4
Figure 4
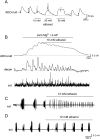
Ethanol pre‐incubation reduces adenosine release and changes seizure activity. Recordings from interleaved slices. (A) Control slice; ADO biosensor trace (null subtracted) and extracellular trace. Seizure activity induced with zero Mg2+ and 50 μM 4‐AP. (B) Slice was pre‐incubated in 50 mM ethanol before seizure activity. Ethanol induced an increase in the extracellular concentration of adenosine as shown by the upward shift in the baseline. (C) Expanded trace from (B) with adenosine‐release pulses deconvolved (time constant 560 s). Seizure activity increased extracellular adenosine concentration in both slices, but markedly less adenosine was released in the pre‐incubated slice (peak concentration after three bursts of activity, control 1.5 vs. 0.2 μM ethanol). This inhibition of adenosine release was partially reversed in wash with an increase in burst duration. (D) Bar‐chart summarizing peak concentrations of adenosine measured in control slices and slices incubated in ethanol (n = 6). (E) Bar chart summarizing mean burst duration measured in control slices and slices incubated in ethanol (n = 6). (F) Extracellular recordings from two interleaved slices that were pre‐incubated in 50 mM ethanol. The induced activity was continuous and not in isolated bursts until ethanol was washed out. *P<0.05.
Figure 5
Figure 5
Ethanol applied during established seizures inhibits adenosine release and changes network activity. (A) Traces from an adenosine biosensor (null subtracted), data deconvolved (decon, time constant 250 s) and network activity recorded with an extracellular electrode (ext). Ethanol (50 mM) inhibited adenosine release and changed the pattern of activity. Electrical stimulation (stim) released a greater amount of adenosine once ethanol was washed out. (B) Portions of the extracellular recording from (A, dotted boxes) illustrate how ethanol changed the pattern of activity. (C) Trace from an ADO biosensor (null subtracted) with network activity (ext) from a different hippocampal slice. Electrical stimulation (50 stimuli, 20 Hz at arrows) during a period of low network activity evoked adenosine release, which was reversibly inhibited by ethanol (50 mM).
Figure 6
Figure 6
Ethanol inhibits electrically stimulated adenosine release. (A) Graph summarizing effects of 50 mM ethanol on electrically stimulated adenosine release [open circles, individual experiments; filled circles, mean data (n = 15)]. Inset, adenosine biosensor traces from an individual experiment in control, ethanol and following wash. (B) Stimulated adenosine release‐events recorded with an adenosine biosensor in the presence of the A1 receptor antagonist 8CPT. Ethanol (50 mM) still inhibited adenosine release, an effect, which was reversed in wash. (C) Bar chart summarizing data from seven recordings where ethanol (50 mM) significantly (*P < 0.05) decreased adenosine release in the presence of 8CPT. (D) fEPSPs (from the start of trains of stimuli used to evoke adenosine release) were recorded at the same time as biosensor measurements. Although ethanol reversibly abolished adenosine release‐events, the fEPSPs increased in amplitude.
Figure 7
Figure 7
Ethanol inhibits an NMDA receptor‐dependent component of adenosine release. (A) Superimposed and normalized adenosine waveforms in control and in 10 mM ethanol. The waveform in ethanol has a faster decay than in control (decay fitted with single exponentials, τ = 220 and 69 s). Inset, waveforms from (A) superimposed but not normalized. (B) Graph summarizing the mean time constant for exponentials fitted to the decay of ADO biosensor waveforms in control and in ethanol (n = 5). (C) Example of an ADO biosensor trace (with null subtracted) where ethanol (50 mM) had no significant effect on stimulated‐adenosine release. Inset, expanded adenosine release event taken (*) with the decay fitted with a single exponential (τ = 62 s). (D) Adenosine waveforms in control and following application of L689560 (5 μM) to block NMDA receptors. The waveform decays are fitted with single exponentials (control τ = 320 s; L689,560 τ = 95 s). (E) Following L689,560 (5 μM) application, ethanol (50 mM) had little effect (mean reduction 7 ± 5%, no different to normal run down) on the stimulated release of adenosine.
Figure 8
Figure 8
Low concentrations of ethanol reduce adenosine release and modify seizure activity. (A) Trace from an ADO biosensor (null subtracted). Adenosine release was stimulated (20 Hz 50 stimuli, at asterisks). Ethanol (10 mM) inhibited adenosine release but did not increase the baseline current. Higher concentrations abolished adenosine release but also increased the extracellular concentration of adenosine. These effects were reversible upon wash. (B) Traces are shown from an adenosine biosensor (null subtracted), these data are deconvolved (time constant 250 s), and the extracellular activity was extracted from the biosensor. Ethanol (10 mM) reduced adenosine release and the interval between bursts. (C,D) Ethanol (12 mM) either changed extracellular activity (C) or had no effect (D).

Similar articles

Cited by

References

    1. Alexander SPH, Christopoulos A, Davenport AP, Kelly E, Marrion NV, Peters JA et al (2017a). The Concise Guide to PHARMACOLOGY 2017/18: G protein‐coupled receptors. Br J Pharmacol 174: S17–S129. - PMC - PubMed
    1. Alexander SPH, Striessnig J, Kelly E, Marrion NV, Peters JA, Faccenda E et al (2017b). The Concise Guide to PHARMACOLOGY 2017/18: Voltage‐gated ion channels. Br J Pharmacol 174: S160–S194. - PMC - PubMed
    1. Alexander SPH, Fabbro D, Kelly E, Marrion NV, Peters JA, Faccenda E et al (2017c). The Concise Guide to PHARMACOLOGY 2017/18: Enzymes. Br J Pharmacol 174: S272–S359. - PMC - PubMed
    1. Alexander SPH, Peters JA, Kelly E, Marrion NV, Faccenda E, Harding SD et al (2017d). The Concise Guide to PHARMACOLOGY 2017/18: Ligand‐gated ion channels. Br J Pharmacol 174: S130–S159. - PMC - PubMed
    1. Bettinger JC, Davies AG (2014). The role of the BK channel in ethanol response behaviours: evidence from model organism and human studies. Front Physiol 29: 346. - PMC - PubMed

Publication types

LinkOut - more resources