. 2018 Jan 24;6(1):103-115.e7.
doi: 10.1016/j.cels.2017.12.006. Epub 2018 Jan 18.

Integration of Multi-omics Data from Mouse Diversity Panel Highlights Mitochondrial Dysfunction in Non-alcoholic Fatty Liver Disease

Affiliations

Integration of Multi-omics Data from Mouse Diversity Panel Highlights Mitochondrial Dysfunction in Non-alcoholic Fatty Liver Disease

Karthickeyan Chella Krishnan et al. Cell Syst. .

Abstract

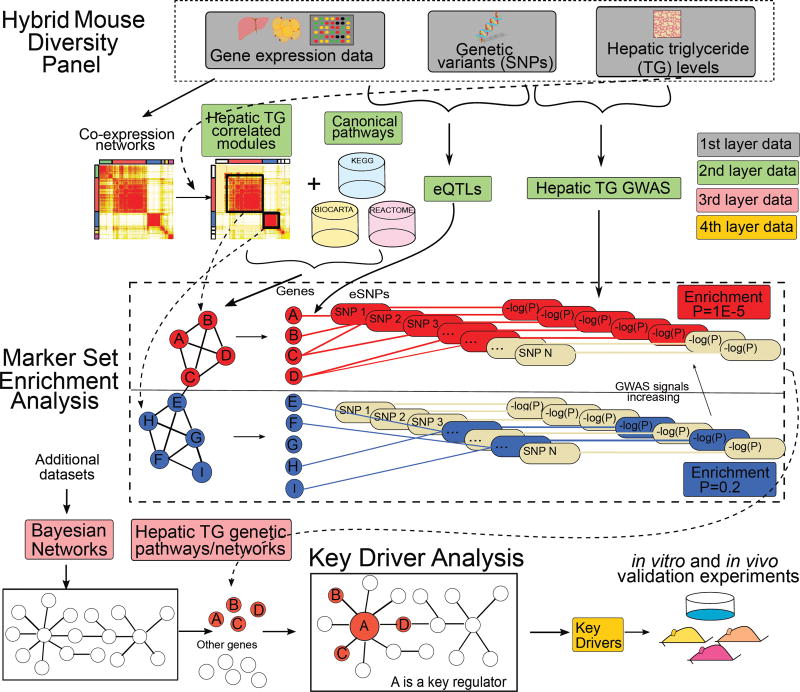
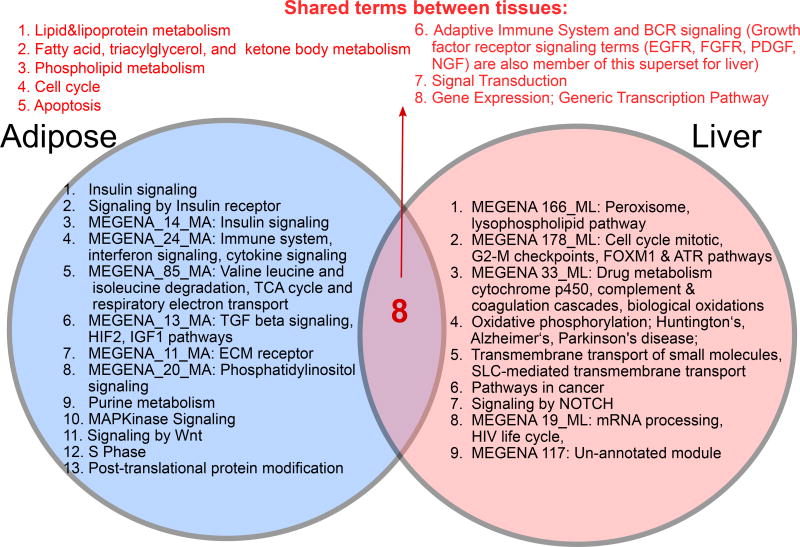
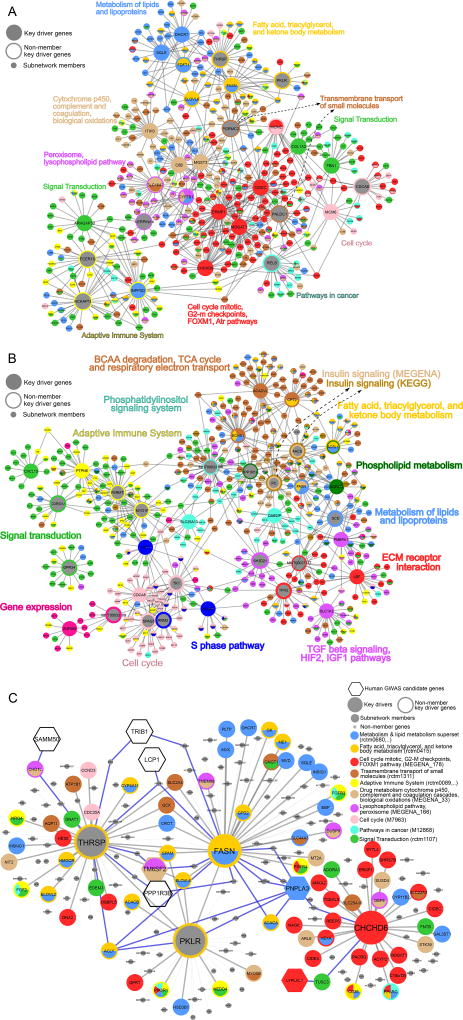
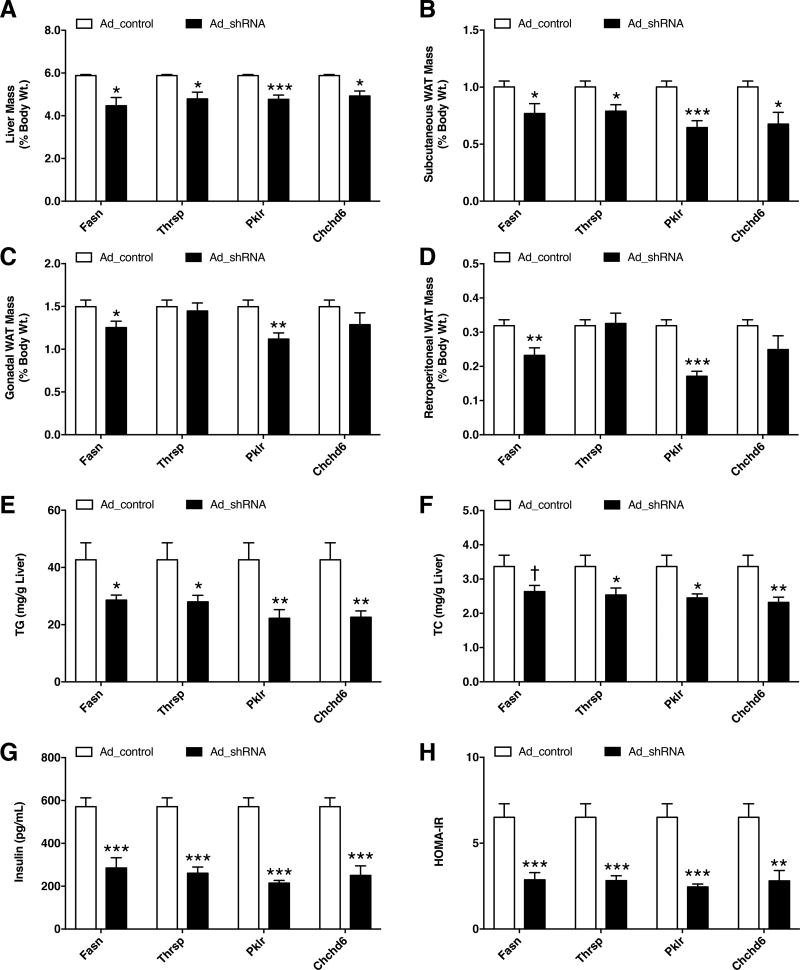
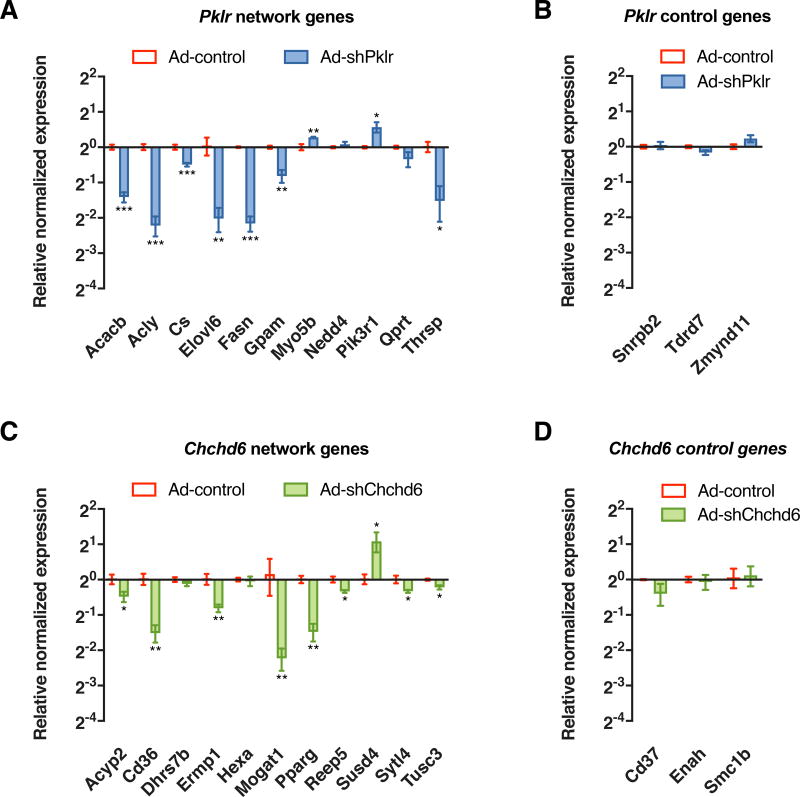
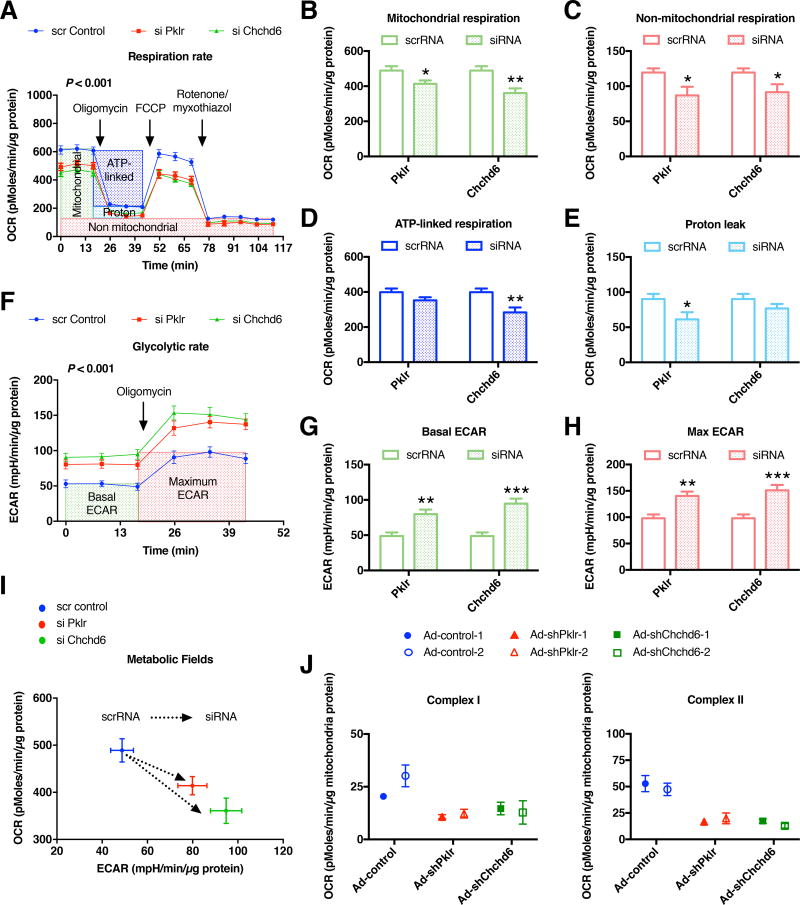
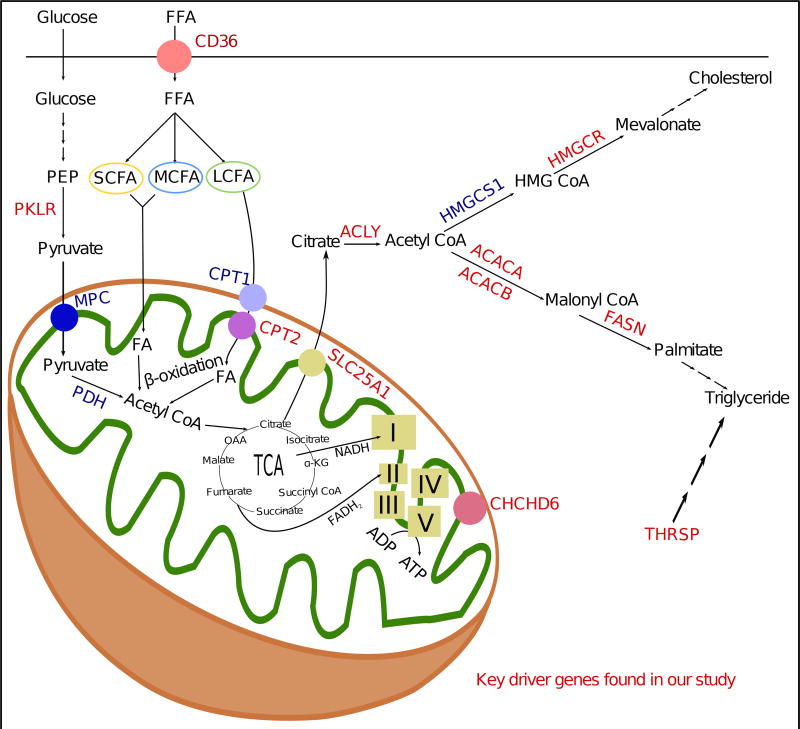
The etiology of non-alcoholic fatty liver disease (NAFLD), the most common form of chronic liver disease, is poorly understood. To understand the causal mechanisms underlying NAFLD, we conducted a multi-omics, multi-tissue integrative study using the Hybrid Mouse Diversity Panel, consisting of ∼100 strains of mice with various degrees of NAFLD. We identified both tissue-specific biological processes and processes that were shared between adipose and liver tissues. We then used gene network modeling to predict candidate regulatory genes of these NAFLD processes, including Fasn, Thrsp, Pklr, and Chchd6. In vivo knockdown experiments of the candidate genes improved both steatosis and insulin resistance. Further in vitro testing demonstrated that downregulation of both Pklr and Chchd6 lowered mitochondrial respiration and led to a shift toward glycolytic metabolism, thus highlighting mitochondria dysfunction as a key mechanistic driver of NAFLD.

Keywords: glycolysis; integrative genomics; key driver genes; mitochondrial dysfunction; mouse diversity panel; multi-omics integration; network modeling; non-alcoholic fatty liver disease; oxidative phosphorylation; systems biology.


Figures

Figure 1
Figure 1. Schematic diagram of the methodology
Liver and adipose tissue gene expression data, genotype, and hepatic TG phenotypic data of the Hybrid Mouse Diversity Panel (HMDP) mice were integrated to identify putative causal mechanisms for the NAFLD. TG: Triglyceride, eQTL: expression Quantitative Trait Loci; GWAS: genome-wide association studies.
Figure 2
Figure 2. Comparison between NAFLD processes between liver and adipose tissue
Putative causal pathways shared between tissues as well as those unique to each tissue are listed. For co-expression modules, the 5 most over-represented gene ontology terms are shown. See also Tables S1–S7 and Figure S1.
Figure 3
Figure 3. Bayesian gene subnetworks representative of NAFLD pathways and their key drivers
(A) Liver Bayesian subnetwork comprised of liver NAFLD supersets and the top 3 key drivers of each superset. (B) Adipose Bayesian subnetwork comprised of adipose NAFLD supersets and the top 3 key drivers of each superset. (C) Liver Bayesian subnetworks of selected genes Fasn, Thrsp, Pklr, and Chchd6. Key Driver (KD) genes are illustrated with large node sizes, human GWAS candidate genes are represented in hexagon shapes, and the rest of the genes are represented by medium node sizes. Member genes of each NAFLD-associated superset are indicated with a distinct color. Non-member genes are represented in grey with small node sizes. Blue edges show the interactions between human GWAS candidate genes and our candidate KDs. The other interactions were shown in grey. See also Table S8.
Figure 4
Figure 4. Effects of shRNA knockdown of KD genes on mouse phenotypes
Eight week old C57BL/6J mice were injected with adenovirus carrying either empty vector or shRNA against respective KD genes and fed with HF/HS diet for 14 days. Comparisons of (A–D) liver and three white adipose tissue (WAT) weights, (E) hepatic triglyceride (TG) levels, (F) hepatic total cholesterol (TC) levels, (G) plasma insulin levels and (H) HOMA-IR measurements between control and shRNA animal groups. Data are represented as mean ± SEM (n = 7–12 animals per group). P values were calculated by unpaired two-sided student’s t-test. †P < 0.10, *P < 0.05, **P < 0.01, ***P < 0.001. See also Figures S3 and S4.
Figure 5
Figure 5. Effects of shRNA knockdown of predicted KD genes on network neighborhood genes
Relative normalized expression values of neighborhood genes and distant genes (3-edges apart) of (A–B) Pklr and (C–D) Chchd6 network respectively, between control and shRNA animal groups after 14 days of infection. Data are represented as mean ± SEM (n = 4–5 animals per group). P values were calculated by unpaired two-sided student’s t-test. *P < 0.05, **P < 0.01, ***P < 0.001. See also Figure S3.
Figure 6
Figure 6. Knockdown of Pklr and Chchd6 affects both mitochondrial respiration and glycolysis
Bioenergetic studies on intact AML12 cells transfected with either scrRNA or siRNA against respective novel KD genes (Pklr and Chchd6) were analyzed. Comparisons of (A) oxygen consumption rate (OCR) profile, (B) mitochondrial (datapoint 14 subtracted from 3), (C) non-mitochondrial (datapoint 14), (D) ATP-linked (datapoint 6 subtracted from 3) and (E) proton leak (datapoint 14 subtracted from 6) associated respiration levels, (F) extracellular acidification rate (ECAR) profile, (G) basal ECAR (datapoint 3), (H) maximum ECAR (datapoint 6) levels and (I) overall metabolic profile between scrambled and siRNA groups. Data are represented as mean ± SEM. The experiment was repeated in two independent times with n = 4–8 wells per group each time. (J) Bioenergetic analyses on isolated liver mitochondria from mice injected with adenovirus carrying either empty vector or respective shRNA (n = 2 animals per group). Data are represented as mean ± SEM (n = 3–4 wells per data point). (A, F) P values were calculated by one-factor (time) repeated measures two-way ANOVA (time by treatment interaction P value). (B–E, G–H) P values were calculated by unpaired student’s t-test. *P < 0.05, **P < 0.01, ***P < 0.001. See also Figure S3.
Figure 7
Figure 7. Summary figure illustrating that a number of KD genes are linked to mitochondrial and metabolic pathways leading to hepatic triglyceride accumulation
KD genes including Fasn, Thrsp, Pklr and Chchd6 found in the current study are colored in red. I, II, III, IV and V correspond to respective electron transport chain (ETC) complexes. TCA: Tricarboxylic acid cycle; OAA: Oxaloacetate; FFA: free fatty acid.

Comment in

References

    1. Adams LA, Lymp JF, St Sauver J, Sanderson SO, Lindor KD, Feldstein A, Angulo P. The natural history of nonalcoholic fatty liver disease: a population-based cohort study. Gastroenterology. 2005;129:113–121. - PubMed
    1. Alpaydin E. Introduction to Machine Learning. The MIT Press; 2010.
    1. de Alwis NMW, Day CP. Non-alcoholic fatty liver disease: The mist gradually clears. J. Hepatol. 2008;48 - PubMed
    1. Arneson D, Bhattacharya A, Shu L, Mäkinen V-P, Yang X, Civelek M, Lusis A, Joyce A, Palsson B, Schadt E, et al. Mergeomics: a web server for identifying pathological pathways, networks, and key regulators via multidimensional data integration. BMC Genomics. 2016;17:722. - PMC - PubMed
    1. Begriche K, Igoudjil A, Pessayre D, Fromenty B. Mitochondrial dysfunction in NASH: Causes, consequences and possible means to prevent it. Mitochondrion. 2006;6:1–38. - PubMed

MeSH terms

Substances