

Scikit-ribo Enables Accurate Estimation and Robust Modeling of Translation Dynamics at Codon Resolution
- PMID: 29361467
- PMCID: PMC5832574
- DOI: 10.1016/j.cels.2017.12.007
Scikit-ribo Enables Accurate Estimation and Robust Modeling of Translation Dynamics at Codon Resolution
Abstract
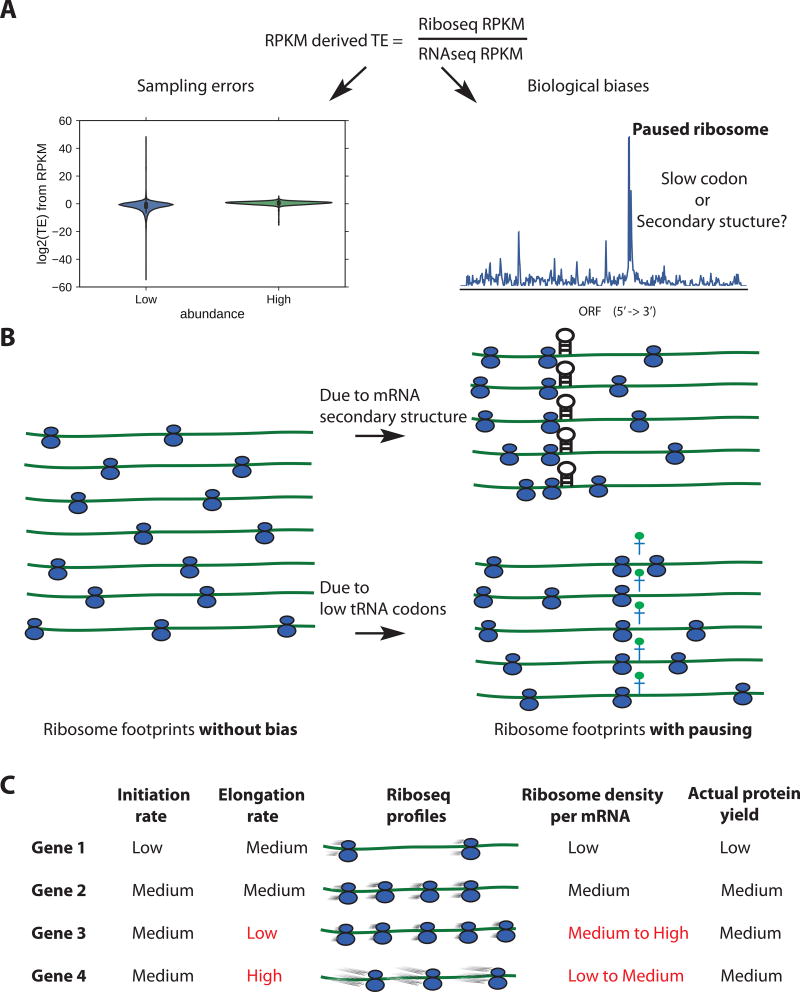
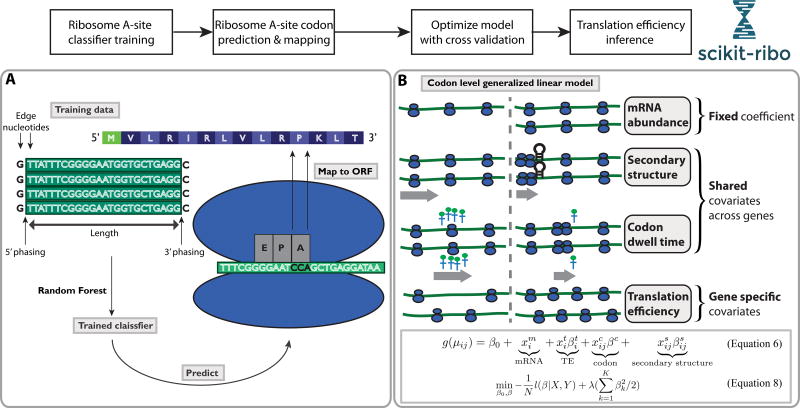
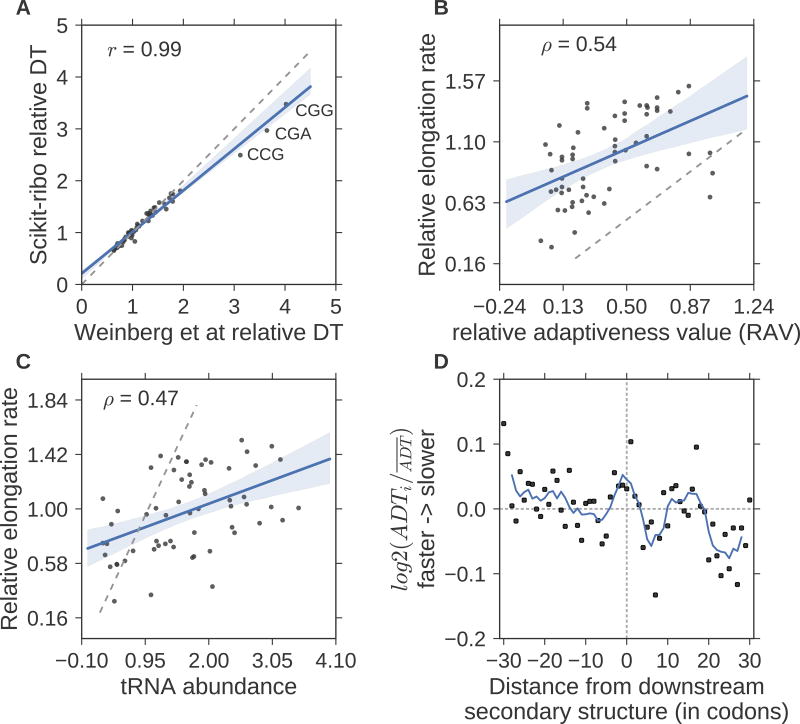
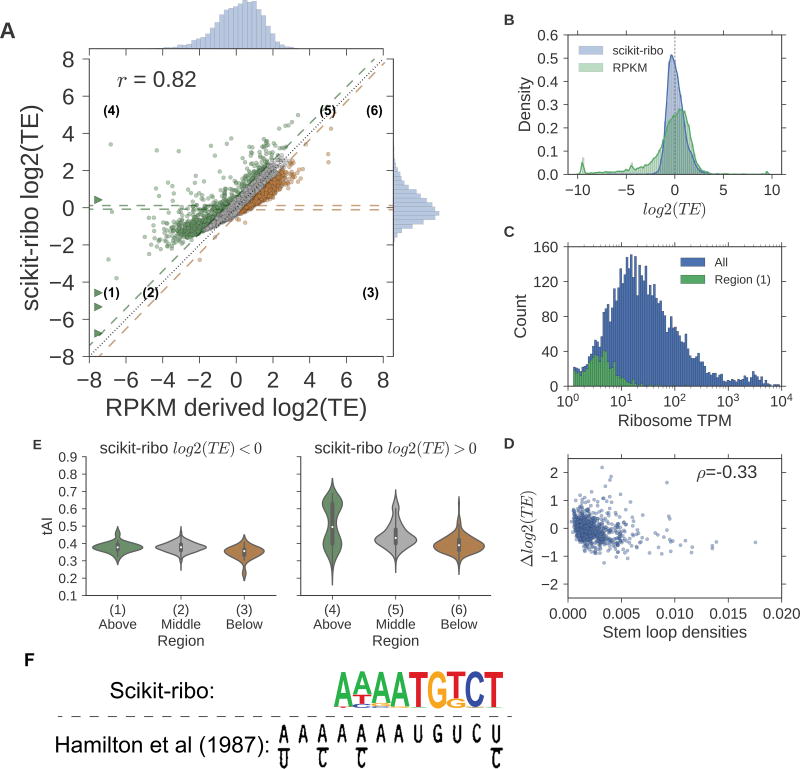
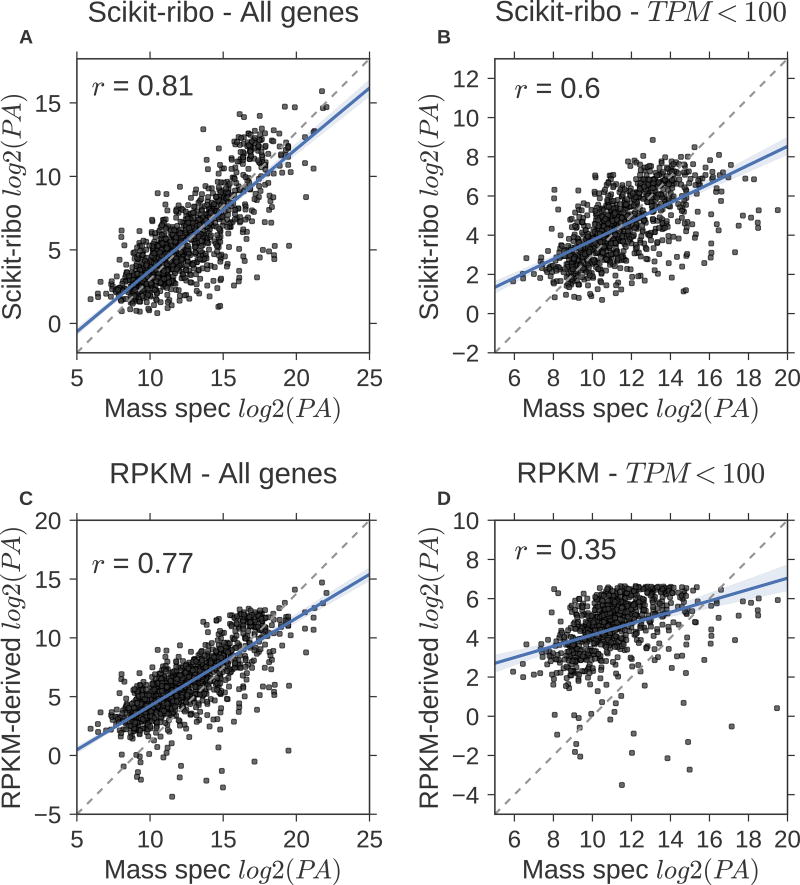
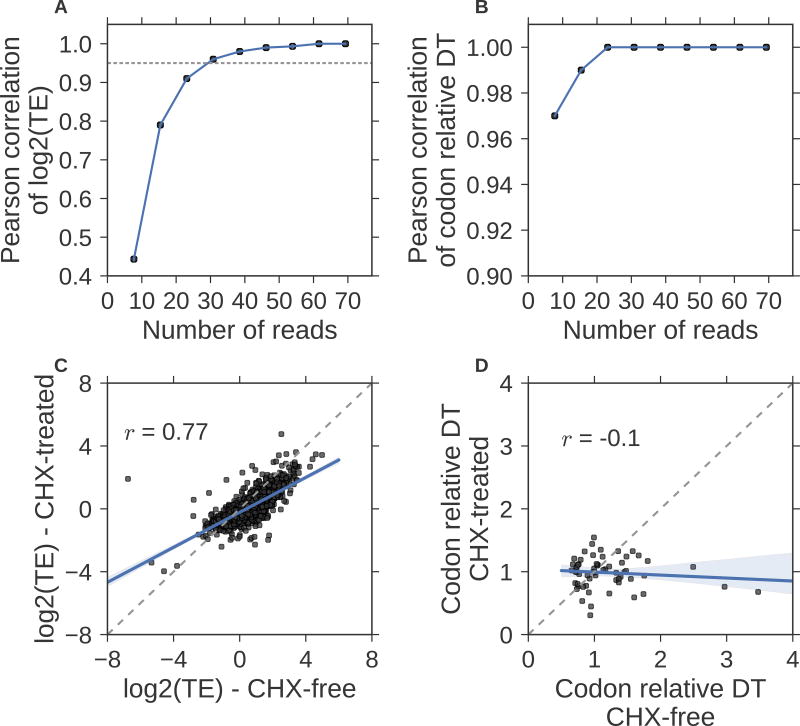
Ribosome profiling (Ribo-seq) is a powerful technique for measuring protein translation; however, sampling errors and biological biases are prevalent and poorly understood. Addressing these issues, we present Scikit-ribo (https://github.com/schatzlab/scikit-ribo), an open-source analysis package for accurate genome-wide A-site prediction and translation efficiency (TE) estimation from Ribo-seq and RNA sequencing data. Scikit-ribo accurately identifies A-site locations and reproduces codon elongation rates using several digestion protocols (r = 0.99). Next, we show that the commonly used reads per kilobase of transcript per million mapped reads-derived TE estimation is prone to biases, especially for low-abundance genes. Scikit-ribo introduces a codon-level generalized linear model with ridge penalty that correctly estimates TE, while accommodating variable codon elongation rates and mRNA secondary structure. This corrects the TE errors for over 2,000 genes in S. cerevisiae, which we validate using mass spectrometry of protein abundances (r = 0.81), and allows us to determine the Kozak-like sequence directly from Ribo-seq. We conclude with an analysis of coverage requirements needed for robust codon-level analysis and quantify the artifacts that can occur from cycloheximide treatment.
Keywords: Ribo-seq; bioinformatics; machine learning; statistical method; translation.
Copyright © 2017 Elsevier Inc. All rights reserved.
Figures
Similar articles
-
RiboDiPA: a novel tool for differential pattern analysis in Ribo-seq data.Nucleic Acids Res. 2020 Dec 2;48(21):12016-12029. doi: 10.1093/nar/gkaa1049. Nucleic Acids Res. 2020. PMID: 33211868 Free PMC article.
-
Assessing Ribosome Distribution Along Transcripts with Polarity Scores and Regression Slope Estimates.Methods Mol Biol. 2021;2252:269-294. doi: 10.1007/978-1-0716-1150-0_13. Methods Mol Biol. 2021. PMID: 33765281
-
DeepShape: estimating isoform-level ribosome abundance and distribution with Ribo-seq data.BMC Bioinformatics. 2019 Dec 20;20(Suppl 24):678. doi: 10.1186/s12859-019-3244-0. BMC Bioinformatics. 2019. PMID: 31861979 Free PMC article.
-
Tracing Translational Footprint by Ribo-Seq: Principle, Workflow, and Applications to Understand the Mechanism of Human Diseases.Cells. 2022 Sep 23;11(19):2966. doi: 10.3390/cells11192966. Cells. 2022. PMID: 36230928 Free PMC article. Review.
-
Beyond Read-Counts: Ribo-seq Data Analysis to Understand the Functions of the Transcriptome.Trends Genet. 2017 Oct;33(10):728-744. doi: 10.1016/j.tig.2017.08.003. Epub 2017 Sep 5. Trends Genet. 2017. PMID: 28887026 Review.
Cited by
-
A critical period of translational control during brain development at codon resolution.Nat Struct Mol Biol. 2022 Dec;29(12):1277-1290. doi: 10.1038/s41594-022-00882-9. Epub 2022 Dec 8. Nat Struct Mol Biol. 2022. PMID: 36482253 Free PMC article.
-
What determines eukaryotic translation elongation: recent molecular and quantitative analyses of protein synthesis.Open Biol. 2020 Dec;10(12):200292. doi: 10.1098/rsob.200292. Epub 2020 Dec 9. Open Biol. 2020. PMID: 33292102 Free PMC article. Review.
-
Genome-Wide Analysis of Actively Translated Open Reading Frames Using RiboTaper/ORFquant.Methods Mol Biol. 2021;2252:331-346. doi: 10.1007/978-1-0716-1150-0_16. Methods Mol Biol. 2021. PMID: 33765284
-
Accurate design of translational output by a neural network model of ribosome distribution.Nat Struct Mol Biol. 2018 Jul;25(7):577-582. doi: 10.1038/s41594-018-0080-2. Epub 2018 Jul 2. Nat Struct Mol Biol. 2018. PMID: 29967537 Free PMC article.
-
Codon stabilization coefficient as a metric to gain insights into mRNA stability and codon bias and their relationships with translation.Nucleic Acids Res. 2019 Mar 18;47(5):2216-2228. doi: 10.1093/nar/gkz033. Nucleic Acids Res. 2019. PMID: 30698781 Free PMC article.
References
-
- Archer SK, Shirokikh NE, Beilharz TH, Preiss T. Dynamics of ribosome scanning and recycling revealed by translation complex profiling. Nature. 2016;535:570–574. - PubMed
-
- Balakumar BJ, Fang Han, Hastie Trevor, Friedman Jerome H, Tibshirani Rob, Simon Noah. Glmnet in Python (Zenodo) 2017
-
- Bray NL, Pimentel H, Melsted P, Pachter L. Near-optimal probabilistic RNA-seq quantification. Nat Biotechnol. 2016;34:525–527. - PubMed
MeSH terms
Substances
Grants and funding
LinkOut - more resources
Full Text Sources
Other Literature Sources
Molecular Biology Databases
