. 2018 Feb 22;131(4):jcs209098.
doi: 10.1242/jcs.209098.

Septins are involved at the early stages of macroautophagy in S. cerevisiae

Affiliations

Septins are involved at the early stages of macroautophagy in S. cerevisiae

Gaurav Barve et al. J Cell Sci. .

Abstract

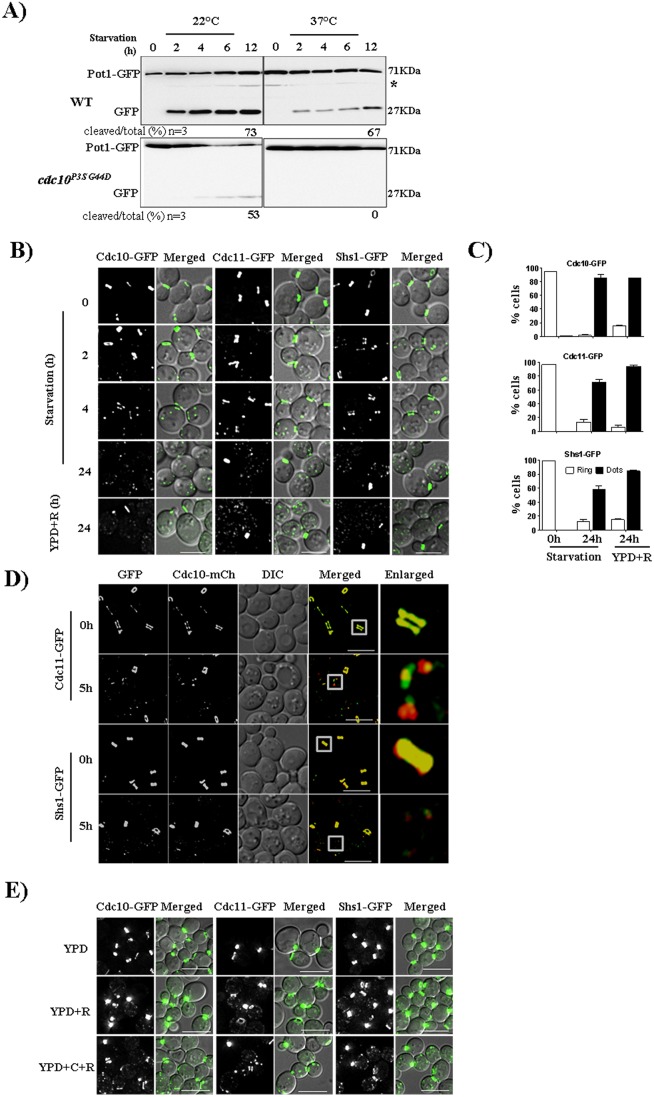
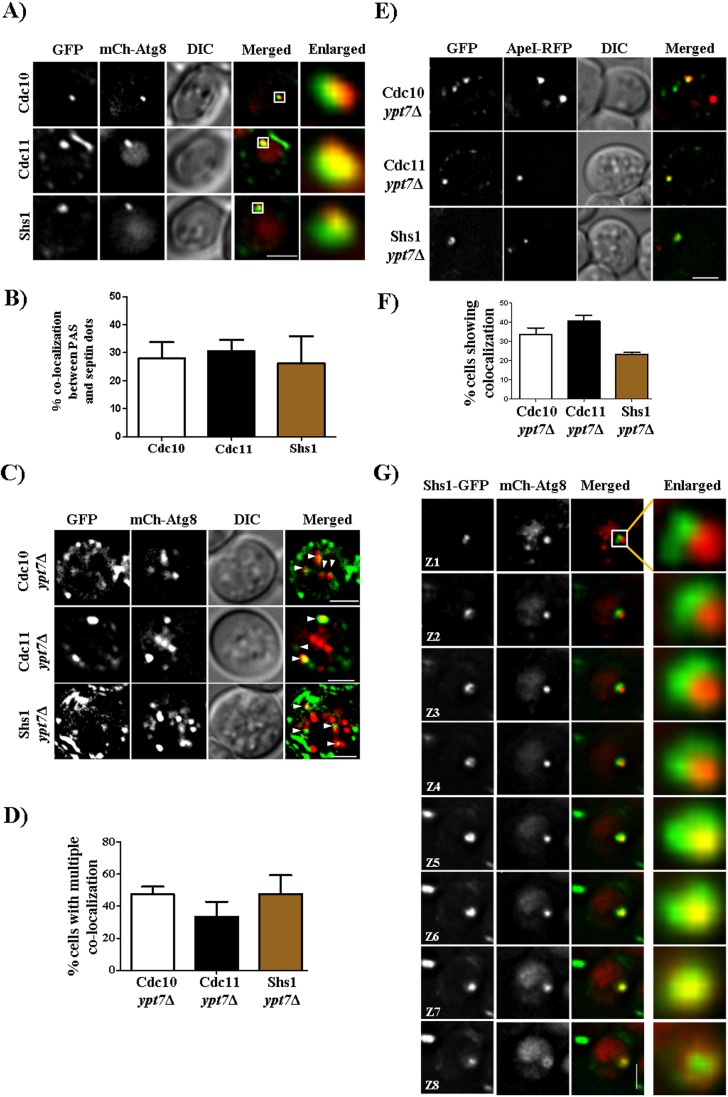
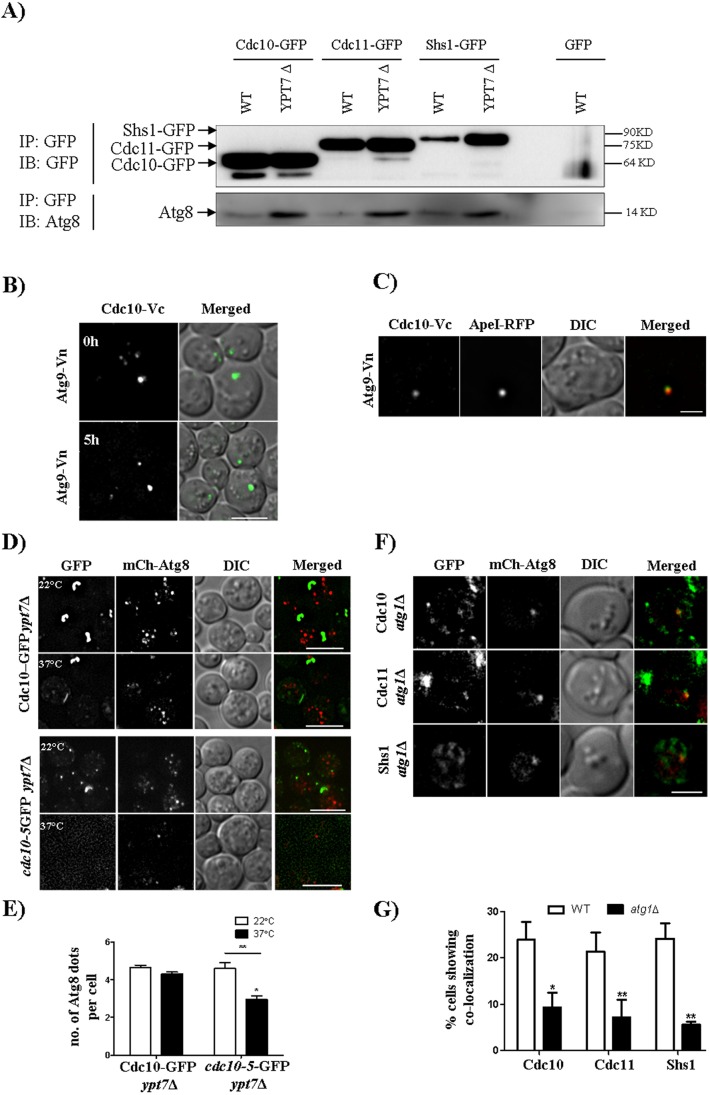
Autophagy is a conserved cellular degradation pathway wherein double-membrane vesicles called autophagosomes capture long-lived proteins, and damaged or superfluous organelles, and deliver them to the lysosome for degradation. Septins are conserved GTP-binding proteins involved in many cellular processes, including phagocytosis and the autophagy of intracellular bacteria, but no role in general autophagy was known. In budding yeast, septins polymerize into ring-shaped arrays of filaments required for cytokinesis. In an unbiased genetic screen and in subsequent targeted analysis, we found autophagy defects in septin mutants. Upon autophagy induction, pre-assembled septin complexes relocalized to the pre-autophagosomal structure (PAS) where they formed non-canonical septin rings at PAS. Septins also colocalized with autophagosomes, where they physically interacted with the autophagy proteins Atg8 and Atg9. When autophagosome degradation was blocked in septin-mutant cells, fewer autophagic structures accumulated, and an autophagy mutant defective in early stages of autophagosome biogenesis (atg1Δ), displayed decreased septin localization to the PAS. Our findings support a role for septins in the early stages of budding yeast autophagy, during autophagosome formation.This article has an associated First Person interview with the first author of the paper.

Keywords: Atg9 trafficking; Autophagosome biogenesis; Autophagy; Noncanonical ring; PAS; Pre-autophagosomal structure; Septin.


Conflict of interest statement

Competing interestsThe authors declare no competing or financial interests.

Figures

Fig. 1.
Fig. 1.
Septins migrate from the pre-existing bud-neck ring to cytoplasm during starvation. (A) Pexophagy was affected in cdc10P3SG44D (cdc10-5) cells as compared to WT cells at the non-permissive temperature (37°C). (B) Microscopy images of Cdc10–GFP, Cdc11–GFP and Shs1–GFP cells under nutrient rich, nutrient deficient and rapamycin (0.4 µg/ml) treatment conditions. Cells from log phase (0.6 to 0.8 OD) were transferred to starvation medium (1 OD/ml) and imaged at different time points. (C) Quantification of the number of cells showing rings and puncta grown in rich, starvation or rapamycin treatment medium for 24 h. For quantification, cells showing only ring or only dots were considered. Images acquired were converted into maximum intensity projections, deconvolved and a total of 100 cells were quantified. (D) Cdc10, Cdc11 and Shs1 all colocalize as puncta during starvation. Strains JTY5396 and JTY5397 were grown as in B and imaged. (E) Septin localization in presence of cycloheximide (C) and rapamycin (R). Cells were grown as described in Fig. 1B in presence of cycloheximide (50 µg/ml) and rapamycin (YPD+C+R) and in presence of rapamycin (0.4 µg/ml) alone (YPD+R). Scale bars: 5 µm.
Fig. 2.
Fig. 2.
Septins colocalize with autophagosomes and form ring like structures. (A) Septins colocalize with the mCherry–Atg8 (mCh-Atg8)-labeled PAS. Cells were grown as described in Fig. 1B and imaged. All images are of a single z-section and are deconvolved. (B) Quantification of the number of PASs that colocalize with septins. More than 300 cells were counted. From these cells, only 20–30% cells showed a PAS and cells that showed colocalization between the PAS and septin dot were quantified. Quantification was performed manually by using the cell counter plugin of Fiji at every z-section. (C) Representative images showing colocalization of septins and autophagosomes (autophagosomes are highlighted by white arrowheads). Cells were grown as in Fig. 1B and were imaged. (D) Quantification of the number of cells showing multiple colocalizations between septins and mCherry–Atg8 puncta. For quantification, images were deconvolved and background subtracted, and then colocalization was checked by using the colocalization highlighter plugin. Colocalized points were then quantified by using the cell counter plugin of Fiji. More than 150 cells were quantified. (E) Colocalization of septins with Ape1–RFP. Cdc10-GFP, Cdc11–GFP and Shs1–GFP ypt7Δ cells expressing Ape1–RFP were grown as in Fig. 1B and imaged. (F) Quantification of the number of septin puncta colocalized with Ape1–RFP puncta. (G) Formation of a non-canonical ring around mCherry–Atg8 by Shs1–GFP. Cells were grown as in Fig. 1B and were imaged. Eight z-sections of the same image at 0.2 µm each are shown. Scale bars: 2 µm.
Fig. 3.
Fig. 3.
Septins are involved in autophagosomes biogenesis. (A) Western blot showing the septin–Atg8 interaction in WT and in ypt7Δ strains expressing Cdc10–GFP, Cdc11–GFP and Shs1–GFP. Cells were grown as described in the Materials and Methods. IB, immunoblot; IP, immunoprecipitation. (B,C) BiFC experiments. A strain expressing Cdc10-Vc (Cdc10 C-terminus tagged with C-terminus of Venus) and Atg9-Vn (Atg9 C-terminus tagged with N-terminus of Venus) with or without Ape1–RFP was grown as described in Fig. 1B and imaged after 5 h of incubation in starvation medium. (D) Representative images and (E) quantification showing autophagosome number per cell at 37°C. All the images are maximum intensity projections, and more than 50 cells were quantified manually with Fiji. *P<0.05 (comparison between non-Ts and Ts at 37°C); **P<0.01 (comparison between 22°C and 37°C in Ts) (two-way ANOVA). (F) Representative images and (G) quantification of colocalization events between mCherry–Atg8 and the three GFP-tagged septins in the atg1Δ strain. A total of 50 cells were quantified manually at every z-plane. *P<0.05 for Cdc10–GFP, **P<0.01 for Cdc11–GFP and Shs1–GFP (two-way ANOVA). Scale bars: 2 µm (C,F); 5 µm (B,D).
Fig. 4.
Fig. 4.
Septins colocalize with Atg9 and play a role in Atg9 retrograde transport. (A) Representative images showing colocalization between septins and Atg9. Cdc10–GFP, Cdc11–GFP and Shs1–GFP cells expressing Atg9–mCherry (Atg9-mCh) were grown as in Fig. 1B and were imaged. (B) Quantification of the number of cells showing colocalization between septins and Atg9–mCherry puncta. Quantification was performed as in Fig. 3G. More than 150 cells were quantified. (C) Atg9 retrograde transport is affected in the cdc10-5 strain at 37°C. Cells were grown in starvation medium for 6 h and were imaged. (D) Quantification of the number of cells showing a bright Atg9 punctum at 22°C (permissive temperature) and 37°C (non-permissive temperature). Quantification was performed manually by using Fiji software, and a total of 50 cells were quantified in each of the three experiments. ***P<0.001, 22°C versus 37°C in WT and cdc10-5 cells (two-way ANOVA). (E) Quantification of the number of cells showing colocalization between the bright GFP–Atg9 punctum and Ape1–RFP. Quantification was performed manually by using Fiji software at each z-section, and a total of 30 cells were quantified in each of the three experiments. ***P<0.001, atg1Δ versus cdc10-5 cells (unpaired t-test.). (F) Colocalization between GFP–Atg9 and mCherry–Atg8, and GFP–Atg8 and Ape1–RFP. The cdc10-5 cells expressing either GFP–Atg9 with mCherry–Atg8 or GFP–Atg8 with Ape1–RFP were grown in SD Ura or SD −His −Ura medium at 22°C. Logarithmically growing cells were then incubated in starvation medium (1 OD/ml) for 3 h at 22°C and 37°C. (G) Quantitation of the colocalization of GFP–Atg9 and mCherry–Atg8 puncta with GFP–Atg8 and Ape1–RFP puncta. 30 cells were quantified in each of the three experiments. **P<0.01 (paired t-test). Scale bars: 2 µm (A,F); 5 µm (C).

References

    1. Baba M., Takeshige K., Baba N. and Ohsumi Y. (1994). Ultrastructural analysis of the autophagic process in yeast: detection of autophagosomes and their characterization. J. Cell Biol. 124, 903-913. 10.1083/jcb.124.6.903 - DOI - PMC - PubMed
    1. Baudin A., Ozier-Kalogeropoulos O., Denouel A., Lacroute F. and Cullin C. (1993). A simple and efficient method for direct gene deletion in Saccharomyces cerevisiae. Nucleic Acids Res. 21, 3329-3330. 10.1093/nar/21.14.3329 - DOI - PMC - PubMed
    1. Bridges A. A., Jentzsch M. S., Oakes P. W., Occhipinti P. and Gladfelter A. S. (2016). Micron-scale plasma membrane curvature is recognized by the septin cytoskeleton. J. Cell Biol. 213, 23-32. 10.1083/jcb.201512029 - DOI - PMC - PubMed
    1. Chan T. F., Carvalho J., Riles L. and Zheng X. F. S. (2000). A chemical genomics approach toward understanding the global functions of the target of rapamycin protein (TOR). Proc. Natl. Acad. Sci. USA 97, 13227-13232. 10.1073/pnas.240444197 - DOI - PMC - PubMed
    1. Cheong H. and Klionsky D. J. (2008). Biochemical methods to monitor autophagy-related processes in yeast. Methods Enzymol. 451, 1-26. 10.1016/S0076-6879(08)03201-1 - DOI - PubMed

Publication types

MeSH terms

LinkOut - more resources