. 2018 Feb 7;145(3):dev158501.
doi: 10.1242/dev.158501.

Integrated analysis of single-cell embryo data yields a unified transcriptome signature for the human pre-implantation epiblast

Affiliations

Integrated analysis of single-cell embryo data yields a unified transcriptome signature for the human pre-implantation epiblast

Giuliano G Stirparo et al. Development. .

Erratum in

Abstract

Single-cell profiling techniques create opportunities to delineate cell fate progression in mammalian development. Recent studies have provided transcriptome data from human pre-implantation embryos, in total comprising nearly 2000 individual cells. Interpretation of these data is confounded by biological factors, such as variable embryo staging and cell-type ambiguity, as well as technical challenges in the collective analysis of datasets produced with different sample preparation and sequencing protocols. Here, we address these issues to assemble a complete gene expression time course spanning human pre-implantation embryogenesis. We identify key transcriptional features over developmental time and elucidate lineage-specific regulatory networks. We resolve post-hoc cell-type assignment in the blastocyst, and define robust transcriptional prototypes that capture epiblast and primitive endoderm lineages. Examination of human pluripotent stem cell transcriptomes in this framework identifies culture conditions that sustain a naïve state pertaining to the inner cell mass. Our approach thus clarifies understanding both of lineage segregation in the early human embryo and of in vitro stem cell identity, and provides an analytical resource for comparative molecular embryology.

Keywords: Embryo; Human; Pluripotency; RNA-seq; Single cell.


Conflict of interest statement

Competing interestsG.G. and A.S. are inventors on a patent filing by the University of Cambridge relating to human naïve pluripotent stem cells.

Figures

Fig. 1.
Fig. 1.
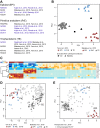
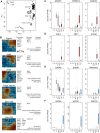
Embryo lineage classification. (A) PCA of E6 and E7 samples based on the most variable genes (n=1294, log2 FPKM>2, log CV2>0.5), coloured according to cell type classification by Petropoulos et al. (2016). (B) Genes contributing to the first and second principal components. (C) PCA of E6 and E7 immunosurgery samples from Petropoulos et al. based on variable genes (n=1131, log2 FPKM>2, log CV2>0.5). Colours are scaled to the ratio of NANOG (EPI) to PDGRA (PrE) expression. (D) Lineage assignments of E6 and E7 immunosurgery samples according to Petropoulos et al. (E) Relative percentages of EPI, PrE and TE cells from embryos processed by immunosurgery as reported by Petropoulos et al.
Fig. 2.
Fig. 2.
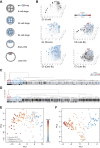
Lineage segregation based on marker genes. (A) Panel of 12 high-confidence markers for EPI, PrE and TE. Publications with immunofluorescence data showing protein expression in the human blastocyst are highlighted in blue. A subset of TE cells express CDX2 in human (Chen et al., 2009; Niakan and Eggan, 2013). (B) PCA of embryo cells profiled in the Yan and Blakeley studies based on lineage markers. (C) Hierarchical clustering of Yan and Blakeley datasets. (D,E) PCA of EPI, PrE and TE with E6 and E7 Petropoulos immunosurgery samples (grey) based on common variable genes (n=188, log2 FPKM>2, log CV2>0.5) (D) or based on lineage markers (E).
Fig. 3.
Fig. 3.
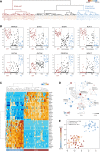
Identification of late ICM cells. (A) Schematic of pre-implantation development from the 8-cell stage according to published immunofluorescence assays (Niakan and Eggan, 2013). Colours depict POU5F1 localisation typical of each stage. (B) PCA of Petropoulos samples based on variable genes (log2 FPKM>2, log CV2>0) according to embryonic day. Colours represent log2 POU5F1 expression. (C,D) Dendrograms of E6 (C) and E7 (D) Petropoulos samples derived from the third principal component in B, indicating POU5F1 expression. POU5F1-high and POU5F1-medium clusters are highlighted in red and blue, respectively. Bars indicate individual cells with those recovered by immunosurgery indicated in black. (E) PCA of Petropoulos samples based on common variable genes (n=170, log2 FPKM>2, log CV2>0.5) with high and medium POU5F1 levels as selected in C and D, together with EPI and PrE cells from Yan and Blakeley datasets. (F) PCA based on marker genes as described in E.
Fig. 4.
Fig. 4.
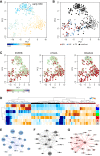
Selection and characterisation of EPI and PrE cells. (A) Cluster dendrogram of POU5F1-high and POU5F1-medium late ICM cells, selected based on the first and second principal components from the analysis shown in Fig. 3F. Sample colours are scaled to the ratio of NANOG to PDGFRA expression. (B) Single-cell dot plots showing log2 FPKM values of the genes indicated. Cells are ordered along the x-axis to correspond to the dendrogram in A. (C) Two-way clustering of the top 20 genes up- and downregulated between EPI and PrE samples. (D) Network of biological processes enriched for genes modulated between EPI and PrE. Nodes represent processes; edge weight reflects the degree of intersection between gene lists. Node size is proportional to the number of contributing genes and colours reflect the ratio between those up- and downregulated. (E) t-SNE plot for EPI and PrE cells. Sample colours are scaled to the ratio of NANOG to PDGFRA expression.
Fig. 5.
Fig. 5.
Identification of early ICM and WGNCA analysis of lineage segregation. (A-C) PCA based on highly variable genes (n=203, log2 FPKM>2, log CV2>1) for Petropoulos E5 cells. Samples are coloured by pseudotime (A), lineage classification according to Petropoulos et al. (B) and absolute expression in log2 FPKM for early ICM markers in the common marmoset and rhesus macaque (C). BL, blastocyst. (D) Two-way clustering of eigengene values as computed by WGCNA. The first three major branches corresponded to PrE (Module 1), early ICM (Module 5) and EPI (Module 4). (E-G) Networks of highly co-regulated genes in PrE (E), early ICM (F) and EPI (G) lineages. Node sizes are proportional to absolute fold change in expression between EPI and PrE or to absolute expression for early ICM. Edge thickness reflects the number of co-regulated genes between adjacent nodes.
Fig. 6.
Fig. 6.
WGCNA and global analysis of human pre-implantation development. (A) PCA of zygote, 4-cell, 8-cell and compacted morula samples from the Yan dataset combined with our selection of early ICM cells from Petropoulos et al. and the refined subset of EPI and PrE from all three studies. (B) Self-organising maps of selected transcription factors, chromatin modifiers and significant biological processes across developmental stages. (C-F) Expression in FPKM of selected markers for early EPI (C), late EPI (D), early PrE (E) and late PrE (F).
Fig. 7.
Fig. 7.
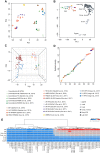
Comparison of human pluripotent cell lines with embryonic stages. (A) PCA based on highly variable genes (n=1760, log2 FPKM>2, log CV2>0.5). (B) PCA based on global gene expression for all pre-implantation stages and PSC cultures. (C) PCA of late blastocyst stages (red, EPI; blue, PrE) and PSC cultures. (D) Fraction of identity of PSC cultures to EPI cells. Similarity between cultured PSCs and all pre-implantation embryo stages was computed by quadratic programming; plotted is the fraction identity of PSCs to EPI, with samples sorted accordingly. (E) Clustering of Pearson correlation of genes differentially expressed between naïve and conventional PSCs to embryo stages and lineages (n=2860, adjusted P<0.001, absolute log2 fold change>1.5).

References

    1. Anders S., Pyl P. T. and Huber W. (2015). HTSeq–a Python framework to work with high-throughput sequencing data. Bioinformatics 31, 166-169. 10.1093/bioinformatics/btu638 - DOI - PMC - PubMed
    1. Angerer P., Haghverdi L., Büttner M., Theis F. J., Marr C. and Buettner F. (2016). Destiny: diffusion maps for large-scale single-cell data in R. Bioinformatics 32, 1241-1243. 10.1093/bioinformatics/btv715 - DOI - PubMed
    1. Artus J., Piliszek A. and Hadjantonakis A.-K. (2011). The primitive endoderm lineage of the mouse blastocyst: sequential transcription factor activation and regulation of differentiation by Sox17. Dev. Biol. 350, 393-404. 10.1016/j.ydbio.2010.12.007 - DOI - PMC - PubMed
    1. Blakeley P., Fogarty N. M. E., Del Valle I., Wamaitha S. E., Hu T. X., Elder K., Snell P., Christie L., Robson P. and Niakan K. K. (2015). Defining the three cell lineages of the human blastocyst by single-cell RNA-seq. Development 142, 3151-3165. 10.1242/dev.123547 - DOI - PMC - PubMed
    1. Boroviak T., Loos R., Lombard P., Okahara J., Behr R., Sasaki E., Nichols J., Smith A. and Bertone P. (2015). Lineage-specific profiling delineates the emergence and progression of naive pluripotency in mammalian embryogenesis. Dev. Cell 35, 366-382. 10.1016/j.devcel.2015.10.011 - DOI - PMC - PubMed

Publication types

MeSH terms

Substances