. 2018 Feb 23;145(4):dev161075.
doi: 10.1242/dev.161075.

TCF7L1 suppresses primitive streak gene expression to support human embryonic stem cell pluripotency

Affiliations

TCF7L1 suppresses primitive streak gene expression to support human embryonic stem cell pluripotency

Robert A Sierra et al. Development. .

Abstract

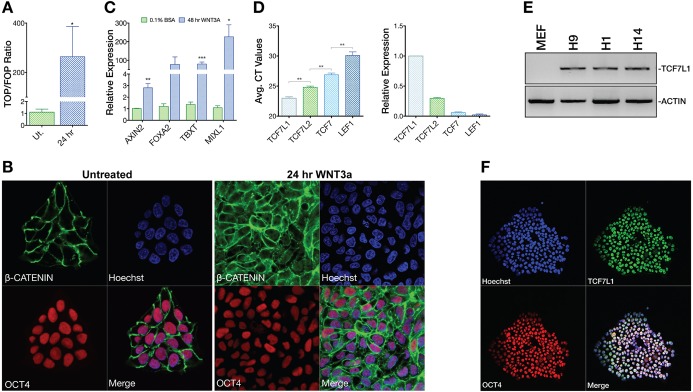
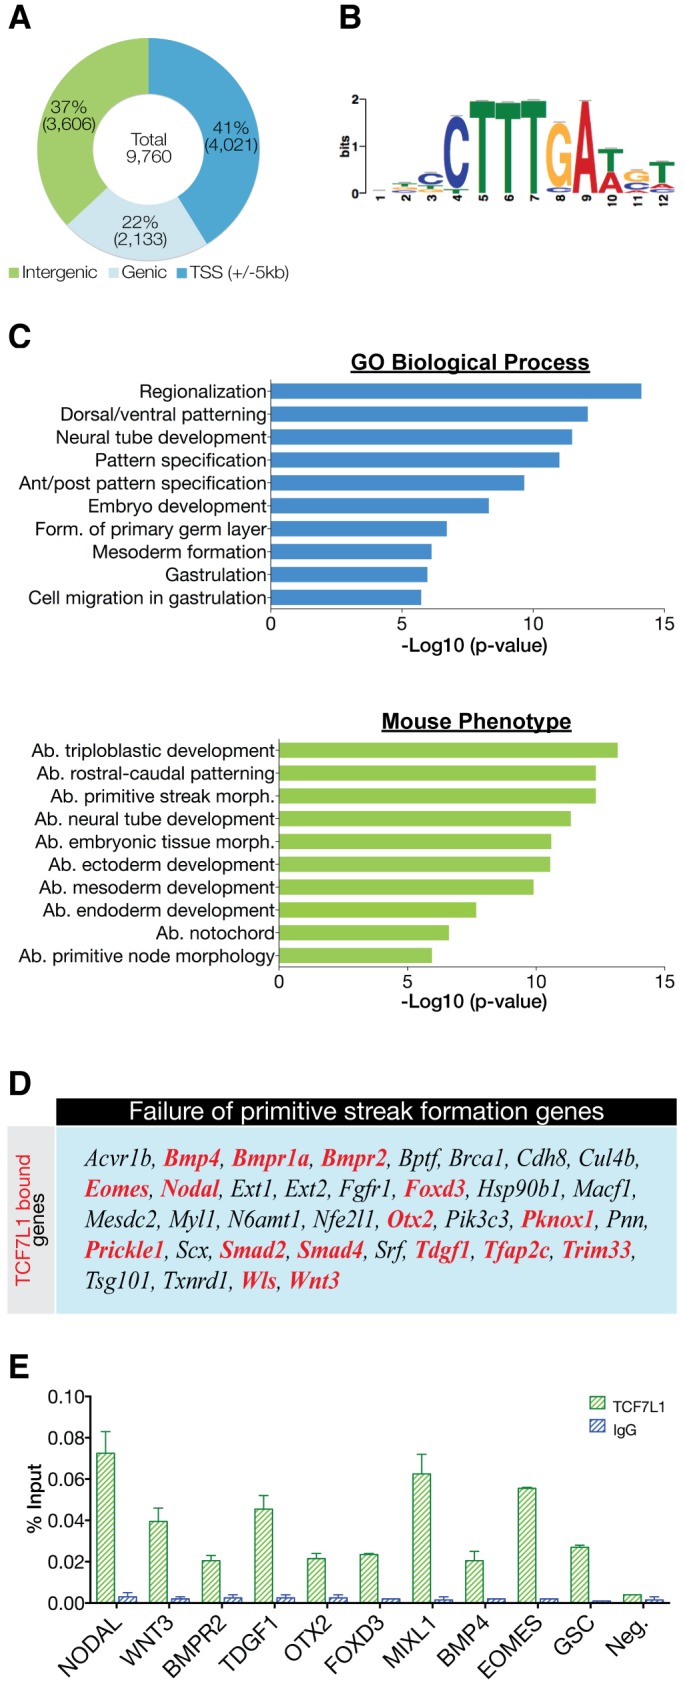
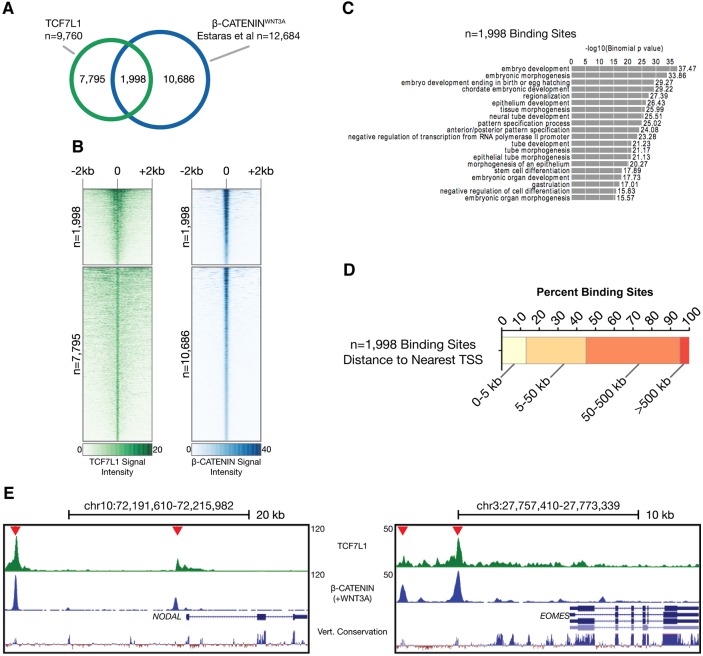
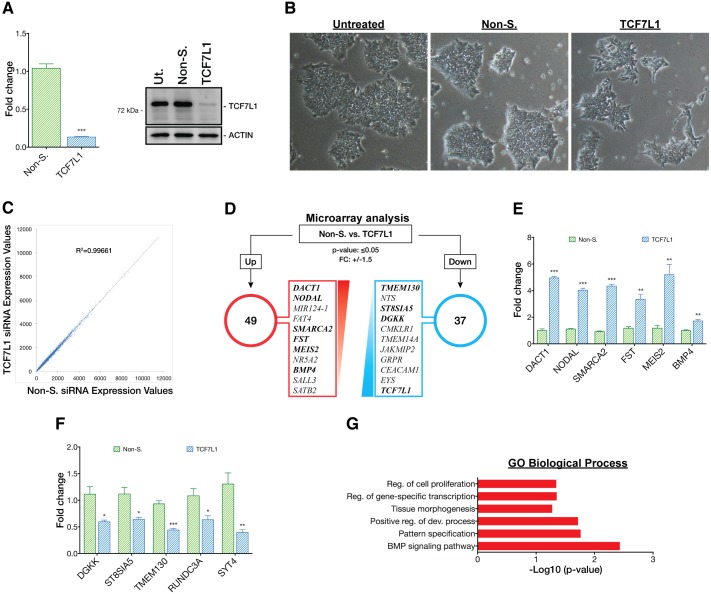
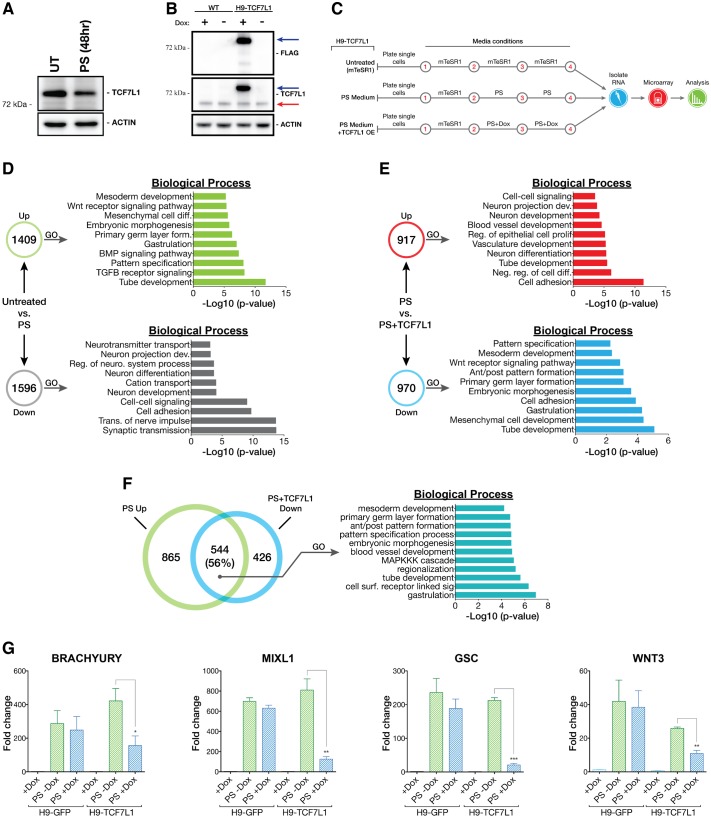
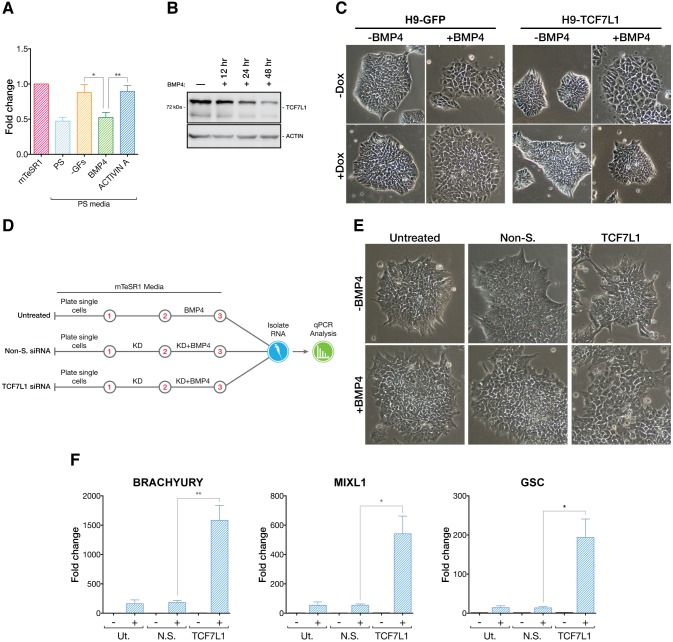
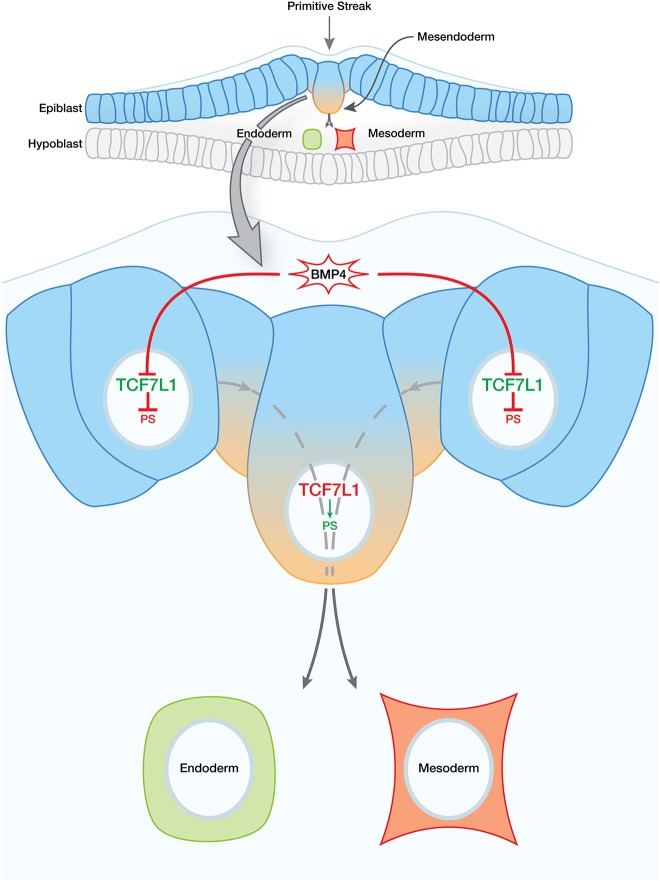
Human embryonic stem cells (hESCs) are exquisitely sensitive to WNT ligands, which rapidly cause differentiation. Therefore, hESC self-renewal requires robust mechanisms to keep the cells in a WNT inactive but responsive state. How they achieve this is largely unknown. We explored the role of transcriptional regulators of WNT signaling, the TCF/LEFs. As in mouse ESCs, TCF7L1 is the predominant family member expressed in hESCs. Genome-wide, it binds a gene cohort involved in primitive streak formation at gastrulation, including NODAL, BMP4 and WNT3 Comparing TCF7L1-bound sites with those bound by the WNT signaling effector β-catenin indicates that TCF7L1 acts largely on the WNT signaling pathway. TCF7L1 overlaps less with the pluripotency regulators OCT4 and NANOG than in mouse ESCs. Gain- and loss-of-function studies indicate that TCF7L1 suppresses gene cohorts expressed in the primitive streak. Interestingly, we find that BMP4, another driver of hESC differentiation, downregulates TCF7L1, providing a mechanism of BMP and WNT pathway intersection. Together, our studies indicate that TCF7L1 plays a major role in maintaining hESC pluripotency, which has implications for human development during gastrulation.

Keywords: BMP4; Gastrulation; Human ES cells; Primitive streak; TCF7L1; WNT signaling.


Conflict of interest statement

Competing interestsThe authors declare no competing or financial interests.

Figures

Fig. 1.
Fig. 1.
Inactive WNT signaling and TCF/LEF expression in hESCs. (A) TOPflash WNT signaling reporter analysis (n=3) of undifferentiated (Ut.) H9 hESCs or those treated with WNT3A (100 ng/ml) for 24 h. One-tailed t-test, *P≤0.05. Error bars indicate s.e.m. (B) Confocal analysis of OCT4 and β-catenin localization in untreated (mTeSR1) or 24 h WNT3A (100 ng/ml) stimulated conditions. (C) qPCR analysis (n=3) shows that WNT3A induces primitive streak (PS) gene expression after 48 h. T, brachyury. Two-tailed t-test, *P≤0.05, **P≤0.01, ***P≤0.001. (D) Averaged Ct values from LEF/TCF qPCR analysis in H9 hESCs (left) and normalized comparative analysis of LEF/TCF qPCR data showing LEF/TCF mRNA levels relative to TCF7L1 (n=3). Two-tailed t-test, **P≤0.01. (E) PCR analysis of TCF7L1 mRNA expression levels in H1, H9 and H14 hESCs. MEF-only sample illustrates species specificity of the TCF7L1 primers. β-actin was the template loading control. (F) Confocal immunofluorescence analysis of OCT4 and TCF7L1 in H9 hESCs under feeder-free conditions.
Fig. 2.
Fig. 2.
Characterization of TCF7L1 binding sites in hESCs. (A) Location of the top 9760 peaks (IDR<0.01325) relative to the nearest gene as determined by HOMER annotation. (B) De novo motif detected in TCF7L1/β-catenin-shared binding sites. The TCF7L1 site observed is a canonical WNT-response element (WRE). (C) GREAT analysis of underlying GO themes among TCF71 target genes. The top 1000 peaks were analyzed using ‘basal plus extension’ default settings. Data are presented as the –log10 of their respective P-values for convenience. Ab., abnormal; form., formation; morph., morphology. (D) TCF7L1-bound genes (red) represented in the mammalian phenotype category ‘failure of primitive streak formation’. Genes with TCF7L1 binding within ±5 kb of the TSS were used for this comparison. (E) ChIP-qPCR analysis (n=2) of TCF7L1 binding to crucial PS genes shown as percentage input recovery. Error bars indicate s.e.m.
Fig. 3.
Fig. 3.
β-catenin is recruited to TCF7L1-occupied sites upon WNT3A stimulation of hESCs. (A) Overlap of TCF7L1 ChIP-seq binding sites and β-catenin sites upon WNT3A stimulation from Estarás et al. (2015). 1998 overlapping sites were identified. (B) Comparison of signal intensity maps for TCF7L1 and β-catenin ±2 kb from the observed binding sites. 1998 peaks are bound by both TCF7L1 and β-catenin with strong signal intensity. Peaks bound by TCF7L1 (7795 peaks) and β-catenin (10,686 peaks) independently are also shown. (C) GREAT enrichment GO categories for the 1998 overlapping TCF7L1 and β-catenin sites. (D) Relationship of the 1998 shared binding sites to the genome with respect to the nearest gene TSS. (E) Screenshots from the UCSC Genome Browser showing overlapping TCF7L1 and β-catenin binding sites within the human NODAL and EOMES loci [β-catenin data from Estarás et al. (2015)]. Vert., vertebrate.
Fig. 4.
Fig. 4.
Loss of TCF7L1 upregulates PS gene expression. (A) (Left) siRNA reduced TCF7L1 mRNA expression by a factor of 10 after 3 days, as analyzed by qPCR (n=3). Two-tailed t-test, ***P≤0.001. (Right) Western blot confirmed concomitant downregulation of TCF7L1 protein. Non-S., non-silencing siRNA; Ut., untreated. siRNAs were used at 50 nM. (B) Phase contrast images (original magnification 4×) showing morphological changes in TCF7L1 knockdown colonies as compared with controls. (C) Scatter plot of microarray mean gene expression values from the TCF7L1 siRNA condition plotted against non-silencing siRNA condition. Uniform linear distribution signifies highly similar expression values in both siRNA conditions. (D) Results of 3 day TCF7L1 siRNA knockdown microarray analysis. Top upregulated and downregulated gene candidates (red and blue boxes, respectively) were selected based on the following criteria: P≤0.05; fold change (FC) ≥1.5 and ≤−1.5. Genes highlighted in bold (and others) were validated by qPCR (see E and F). (E) qPCR validation of selected candidate upregulated genes identified by microarray analysis (n=3). Two-tailed t-test, **P≤0.01, ***P≤0.001. (F) qPCR validation of selected candidate downregulated genes identified by microarray analysis (n=3). Two-tailed t-test, *P≤0.05, **P≤0.01, ***P≤0.001. Error bars indicate s.e.m. (G) DAVID GO analysis (P≤0.05) of genes upregulated by TCF7L1 siRNA knockdown. x-axis shows –log10 conversion of the P-values. Reg., regulation; dev., development.
Fig. 5.
Fig. 5.
TCF7L1 overexpression impedes PS differentiation. (A) Western blot analysis of TCF7L1 protein after 48 h of PS differentiation as compared with untreated control (UT). (B) FLAG-TCF7L1-HTBH is robustly overexpressed in H9-TCF7L1 cells after 48 h of doxycycline (1 μg/ml) induction. The higher molecular weight band is FLAG-TCF7L1-HTBH (blue arrow). The lower band is endogenous TCF7L1 (red arrow). WT, H9 cells. (C) Scheme of the TCF7L1 overexpression microarray experiment. (D) Comparison of PS differentiated H9-TCF7L1 cells (without doxycycline induction) with mTeSR1-cultured H9-TCF7L1 cells (untreated). GO analysis of significantly differentially expressed genes is shown as –log10 of their respective P-values. (E) Comparison of PS differentiated H9-TCF7L1 cells with and without 48 h of doxycycline induction. GO analysis of significantly differentially expressed genes is presented as –log10 of their respective P-values. (F) GO analysis of shared PS+TCF7L1 downregulated versus PS upregulated genes, indicating enrichment of genes involved in gastrulation, embryonic patterning and embryonic morphogenesis. (G) qPCR validation of candidate TCF7L1-repressed genes identified by microarray analysis. Analysis was performed with H9-TCF7L1 and control H9-GFP cell lines (n=3). Two-tailed t-test, *P≤0.05, **P≤0.01, ***P≤0.001. Error bars indicate s.e.m. Ant/post, anterior/posterior; dev., development; diff., differentiation; form., formation; reg., regulation; neuro., neurological; neg., negative; surf., surface; sig., signaling.
Fig. 6.
Fig. 6.
TCF7L1 antagonizes BMP4-induced differentiation. (A) qPCR analysis (n=3) of TCF7L1 mRNA levels after 24 h in mTeSR1, complete PS differentiation medium, PS differentiation medium without BMP4 and activin A (−GFs), or PS differentiation medium with either BMP4 or activin A alone. Two-tailed t-test, *P≤0.05, **P≤0.01. (B) Western blot analysis of TCF7L1 levels at 12, 24 and 48 h of BMP4-induced differentiation. (C) H9-GFP and H9-TCF7L1 cells were grown under feeder-free conditions and treated with BMP4 (24 h) while inducing GFP or TCF7L1 with doxycycline (1 μg/ml). Phase contrast images, original magnification 10×. (D) Scheme of experiment in which hESCs were treated with BMP4 (10 ng/ml) while performing TCF7L1 siRNA (50 nM) knockdown under feeder-free conditions. Cells were harvested after 48 h of siRNA knockdown and 24 h of BMP4 treatment. Control experiments were performed without BMP4 treatment for each condition (not shown). Red numbers indicate days of procedure. (E) Simultaneous loss of TCF7L1 and treatment with BMP4 causes pronounced morphological changes in colonies. Phase contrast images (original magnification 10×) show TCF7L1 siRNA+BMP4-treated hESC colonies, which appear more flattened and differentiated than controls. (F) qPCR analysis showing synergistic upregulation of PS markers when BMP4 treatment is combined with TCF7L1 knockdown (n=3). Two-tailed t-test, *P≤0.05, **P≤0.01. Error bars indicate s.e.m.
Fig. 7.
Fig. 7.
Model of TCF7L1 role in hESC and epiblast pluripotency and differentiation. Epiblast cells (blue) in vivo – which can be thought of as synonymous with hESCs in vitro – remain in an undifferentiated state until necessary inductive signals are received. In the undifferentiated state, TCF7L1 represses genes involved in PS differentiation (blue-orange gradient). At the onset of gastrulation, BMP4 signaling triggers downregulation of TCF7L1, thereby relieving repression of PS gene targets. Whether the effect of BMP4 on TCF7L1 is direct or indirect remains to be determined.

Similar articles

Cited by

References

    1. Atlasi Y., Noori R., Gaspar C., Franken P., Sacchetti A., Rafati H., Mahmoudi T., Decraene C., Calin G. A., Merrill B. J. et al. (2013). Wnt signaling regulates the lineage differentiation potential of mouse embryonic stem cells through Tcf3 down-regulation. PLoS Genet. 9, e1003424 10.1371/journal.pgen.1003424 - DOI - PMC - PubMed
    1. Blauwkamp T. A., Nigam S., Ardehali R., Weissman I. L. and Nusse R. (2012). Endogenous Wnt signalling in human embryonic stem cells generates an equilibrium of distinct lineage-specified progenitors. Nat. Commun. 3, 1070 10.1038/ncomms2064 - DOI - PMC - PubMed
    1. Burtscher I. and Lickert H. (2009). Foxa2 regulates polarity and epithelialization in the endoderm germ layer of the mouse embryo. Development 136, 1029-1038. 10.1242/dev.028415 - DOI - PubMed
    1. Cadigan K. M. and Waterman M. L. (2012). TCF/LEFs and Wnt signaling in the nucleus. Cold Spring Harb. Perspect. Biol. 4, a007906 10.1101/cshperspect.a007906 - DOI - PMC - PubMed
    1. Chambers I., Silva J., Colby D., Nichols J., Nijmeijer B., Robertson M., Vrana J., Jones K., Grotewold L. and Smith A. (2007). Nanog safeguards pluripotency and mediates germline development. Nature 450, 1230-1234. 10.1038/nature06403 - DOI - PubMed

Publication types

MeSH terms

Substances