. 2018 Apr;67(4):769-781.
doi: 10.2337/db17-1034. Epub 2018 Jan 23.

ELOVL4-Mediated Production of Very Long-Chain Ceramides Stabilizes Tight Junctions and Prevents Diabetes-Induced Retinal Vascular Permeability

Affiliations

ELOVL4-Mediated Production of Very Long-Chain Ceramides Stabilizes Tight Junctions and Prevents Diabetes-Induced Retinal Vascular Permeability

Nermin M Kady et al. Diabetes. 2018 Apr.

Abstract

Tight junctions (TJs) involve close apposition of transmembrane proteins between cells. Although TJ proteins have been studied in detail, the role of lipids is largely unknown. We addressed the role of very long-chain (VLC ≥26) ceramides in TJs using diabetes-induced loss of the blood-retinal barrier as a model. VLC fatty acids that incorporate into VLC ceramides are produced by elongase elongation of very long-chain fatty acids protein 4 (ELOVL4). ELOVL4 is significantly reduced in the diabetic retina. Overexpression of ELOVL4 significantly decreased basal permeability, inhibited vascular endothelial growth factor (VEGF)- and interleukin-1β-induced permeability, and prevented VEGF-induced decrease in occludin expression and border staining of TJ proteins ZO-1 and claudin-5. Intravitreal delivery of AAV2-hELOVL4 reduced diabetes-induced increase in vascular permeability. Ultrastructure and lipidomic analysis revealed that ω-linked acyl-VLC ceramides colocalize with TJ complexes. Overall, normalization of retinal ELOVL4 expression could prevent blood-retinal barrier dysregulation in diabetic retinopathy through an increase in VLC ceramides and stabilization of TJs.


Figures

Figure 1
Figure 1
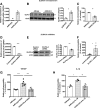
Expression level of ELOVL4 controls retinal endothelial permeability. BRECs were transduced with AdEmpty or AdhELOVL4 and collected 60 h after adenovirus transduction for RNA analysis by real-time qPCR (A) or protein by Western blot (B) to confirm adenovirus-mediated overexpression of hELOVL4. hELOVL4 mRNA expression was normalized to GAPDH (A), and protein expression was normalized to α-tubulin loading control (B). Data from three independent experiments, different cell isolates, triplicate wells each, are presented. C: Paracellular permeability to 70 kDa RITC-dextran was determined in BRECs transduced with AdEmpty or AdhELOVL4 in untreated cells. Data from triplicate wells, three measurements each, are presented. AC: Circles, control; squares, ELOVL4. DF: BRECs were transfected with control siRNA or ELOVL4-siRNA and collected for analysis. Three independent siRNA experiments, each in triplicate, were performed. Expression profile of ELOVL4 was determined by real-time qPCR, 48 h after transfection (D), or Western blot, 72 h after transfection (E), to confirm silencing of ELOVL4. Bovine ELOVL4 mRNA expression was normalized to GAPDH (D), and protein expression was normalized to β-actin loading control (E). F: Paracellular permeability to 70 kDa RITC-dextran was determined in BRECs transfected with control siRNA or ELOVL4 siRNA. DF: Circles, control; squares, ELOVL4 siRNA. Paracellular permeability to 70 kDa RITC-dextran was determined in BRECs transduced with AdEmpty (circles), AdEmpty treated with VEGF (G) or IL-1β (H) (squares), or AdhELOVL4 treated with VEGF (50 ng/mL) for 30 min (G) or treated with IL-1β (10 ng/mL) for 15 min (H) (triangles). The VEGF experiment was repeated three times in two different laboratories by two investigators, six samples per condition, with seven time points per sample. The IL-1β with ELOVL4 overexpression experiment was performed with six samples per condition, seven time points per sample. Results are shown as mean ± SEM. ND, not determined; *P < 0.05, **P < 0.01, ***P < 0.001, ****P < 0.0001.
Figure 2
Figure 2
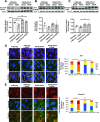
ELOVL4 overexpression increases the barrier properties of TJ complex. AC: Confluent AdEmpty and AdhELOVL4 transduced BRECs were treated with VEGF (50 ng/mL) for 30 min. Total cell lysates were immunoblotted for occludin (A), ZO-1 (B), and claudin-5 (C). β-Actin served as the loading control. The experiment was repeated twice in triplicate. Representative Western blots from three independent experiments are shown on top, with densitometry quantification below. Results are shown as mean ± SEM. Circles, control; squares, control with VEGF; triangles, ELOVL4; upside-down triangles, VEGF with ELOVL4. D and E: Confluent monolayers of BRECs treated as in AC were immunolabeled for ZO-1 (far red) and ceramide (green) (D) or claudin-5 (red) and ceramide (green) (E), and confocal images were taken. The results are from two independent experiments; for each condition, four images were examined. Four fields were analyzed for each image. Scale bars, 10 μm. Quantification of each protein staining at the cell border is shown on the far right. The results represent the frequency of each score as described in research design and methods. *P < 0.05, **P < 0.01, ***P < 0.001.
Figure 3
Figure 3
Ceramide colocalizes with TJ complex. A: TJs stained by osmium tetroxide (OsO4) staining (black arrows). Lower original magnification ×10,000, red blood cells (RBCs) in the intravascular compartment and the TJ between two neighboring retinal endothelial cells (black arrow) (left). Scale bar, 1 μm. TJ is enlarged for better visualization original magnification ×67,000 (black arrow) (middle). Scale bar, 0.1 μm. Kissing point, hallmark of tight junction (black arrowhead) (right). Scale bar, 0.5 μm. B: Immunogold localization of ceramide and TJ protein occludin in ultrathin sections of bovine retina. B (left panel): Lower original magnification ×27,000 (upper) and ×40,000 (lower) of the tight junction (black arrow), with RBC in the intravascular compartment. Scale bars, 0.5 μm and 0.2 μm, respectively. B (right panel): Higher original magnification ×100,000 (upper) and ×140,000 (lower). Ceramide (smaller, 6-nm gold particles) (white arrowhead) localized along the TJ in juxtaposition to the TJ protein, occludin (larger, 15-nm gold particles) (black arrow). Scale bars, 50 nm. Although most of the ceramide labeling is localized along the cytoplasmic side of the plasma membrane, it can also be visualized in the intercellular space between two neighboring endothelial cells (black arrowhead). The TJs from 3 retinas were imaged; representative images from 26 independent images are shown. C: Negative controls are representative images of the TJs where primary antibodies were omitted. Lower original magnification ×10,000 of the tight junction (black arrow), with RBC in the intravascular compartment (left panel). Scale bar, 1 μm. Higher magnification of the tight junction ×50,000 (black arrow) (right panel). Scale bar, 200 nm.
Figure 4
Figure 4
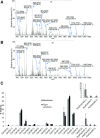
High resolution/accurate MS lipidomic analysis of ARPE-19 plasma membrane and TJ fractions. Negative ion Orbitrap high resolution/accurate MS of ARPE-19 plasma membrane (A) and ARPE-19 TJ lipid extracts (B) at 100,000 resolution. Sphingolipids and phosphatidylcholine lipids were detected as [M+HCO2−H] ions under the analytical conditions used. The indicated region was original magnified ×5 to enhance spectral detail. C: Quantitation of ceramide molecular species observed in ARPE-19 plasma membrane and TJ fractions. The inset indicates putative VLCFA-containing AcylCer species. HexCer, hexosylceramide; LacCer, lactosylceramide; PC, phosphatidylcholine; PI, phosphatidylinositol; SM, sphingomyelin.
Figure 5
Figure 5
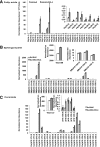
ELOVL4 overexpression increases free fatty acids (FA), sphingomyelin (SM), and ceramide levels in hELOVL4-transfected bovine retinal endothelial cells. A: Individual free fatty acids were measured by nESI-Orbitrap high resolution/accurate MS. Inset: Normalized ion abundance of fatty acids greater than C24. B: Total and individual sphingomyelin molecular species were measured by nESI-Orbitrap high resolution/accurate MS. Left inset: Total normalized ion abundance of all sphingomyelin species detected in control and hELOVL4-transfected cells. Right inset: Normalized abundance of SM species containing fatty acids greater than C24. C: Total and individual ceramide molecular species were measured by nESI-Orbitrap high resolution/accurate MS. Left inset: Total normalized ion abundance of all ceramide species detected in control and hELOVL4-transfected cells. Right inset: Normalized abundance of ceramide species containing fatty acids greater than C24. Results were obtained from three independent transfections. Results are shown as mean ± SD.
Figure 6
Figure 6
ELOVL4 overexpression prevents diabetes-induced vascular leakage in mice. STZ-induced diabetic mice were intravitreally injected with AAV2-hELOVL4 mut quad (right eye) or control AAV2-Empty vector (left eye) 2 weeks after diabetes induction. Retinal tissue was analyzed 6–8 weeks after the viral injection. A: Real-time qPCR quantification of endogenous mouse ELOVL4 mRNA levels in control (squares) and diabetic (triangles) retinas. The experiment was repeated four times by different investigators, with three to six animals per condition in each experiment. B: Real-time qPCR quantification of exogenous human ELOVL4 mRNA levels in control and diabetic retinas. Four control and six diabetic animals were used, and the experiment was performed in triplicate. C: Immunohistochemical detection of ELOVL4 (green, upper panel) colocalization with retinal vasculature (red, middle panel), with yellow color (lower panel) indicating vascular expression in retinal cross-sections. Quantification of colocalization (yellow) is shown on the far right. Circles, control; squares, control with ELOVL4; triangles, diabetic; upside-down triangles, diabetic with ELOVL4. Three retinas per condition were used, and images from three fields were taken. Scale bar, 20 μm. The vitreous side is indicated with a white asterisk. D: Representative fluorescent images of retinal vascular permeability. Retina permeability was evaluated by measuring leakage fluorescence intensity as shown on the far right (8 control and 12 diabetic animals used in the study). Scale bar, 50 μm. E: Immunostaining of flat-mounted whole retinas for occludin. Arrowheads show disruption of continuous staining in diabetic retinas. Representative images from three different retinas, and three to six images per retina are shown. Scale bar, 20 μm. ND, not determined. **P < 0.01, ****P < 0.0001.

References

    1. Antonetti DA, Barber AJ, Hollinger LA, Wolpert EB, Gardner TW. Vascular endothelial growth factor induces rapid phosphorylation of tight junction proteins occludin and zonula occluden 1. A potential mechanism for vascular permeability in diabetic retinopathy and tumors. J Biol Chem 1999;274:23463–23467 - PubMed
    1. Murakami T, Felinski EA, Antonetti DA. Occludin phosphorylation and ubiquitination regulate tight junction trafficking and vascular endothelial growth factor-induced permeability. J Biol Chem 2009;284:21036–21046 - PMC - PubMed
    1. Harhaj NS, Felinski EA, Wolpert EB, Sundstrom JM, Gardner TW, Antonetti DA. VEGF activation of protein kinase C stimulates occludin phosphorylation and contributes to endothelial permeability. Invest Ophthalmol Vis Sci 2006;47:5106–5115 - PubMed
    1. Zhu W, London NR, Gibson CC, et al. . Interleukin receptor activates a MYD88-ARNO-ARF6 cascade to disrupt vascular stability. Nature 2012;492:252–255 - PMC - PubMed
    1. Aveleira CA, Lin CM, Abcouwer SF, Ambrósio AF, Antonetti DA. TNF-α signals through PKCζ/NF-κB to alter the tight junction complex and increase retinal endothelial cell permeability. Diabetes 2010;59:2872–2882 - PMC - PubMed

Publication types

MeSH terms