. 2018 Mar 16;122(6):e20-e33.
doi: 10.1161/CIRCRESAHA.117.311522. Epub 2018 Jan 23.

Down Syndrome Critical Region 1 Gene, Rcan1, Helps Maintain a More Fused Mitochondrial Network

Affiliations

Down Syndrome Critical Region 1 Gene, Rcan1, Helps Maintain a More Fused Mitochondrial Network

Valentina Parra et al. Circ Res. .

Abstract

Rationale: The regulator of calcineurin 1 (RCAN1) inhibits CN (calcineurin), a Ca2+-activated protein phosphatase important in cardiac remodeling. In humans, RCAN1 is located on chromosome 21 in proximity to the Down syndrome critical region. The hearts and brains of Rcan1 KO mice are more susceptible to damage from ischemia/reperfusion (I/R); however, the underlying cause is not known.

Objective: Mitochondria are key mediators of I/R damage. The goal of these studies was to determine the impact of RCAN1 on mitochondrial dynamics and function.

Methods and results: Using both neonatal and isolated adult cardiomyocytes, we show that, when RCAN1 is depleted, the mitochondrial network is more fragmented because of increased CN-dependent activation of the fission protein, DRP1 (dynamin-1-like). Mitochondria in RCAN1-depleted cardiomyocytes have reduced membrane potential, O2 consumption, and generation of reactive oxygen species, as well as a reduced capacity for mitochondrial Ca2+ uptake. RCAN1-depleted cardiomyocytes were more sensitive to I/R; however, pharmacological inhibition of CN, DRP1, or CAPN (calpains; Ca2+-activated proteases) restored protection, suggesting that in the absence of RCAN1, CAPN-mediated damage after I/R is greater because of a decrease in the capacity of mitochondria to buffer cytoplasmic Ca2+. Increasing RCAN1 levels by adenoviral infection was sufficient to enhance fusion and confer protection from I/R. To examine the impact of more modest, and biologically relevant, increases in RCAN1, we compared the mitochondrial network in induced pluripotent stem cells derived from individuals with Down syndrome to that of isogenic, disomic controls. Mitochondria were more fused, and O2 consumption was greater in the trisomic induced pluripotent stem cells; however, coupling efficiency and metabolic flexibility were compromised compared with disomic induced pluripotent stem cells. Depletion of RCAN1 from trisomic induced pluripotent stem cells was sufficient to normalize mitochondrial dynamics and function.

Conclusions: RCAN1 helps maintain a more interconnected mitochondrial network, and maintaining appropriate RCAN1 levels is important to human health and disease.

Keywords: Down syndrome; calcineurin; calpain; ischemia reperfusion injury; mitochondria; mitochondrial dynamics.


Figures

Figure 1
Figure 1. Rcan1 KO hearts showed increased mitochondrial fragmentation
(A) Electron micrographs of the left ventricular wall show disordered and fragmented mitochondria in the KO compared to WT (scale bar: 1 μm). Mitochondrial were quantified for (B) cross-sectional area, (C) density, (D) perimeter, and (E) circularity index. 100 mitochondria were assessed in 3 animals of each genotype (n=3). Mean ± SEM; *P<0.05.
Figure 2
Figure 2. Mitochondrial fragmentation increases in RCAN1.1-depleted NRVM
NRVM were transfected with a nonspecific control siRNA or ones targeting RCAN1.1 and RCAN1.4, individually or combined (dKD). (A) Confocal Z-stack reconstructions of siControl and siRCAN1.1-depleted NRVMs stained with Mitotracker Green (Scale bar: 20 μm) where assessed for (B) the number of mitochondria per cell and (C) volume of individual mitochondria. Data are from 25 cells examined from six separate experiments (n=6). (D–L) FRAP analysis of TMRM stained NRVM was used to assess connectivity of the mitochondrial network. (D) Bleaching of TMRM fluorescence was applied in an ~25-μm2 square at randomly chosen regions (scale bar: 10 μm). (E) Fluorescence recovery was tracked over time and normalized to the signal prior to bleaching then quantified for (F) rate of recovery and (G) level of recovery. Data are from 15 cells each condition in five separate experiments (n=5). (H) Mitochondria and cytosol were fractionated from siRNA transfected NRVM then assessed by Western blot for the proteins indicated. (I) DRP1 localized to the mitochondrial fractions in H were quantified by densitometry (n= 4). (J) Total DRP1 protein was immunoprecipitated from total cell extracts of siRNA transfected NRVM then probed with antibody specific for phospho‐Ser637. (K) Signal was normalized to total DRP1 (n=3). Mean ± SEM; *P<0.05, **P<0.01, ***P<0.001.
Figure 3
Figure 3. Mitochondrial function is decreased in RCAN1.1-depleted NRVM
Cells were transfected with siRNAs as indicated and analyzed 48 h later. (A) Total cellular ATP levels, were measured by luciferase (n=7). (B) Transfected NRVM were loaded with TMRM and analyzed by flow cytometry to assess Δψm. The complex V inhibitor, Oligomycin (Oligo, 10 μM), and the mitochondrial uncoupler CCCP (50 μM) were used as positive and negative controls respectively (n=5). (C) Schematic draws an analogy between mitochondrial electron transport and an electrical circuit. Complexes I, III and IV act in parallel with respect to the proton circuit and in series with respect to the electron flow. The sites of action for Oligo and CCCP are indicated. (D) O2 consumption is reduced with RCAN1 depletion (n=6). (E) Maximal and proton leak-associated O2 consumption were assessed by adding CCCP (200 nM) or Oligo (50 nM), respectively (n=4). (F) Total ROS content was measured by flow cytometry using MitoSox® (n=5) or (G) DH123 (n=4). (H) Transcript levels for Hk2, Pfkfb2, Slc2a1, and Atp5b were quantified by qPCR (n=3). Mean ± SEM; *P<0.05, **P<0.01, ***P<0.001.
Figure 4
Figure 4. siRCAN1.1-depleted NRVM are more sensitive to I/R due to CN-dependent activation of DRP1
(A) 48 h following transfection NRVM were subjected to simulated I/R (6 h ischemia, 12 h reperfusion) and LDH release was used to assess death (n=4). (B) NRVM were treated with either FK506 (20 nM) to inhibit CN or (C) Mdivi (12.5 μM) to inhibit DRP1, prior to simulated I/R. (n=4). (D–H) NRVM protein extracts were probed for DRP1, HSPA9 (mtHSP70), TUBB, OPA1 (long and short isoforms), PINK1, MFN2, PARK2 and GAPDH by Western blot and quantified by densitometry (n=4). Mean ± SEM; *P<0.05, **P<0.01, ***P<0.001.
Figure 5
Figure 5. Depletion of RCAN1.1 reduces mitochondrial Ca+2 buffering capacity, and increases CAPN-mediated damage following I/R
(A) siRNA transfected NRVM stained with Mitotracker Green have been pseudo-colored to indicate the relative density of mitochondrial signal. Yellow indicates lower density, whereas red-violet indicates higher density (scale bar: 20 μm). (B&C) Mitochondria Ca+2 uptake was assessed by loading cells with Rhod-FF prior to the addition of histamine (100 μM) to release Ca+2 from ER stores (n=4). (D) Cytosolic Ca+2 was assessed by loading cells with Fura2 prior to the addition of KCl 50 mM to trigger Ca+2-induced Ca+2 release. (E) Signal from D was quantified as the maximal fluorescence ratio reached during the first 150 s. Data are from 50 cells examined in five separate experiments. (F) α-spectrin cleavage products were assessed by Western blot. Ionomycin (Iono) was added as a control for CAPN activation. Quantification in lower panel (n=4). (G–I) RCAN1-depleted NRVM where treated with the CAPN inhibitors E-64D (10 μM), MDL (10 μM), or PD 150606 (10 μM) prior to sI/R (n=5). (J) A mixture of siRNA’s depleting CAPN 1 and 2 (50 nM) also conferred protection to the RCAN1.1-depleted NRVM (n=5). Mean ± SEM; *P<0.05, **P<0.01, ***P<0.001.
Figure 6
Figure 6. Exogenous expression of human RCAN1.1 restores mitochondrial parameters and protection from I/R to RCAN1.1-depleted NRVM
(A) Cells were transfected with indicated siRNAs followed by adenoviral infection to express human RCAN1.1 (Ad-RCAN1.1) or β-galactosidase (Ad β-gal). 48 h later, cells where loaded with Mitotracker Green and imaged by confocal (n=4) (scale bar: 10 μm) and quantified for (B) the number of mitochondria per cell and (C) individual mitochondrial volume. (D) Infection with Ad‐hRCAN1.1 increased O2 consumption in both siControl and siRCAN1.1-depleted NRVM (n=4). (E) Infection with Ad-hRCAN1.1 increased ROS production in both siControl and siRCAN1.1-depleted NRVM (n=4). (F) Infection with Ad-hRCAN1.1 restored protection from sI/R to siRCAN1.1-depleted NRVM (n=4). (G) Maximal and proton leak-associated O2 consumption were assessed by adding CCCP (200 nM) or oligomycin (50 nM), respectively to control cells infected with either Ad-β-gal or Ad-hRCAN1.1 (n=4). Mean ± SEM; *P<0.05, **P<0.01, ***P<0.001.
Figure 7
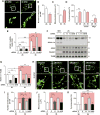
Figure 7. Rcan1 KO adult cardimyocytes show increased fission, decreased mitochondrial Ca+2 buffering capacity, and decreased mitochondrial function. (A)
Confocal Z-stack reconstructions of WT and KO AMVMs stained with TMRM (Scale bar: 20 μm) where assessed for (B) the number of mitochondria per cell and (C) volume of individual mitochondria. Data are from 25 cells examined from three separate experiments. (D–E) Interior (Inter) or peripheral (Peri) regions of interests from the images in A were assessed independently. (F) Mitochondrial Ca2+ uptake in permeabilized AMVM stained with Rhod2. (G) Quantification of F (H) area under the curve during 300 s. Data are from 50 cells examined in three separate experiments. Oxygen consumption of permeabilized AMVMs using (I) Pyruvate and (J) glutamate as substrates. n=4 from three different mice in each group. Mean ± SEM; *P<0.05, **P<0.01, ***P<0.001.
Figure 8
Figure 8. Trisomic iPSC from individuals with Down syndrome have a more fused mitochondrial network and increased O2 consumption
(A) Disomic D21-iPSC (2S) and Trisomic T21-iPSC (3S) were stained with Mitotracker-green and then analyzed by confocal microscopy to reconstruct the mitochondrial network. Representative images are provided from the D21-iPSC line #409 (2S) and the T21-iPSC line #416 (3S). Identical results where obtained from independent lines #406 (2S) and #419 (3S) (scale bar: 10 μm). (B) Trisomic T21-iPSC contained fewer (C) and larger mitochondria compared to disomic D21-iPSC. Data are from 25 cells in three independent experiments. (D) O2 consumption rate was higher in T21-iPSC than in D21-iPSC. Maximal capacity and proton leak were assessed by adding Oligo, (50 nM) or CCCP (200 nM) respectively. (n=5). (E) Transcript levels for RCAN1.1 were higher in T21-iPSC than in D21-iPSC. Human-specific siRNAs targeting each of the RCAN1 isoforms were used to deplete endogenous RCAN1 from both lines and changes in endogenous RCAN1.1 transcripts quantified by qPCR (n=4). (F) The siRNA-depleted iPSC were analyzed by Western blot for RCAN1, SOX2, POU5F1 and TUBB proteins. HEK293 cells were used as controls. (G) Densitometry was used to quantify RCAN1.1 protein levels in F normalized to TUBB (n=4). (H) Trisomic T21-iPSC were depleted of RCAN1.1 and RCAN1.4, individually and in combination (dKD) then stained for analysis of the mitochondrial network (scale bar: 10 μm). (I) Depletion of RCAN1.1 alone or in combination with RCAN1.4 (dKD) increased mitochondrial number, (J) reduced average mitochondrial size, and (K) reduced basal ROS generation to levels (n=5). Mean ± SEM; *P<0.05, **P<0.01, ***P<0.001.

Comment in

Similar articles

Cited by

References

    1. Mozaffarian D, Benjamin EJ, Go AS, et al. Heart Disease and Stroke Statistics—2015 Update. Circulation. 2015;131:e29–e322. - PubMed
    1. Halestrap AP. A pore way to die: the role of mitochondria in reperfusion injury and cardioprotection. Biochem Soc Trans. 2010;38:841–860. - PubMed
    1. Di Lisa F, Canton M, Carpi A, Kaludercic N, Menabò R, Menazza S, Semenzato M. Mitochondrial injury and protection in ischemic pre- and postconditioning. Antioxid Redox Signal. 2011;14:881–891. - PubMed
    1. Ong S-B, Subrayan S, Lim SY, Yellon DM, Davidson SM, Hausenloy DJ. Inhibiting mitochondrial fission protects the heart against ischemia/reperfusion injury. Circulation. 2010;121:2012–2022. - PubMed
    1. Vasquez-Trincado C, Garcia-Carvajal I, Pennanen C, Parra V, Hill JA, Rothermel BA, Lavandero S. Mitochondrial dynamics, mitophagy and cardiovascular disease. J Physiol. 2016;594:509–525. - PMC - PubMed

Publication types

MeSH terms