

Stress-Induced Reorganization of the Mycobacterial Membrane Domain
- PMID: 29362232
- PMCID: PMC5784251
- DOI: 10.1128/mBio.01823-17
Stress-Induced Reorganization of the Mycobacterial Membrane Domain
Abstract
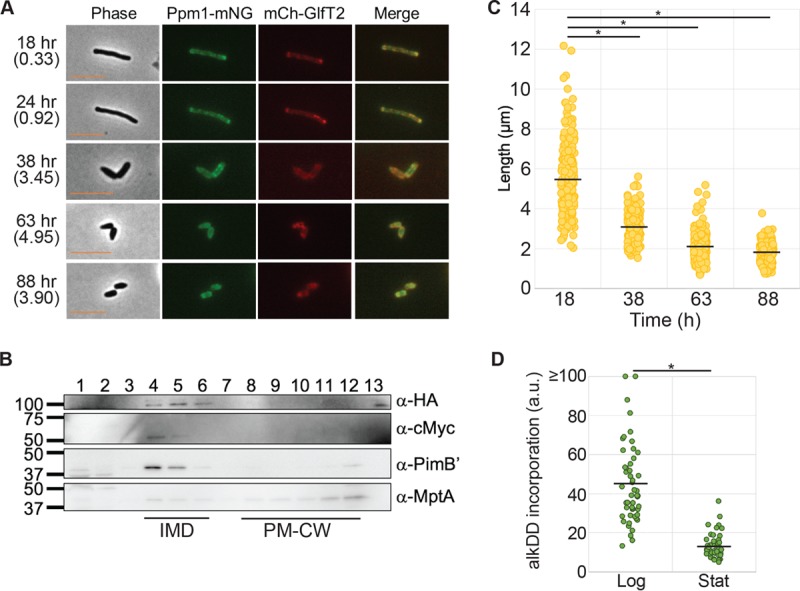
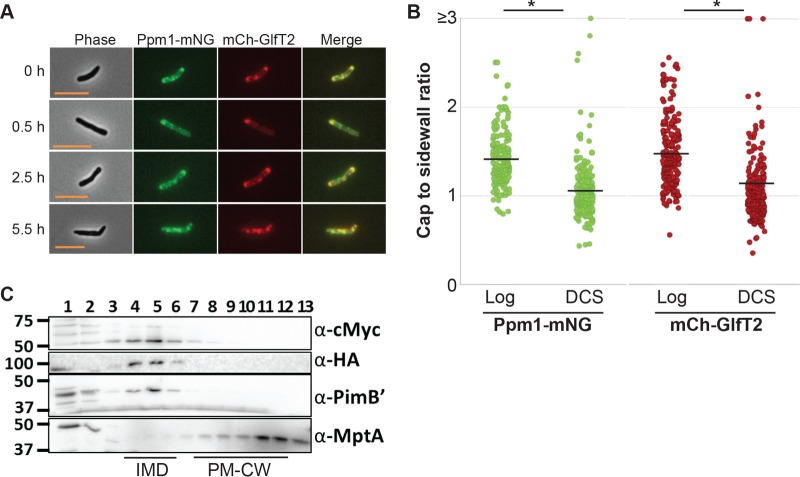
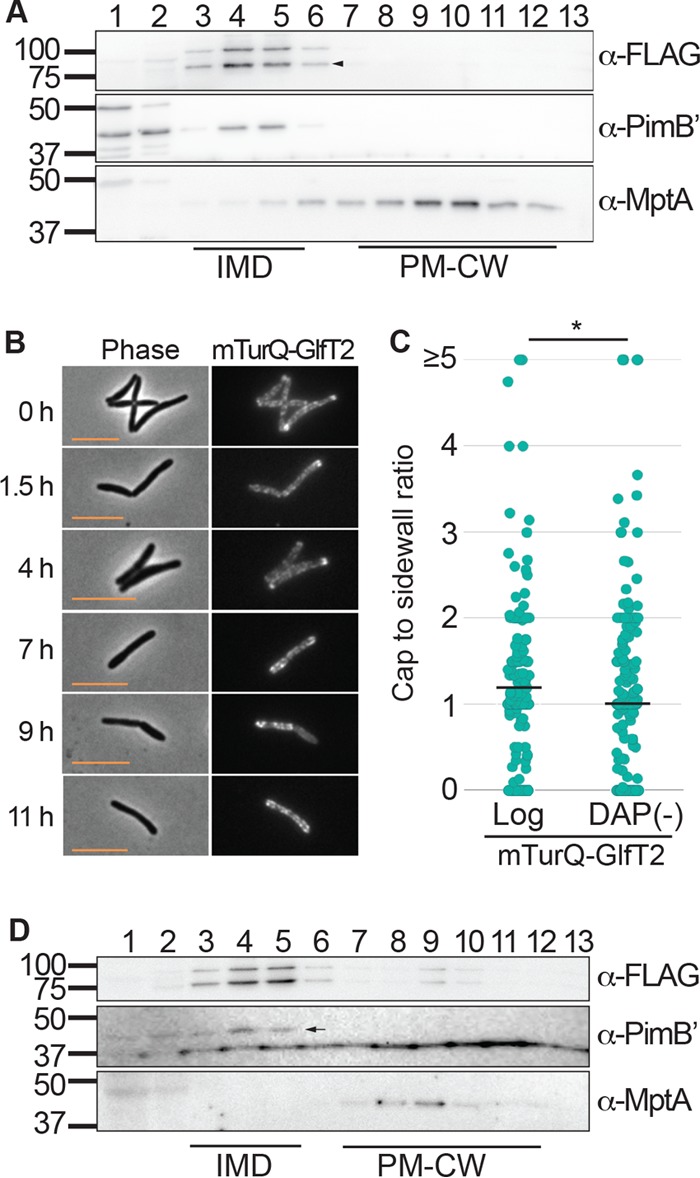
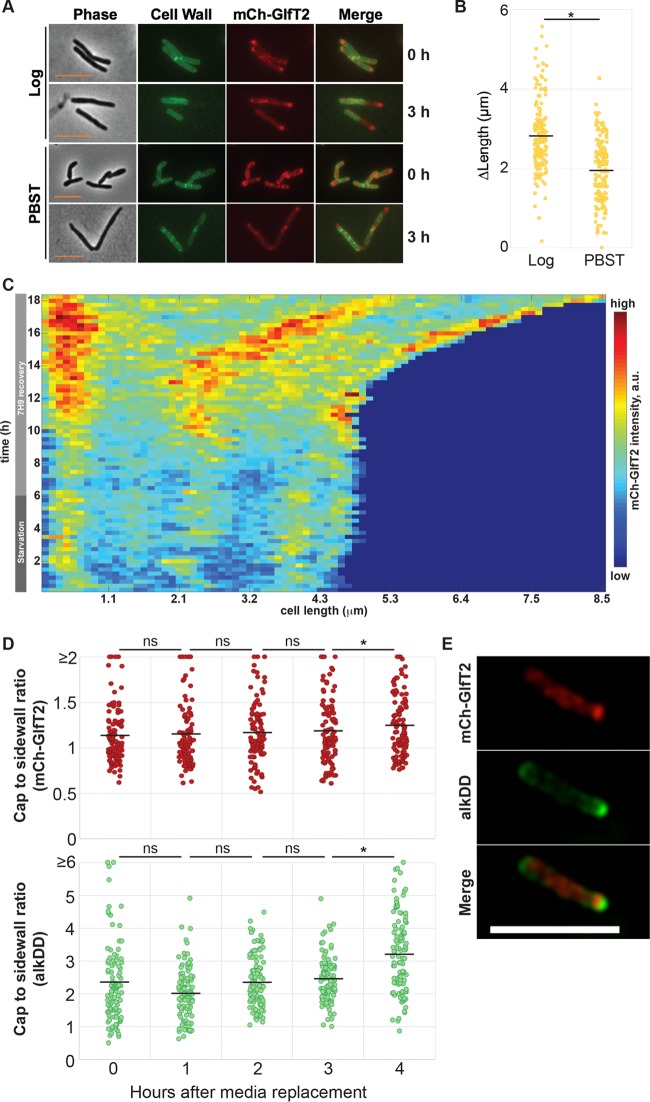
Cell elongation occurs primarily at the mycobacterial cell poles, but the molecular mechanisms governing this spatial regulation remain elusive. We recently reported the presence of an intracellular membrane domain (IMD) that was spatially segregated from the conventional plasma membrane in Mycobacterium smegmatis The IMD is enriched in the polar region of actively elongating cells and houses many essential enzymes involved in envelope biosynthesis, suggesting its role in spatially restricted elongation at the cell poles. Here, we examined reorganization of the IMD when the cells are no longer elongating. To monitor the IMD, we used a previously established reporter strain expressing fluorescent IMD markers and grew it to the stationary growth phase or exposed the cells to nutrient starvation. In both cases, the IMD was delocalized from the cell pole and distributed along the sidewall. Importantly, the IMD could still be isolated biochemically by density gradient fractionation, indicating its maintenance as a membrane domain. Chemical and genetic inhibition of peptidoglycan biosynthesis led to the delocalization of the IMD, suggesting the suppression of peptidoglycan biosynthesis as a trigger of spatial IMD rearrangement. Starved cells with a delocalized IMD can resume growth upon nutrient repletion, and polar enrichment of the IMD coincides with the initiation of cell elongation. These data reveal that the IMD is a membrane domain with the unprecedented capability of subcellular repositioning in response to the physiological conditions of the mycobacterial cell.IMPORTANCE Mycobacteria include medically important species, such as the human tuberculosis pathogen Mycobacterium tuberculosis The highly impermeable cell envelope is a hallmark of these microbes, and its biosynthesis is a proven chemotherapeutic target. Despite the accumulating knowledge regarding the biosynthesis of individual envelope components, the regulatory mechanisms behind the coordinated synthesis of the complex cell envelope remain elusive. We previously reported the presence of a metabolically active membrane domain enriched in the elongating poles of actively growing mycobacteria. However, the spatiotemporal dynamics of the membrane domain in response to stress have not been examined. Here, we show that the membrane domain is spatially reorganized when growth is inhibited in the stationary growth phase, under nutrient starvation, or in response to perturbation of peptidoglycan biosynthesis. Our results suggest that mycobacteria have a mechanism to spatiotemporally coordinate the membrane domain in response to metabolic needs under different growth conditions.
Keywords: Mycobacterium; cell envelope; membrane proteins; membranes; peptidoglycan; stress response.
Copyright © 2018 Hayashi et al.
Figures

Similar articles
-
Fluorescence Imaging-Based Discovery of Membrane Domain-Associated Proteins in Mycobacterium smegmatis.J Bacteriol. 2021 Oct 25;203(22):e0041921. doi: 10.1128/JB.00419-21. Epub 2021 Sep 13. J Bacteriol. 2021. PMID: 34516286 Free PMC article.
-
Mycobacterial Membrane Domain, or a Primordial Organelle?Yale J Biol Med. 2019 Sep 20;92(3):549-556. eCollection 2019 Sep. Yale J Biol Med. 2019. PMID: 31543716 Free PMC article. Review.
-
FhaA plays a key role in mycobacterial polar elongation and asymmetric growth.mBio. 2025 Mar 12;16(3):e0252624. doi: 10.1128/mbio.02526-24. Epub 2025 Jan 21. mBio. 2025. PMID: 39835815 Free PMC article.
-
Distinct Spatiotemporal Dynamics of Peptidoglycan Synthesis between Mycobacterium smegmatis and Mycobacterium tuberculosis.mBio. 2017 Sep 12;8(5):e01183-17. doi: 10.1128/mBio.01183-17. mBio. 2017. PMID: 28900018 Free PMC article.
-
Peptidoglycan in Mycobacteria: chemistry, biology and intervention.Glycoconj J. 2018 Oct;35(5):421-432. doi: 10.1007/s10719-018-9842-7. Epub 2018 Sep 19. Glycoconj J. 2018. PMID: 30232572 Review.
Cited by
-
Polar protein Wag31 both activates and inhibits cell wall metabolism at the poles and septum.Front Microbiol. 2023 Jan 12;13:1085918. doi: 10.3389/fmicb.2022.1085918. eCollection 2022. Front Microbiol. 2023. PMID: 36713172 Free PMC article.
-
Demethylmenaquinone Methyl Transferase Is a Membrane Domain-Associated Protein Essential for Menaquinone Homeostasis in Mycobacterium smegmatis.Front Microbiol. 2018 Dec 18;9:3145. doi: 10.3389/fmicb.2018.03145. eCollection 2018. Front Microbiol. 2018. PMID: 30619211 Free PMC article.
-
MmpL3, Wag31, and PlrA are involved in coordinating polar growth with peptidoglycan metabolism and nutrient availability.J Bacteriol. 2024 Oct 24;206(10):e0020424. doi: 10.1128/jb.00204-24. Epub 2024 Sep 25. J Bacteriol. 2024. PMID: 39320104 Free PMC article.
-
DivIVA concentrates mycobacterial cell envelope assembly for initiation and stabilization of polar growth.Cytoskeleton (Hoboken). 2018 Dec;75(12):498-507. doi: 10.1002/cm.21490. Epub 2018 Nov 30. Cytoskeleton (Hoboken). 2018. PMID: 30160378 Free PMC article.
-
Tuberculostearic Acid Controls Mycobacterial Membrane Compartmentalization.mBio. 2023 Apr 25;14(2):e0339622. doi: 10.1128/mbio.03396-22. Epub 2023 Mar 28. mBio. 2023. PMID: 36976029 Free PMC article.
References
-
- World Health Organization 2016. Global tuberculosis report 2016. World Health Organization, Geneva, Switzerland.
-
- Fukuda T, Matsumura T, Ato M, Hamasaki M, Nishiuchi Y, Murakami Y, Maeda Y, Yoshimori T, Matsumoto S, Kobayashi K, Kinoshita T, Morita YS. 2013. Critical roles for lipomannan and lipoarabinomannan in cell wall integrity of mycobacteria and pathogenesis of tuberculosis. mBio 4:e00472-12. doi: 10.1128/mBio.00472-12. - DOI - PMC - PubMed
-
- Camacho LR, Constant P, Raynaud C, Lanéelle MA, Triccas JA, Gicquel B, Daffe M, Guilhot C. 2001. Analysis of the phthiocerol dimycocerosate locus of Mycobacterium tuberculosis. Evidence that this lipid is involved in the cell wall permeability barrier. J Biol Chem 276:19845–19854. doi: 10.1074/jbc.M100662200. - DOI - PubMed
Publication types
MeSH terms
Substances
Grants and funding
LinkOut - more resources
Full Text Sources
Other Literature Sources
