. 2018 Jan 23;8(1):1399.
doi: 10.1038/s41598-018-19782-4.

Widespread modulation of gene expression by copy number variation in skeletal muscle

Affiliations

Widespread modulation of gene expression by copy number variation in skeletal muscle

Ludwig Geistlinger et al. Sci Rep. .

Abstract

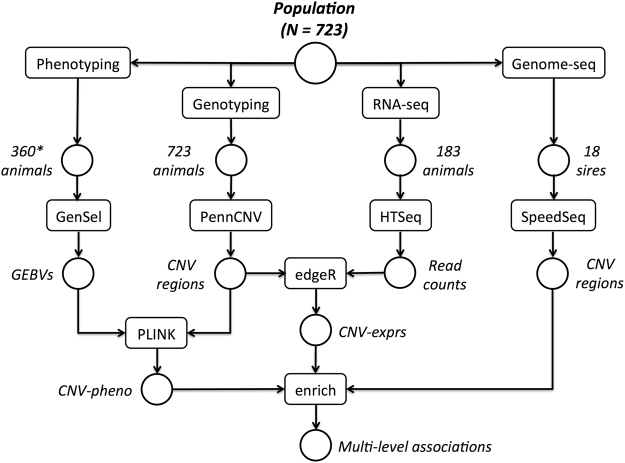
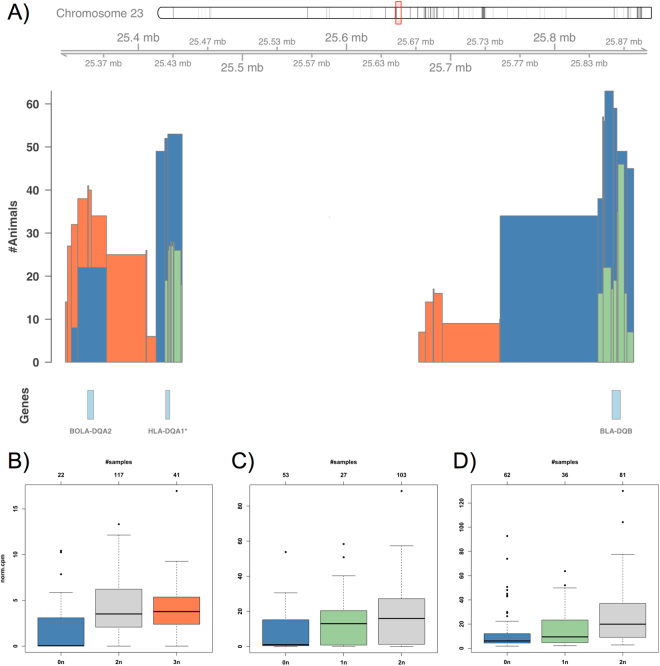
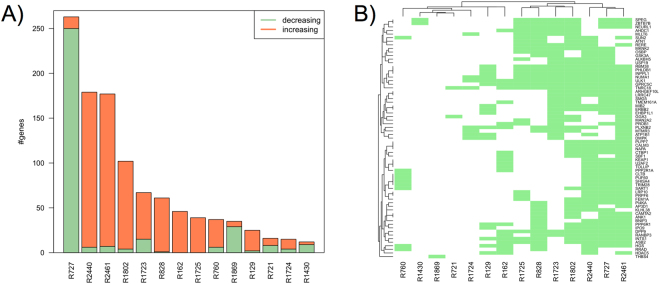
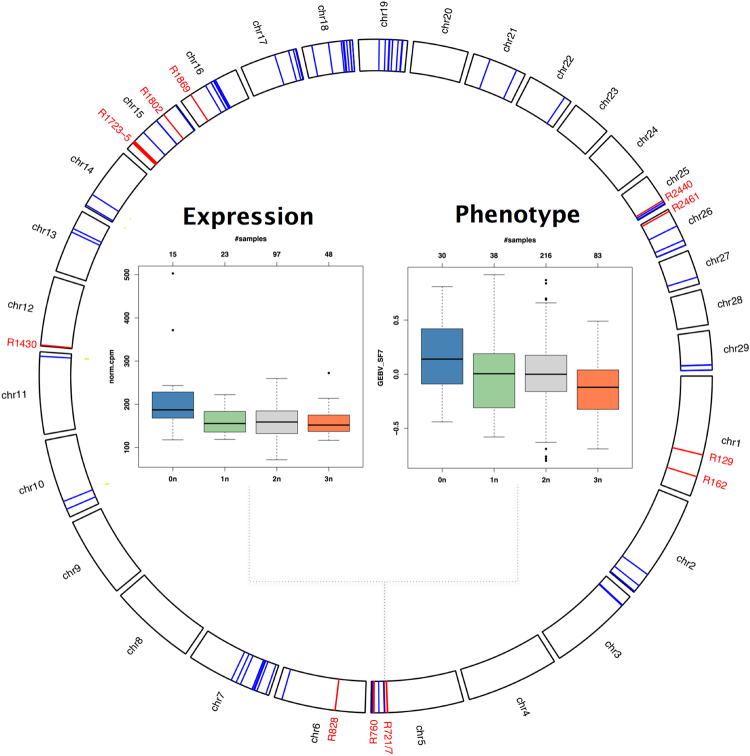
Copy number variation (CNV) is a frequently observed deviation from the diploid state due to duplication or deletion of genomic regions. Although intensively analyzed for association with diseases and production traits, the specific mechanisms and extent by which such variations affect the phenotype are incompletely understood. We present an integrative study on CNV and genome-wide gene expression in Brazilian Bos indicus cattle. We analyzed CNVs inferred from SNP-chip data for effects on gene expression measured with RNA-seq in skeletal muscle samples of 183 steers. Local effects, where expression changes coincided with CNVs in the respective genes, were restricted to immune genes. Distal effects were attributable to several high-impact CNVs that modulated remote expression in an orchestrated and intertwined fashion. These CNVs were located in the vicinity of major skeletal muscle pathway regulators and associated genes were enriched for proteolysis, autophagy, and muscle structure development. From association analysis between CNVs and several meat quality and production traits, we found CNV-associated expression effects to also manifest at the phenotype level. Based on genome sequences of the population founders, we further demonstrate that CNVs with impact on expression and phenotype are passed on from one generation to another.


Conflict of interest statement

The authors declare that they have no competing interests.

Figures

Figure 1
Figure 1
Study setup. The population under study comprises 723 Nelore steers produced by crossing 34 founding sires with commercial dams. All animals were subjected to genotyping and CNV analysis as described previously. A subset of 183 animals were additionally subjected to transcriptome analysis via RNA-seq in samples of skeletal muscle. The RNA-seq read counts were tested for association with the detected CNV regions using edgeR. Resulting CNV-expression associations were enriched with (i) CNV-phenotype associations as obtained with PLINK from association analysis between CNV regions and genomic estimated breeding values (GEBVs) and (ii) CNV regions as obtained from applying SpeedSeq to the genomes of 18 of the founding sires. See Material and Methods for details. *Phenotype measurements were obtained for varying fractions of the population as described in Supplementary Table S4.
Figure 2
Figure 2
Local effects of copy number variation: significant dosage effects of MHC genes. (A) Shown is the region on chromosome 23 harboring the MHC genes BOLA-DQA2, HLA-DQA1* (80% sequence similarity), and BLA-DQB. The histogram depicts the number of animals (y-axis) that have been called to contain a complete deletion (0n, blue), partial deletion (1n, green) or one copy gain (3n, orange) in the corresponding regions. The boxplots (B–D) show for each gene the expression (y-axis, normalized counts per million reads mapped) stratified by CN state (x-axis). The number of samples in each CN group is indicated on top of each plot. As an example, BOLA-DQA2 (bottom left in (A), Genes track) is called as 0n in 22 animals and as 3n in 41 animals (#Animals track in (A) and #samples axis on top of (B)), where the expression of BOLA-DQA2 is found significantly decreased for the blue 0n group in (B).
Figure 3
Figure 3
Distal effects of copy number variation: many-to-many relationships associated with consistent expression changes. (A) shows the 14 CNV regions (x-axis) that were found significantly associated with ≥10 genes (y-axis). The colors of the bars indicate how many genes showed either an increase (orange) or decrease (green) in expression with gain in copy number in the corresponding region. As an example, the leftmost bar indicates that expression of almost all R727-associated genes decreased with copy number gain in R727. The clustered adjacency matrix in (B) depicts the relationships between the 14 CNV regions (x-axis) and the 72 genes that were found significantly associated with ≥3 CNV regions (y-axis). For instance, R727 (second region from the right on the x-axis) is found associated with almost all of the depicted 72 genes on the y-axis. See also Fig. 4 and Supplementary Table S3 for genomic location of the genes and CNV regions.
Figure 4
Figure 4
Multi-level associations detected at the interface of copy number variation, gene expression and phenotype. The circle on the outside shows the genomic location of the 14 CNV regions (red) and the 72 most frequently affected genes (blue) from Fig. 3. The boxplot on the left shows the expression of SCGA (y-axis, normalized counts per million reads mapped) stratified by CN state in R727 (x-axis). Sarcoglycan Alpha (SCGA) is critical to the stability of muscle fiber membranes and is chosen here as a representative of the various R727-associated genes that display similar expression patterns. The boxplot on the right shows genomic estimated breeding values for shear force (7 days after slaughter, y-axis) stratified by CN state in R727 (x-axis). The number of samples in each CN group is indicated on top for both boxplots.
Figure 5
Figure 5
CNV synergy, inheritance and fine-mapping. The boxplots on the left show Sarcoglycan Alpha (SCGA) expression as stratified by CN state in (A) R727 and (B) R2440. Highlighted in red are the two samples carrying both expression-increasing alleles, i.e. 0n in R727 and 3n in R2440. Shown in (C) is the location of R727 (CNV track in red) and the COPS8* pseudogene (ENSBTAG00000047936) on chromosome 5. The #Offspring and #Sires tracks below show the number of offspring (out of 723) and sires (out of 34), respectively, that have been called by PennCNV to contain a complete deletion (0n, blue), partial deletion (1n, green) or one copy gain (3n, orange) in R727. The #Sires (seq) track at the bottom shows corresponding deletion calls from the CNV-seq approach. The region 103.28 ± 0.04 Mb that locates immediately upstream of the COPS8* pseudogene shows a peak of 0n calls (sample group with increased expression in (A)) in the offspring population as well as for the sires when calling CNVs from SNPs and sequencing data.

References

    1. Syvänen A. Accessing genetic variation: genotyping single nucleotide polymorphisms. Nat Rev Genet. 2001;2(12):930–42. doi: 10.1038/35103535. - DOI - PubMed
    1. McCarthy M, et al. Genome-wide association studies for complex traits: consensus, uncertainty and challenges. Nat Rev Genet. 2008;9(5):356–69. doi: 10.1038/nrg2344. - DOI - PubMed
    1. Bush W, Moore J. Chapter 11: Genome-wide association studies. PLoS Comput Biol. 2012;8(12):e1002822. doi: 10.1371/journal.pcbi.1002822. - DOI - PMC - PubMed
    1. 1000 Genomes Project Consortium An integrated map of structural variation in 2,504 human genomes. Nature. 2015;526(7571):75–81. doi: 10.1038/nature15394. - DOI - PMC - PubMed
    1. Hastings P, Lupski J, Rosenberg S, Ira G. Mechanisms of change in gene copy number. Nat Rev Genet. 2009;10(8):551–64. doi: 10.1038/nrg2593. - DOI - PMC - PubMed

Publication types

LinkOut - more resources