. 2018 Jan 23;8(1):1398.
doi: 10.1038/s41598-018-19546-0.

Making spectral shape measurements in inverse Compton scattering a tool for advanced diagnostic applications

Affiliations

Making spectral shape measurements in inverse Compton scattering a tool for advanced diagnostic applications

J M Krämer et al. Sci Rep. .

Abstract

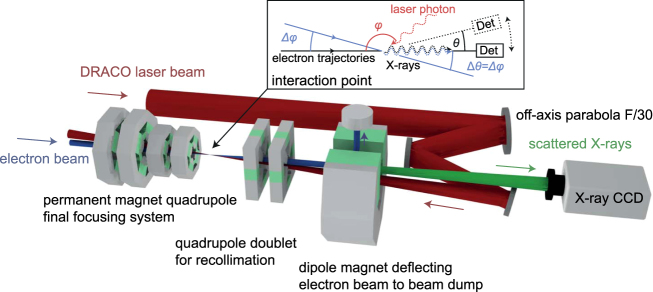
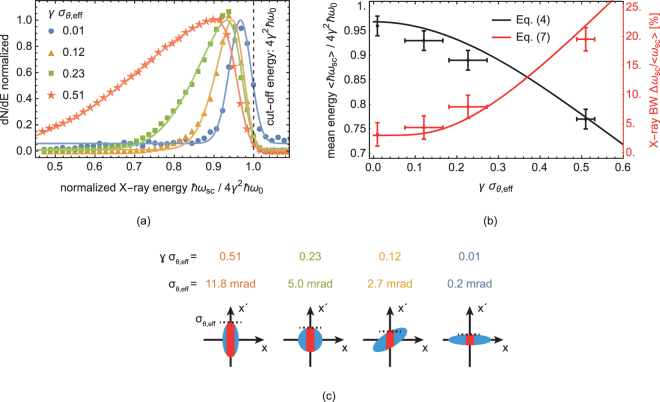
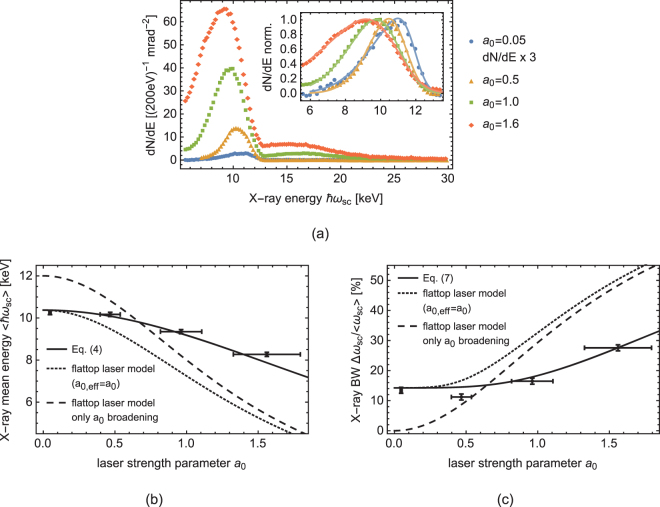
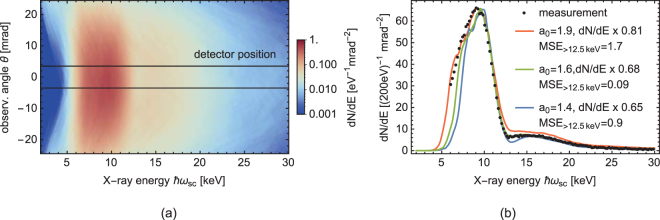
Interaction of relativistic electron beams with high power lasers can both serve as a secondary light source and as a novel diagnostic tool for various beam parameters. For both applications, it is important to understand the dynamics of the inverse Compton scattering mechanism and the dependence of the scattered light's spectral properties on the interacting laser and electron beam parameters. Measurements are easily misinterpreted due to the complex interplay of the interaction parameters. Here we report the potential of inverse Compton scattering as an advanced diagnostic tool by investigating two of the most influential interaction parameters, namely the laser intensity and the electron beam emittance. Established scaling laws for the spectral bandwidth and redshift of the mean scattered photon energy are refined. This allows for a quantitatively well matching prediction of the spectral shape. Driving the interaction to a nonlinear regime, we spectrally resolve the rise of higher harmonic radiation with increasing laser intensity. Unprecedented agreement with 3D radiation simulations is found, showing the good control and characterization of the interaction. The findings advance the interpretation of inverse Compton scattering measurements into a diagnostic tool for electron beams from laser plasma acceleration.


Conflict of interest statement

The authors declare that they have no competing interests.

Figures

Figure 1
Figure 1
Schematic drawing of the interaction geometry. The electron beam (blue) is focused to the interaction point with a magnetic final focusing system. After interaction it is collimated again and deflected to a beam dump with a dipole magnet. The laser (red) is focused with an off-axis parabola (F/30). The interaction angle is close to head-on with a small angle of 22 mrad to have a clear path for the X-rays (green). The X-rays are detected with a CCD camera. Angles at the interaction point are illustrated in the schematic drawing of the interaction.
Figure 2
Figure 2
Broadening and redshift of the ICS spectra with increasing effective divergence of the electron beam and 4γ2ħω0 = 12.9 keV. (a) Measured ICS spectra (dots) with fitted skew normal distributions (solid lines) to derive mean energy and bandwidth. The normalization of the plot causes the cut-off energy for γσθ,eff = 0.01 to appear blueshifted, since the absolute flux was lower than in the other measurements by a factor of about 50. (see Supplementary Figure 2 for spectra with absolute photon numbers). (b) Dependence of mean energy and bandwidth derived from (a) on the effective divergence and comparison to Eqs 4 and 7. Error bars represent the measurement uncertainty of the electron beam divergence and the X-ray detector resolution. (c) Sketch (not to scale) of the electron beam phase space (blue) and the overlap with the laser (red) for the spectra in (a).
Figure 3
Figure 3
(a) Measured ICS spectra for various a0. The inset shows the redshift and broadening of the normalized fundamental. Dots represent measurements and solid lines are fitted skew normal distributions to derive mean energy and bandwidth. (b) and (c) Dependence of mean energy and bandwidth derived from (a) on the (peak) laser strength parameter a0 and comparison to Eqs 4 and 7 for the given setup (solid lines) using a Gaussian laser envelope (a0,eff = 0.55a0). Dotted lines represent the scalings for a flattop laser model with a0,eff = a0 and dashed lines neglect other broadening and redshifting effects from e.g. the electron beam emittance. Error bar represent the estimated, combined measurement uncertainty of a0 and the X-ray detector resolution.
Figure 4
Figure 4
Comparison of measurement data with clara2 simulation for the a0 = 1.6 measurement. (a) Simulated ICS spectra in the 1/γ cone along the laser polarization plane (logarithmic color scale). The box indicates the detector position, for which the on-axis spectrum in (b) is integrated. (b) Comparison of the measured on-axis spectrum (black dots) with simulated spectra (solid lines). The green line shows a simulation, which matches the measurement well in shape of the second harmonic and its flux ratio to the fundamental. In red (blue), a spectrum with too high (low) laser intensity indicates the sensitivity of the second harmonic to this parameter. The mean square error (MSE) for energies above 12.5 keV is listed as an indicator for the goodness of the fit. From the comparison, the refined laser parameter for this measurement are determined as a0 = 1.6 (2.25 J and 35 fs).

References

    1. Eichner T, et al. Miniature magnetic devices for laser-based, table-top free-electron lasers. Phys. Rev. Spec. Top. - Accel. Beams. 2007;10:082401. doi: 10.1103/PhysRevSTAB.10.082401. - DOI
    1. Fuchs M, et al. Laser-driven soft-X-ray undulator source. Nat. Phys. 2009;5:826–829. doi: 10.1038/nphys1404. - DOI
    1. Habs D, et al. Vision of nuclear physics with photo-nuclear reactions by laser-driven γ beams. Eur. Phys. J. D. 2009;55:279–285. doi: 10.1140/epjd/e2009-00101-2. - DOI
    1. Albert F, Thomas AGR. Applications of laser wakefield accelerator-based light sources. Plasma Phys. Control. Fusion. 2016;58:103001. doi: 10.1088/0741-3335/58/10/103001. - DOI
    1. Achterhold K, et al. Monochromatic computed tomography with a compact laser-driven X-ray source. Sci. Rep. 2013;3:1313. doi: 10.1038/srep01313. - DOI - PMC - PubMed

Publication types

LinkOut - more resources