. 2017 Nov 27:9:ecurrents.outbreaks.5afb0bfb8cf31d9a4baba7b19b4edbac.
doi: 10.1371/currents.outbreaks.5afb0bfb8cf31d9a4baba7b19b4edbac.

A Possible Link Between Pyriproxyfen and Microcephaly

Affiliations

A Possible Link Between Pyriproxyfen and Microcephaly

Raphael Parens et al. PLoS Curr. .

Abstract

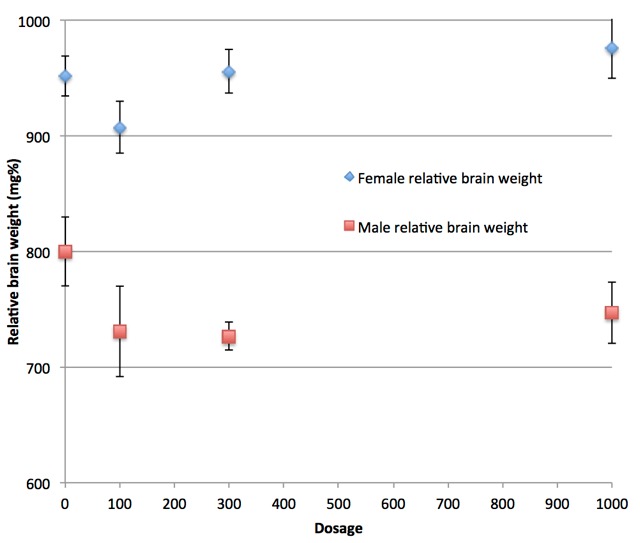
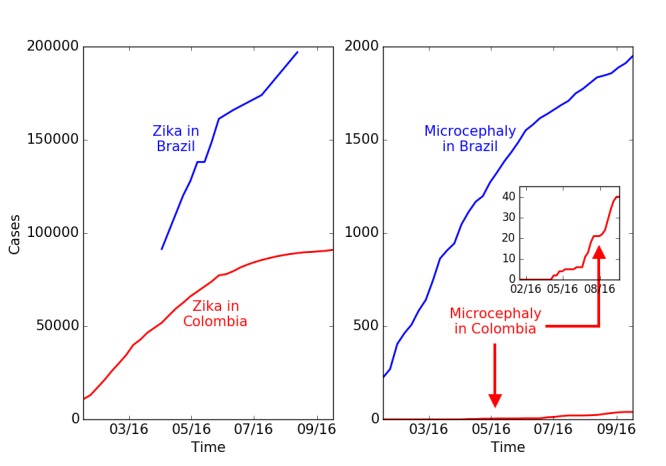
The Zika virus has been the primary suspect in the large increase in incidence of microcephaly in 2015-6 in Brazil. While evidence for Zika being the cause of some of the cases is strong, its role as the primary cause of the large number of cases in Brazil has not been confirmed. Recently, the disparity between the incidences in different geographic locations has led to questions about the virus's role. Here we consider the alternative possibility that the use of the insecticide pyriproxyfen for control of mosquito populations in Brazilian drinking water is the primary cause. Pyriproxifen is a juvenile hormone analog which has been shown to correspond in mammals to a number of fat soluble regulatory molecules including retinoic acid, a metabolite of vitamin A, with which it has cross-reactivity and whose application during development has been shown to cause microcephaly. Methoprene, another juvenile hormone analog that was approved as an insecticide based upon tests performed in the 1970s, has metabolites that bind to the mammalian retinoid X receptor, and has been shown to cause developmental disorders in mammals. Isotretinoin is another example of a retinoid causing microcephaly in human babies via maternal exposure and activation of the retinoid X receptor in developing fetuses. Moreover, tests of pyriproxyfen by the manufacturer, Sumitomo, widely quoted as giving no evidence for developmental toxicity, actually found some evidence for such an effect, including low brain mass and arhinencephaly-incomplete formation of the anterior cerebral hemispheres-in exposed rat pups. Finally, the pyriproxyfen use in Brazil is unprecedented-it has never before been applied to a water supply on such a scale. Claims that it is not being used in Recife, the epicenter of microcephaly cases, do not distinguish the metropolitan area of Recife, where it is widely used, and the municipality, and have not been adequately confirmed. Given this combination of information about molecular mechanisms and toxicological evidence, we strongly recommend that the use of pyriproxyfen in Brazil be suspended until the potential causal link to microcephaly is investigated further.

Keywords: Brazil; Pyriproxyfen; Zika; microcephaly.


Figures

Brain weight of male rat pups relative to body weight on postnatal day 56.
Ranges are standard error of the mean. One value is statistically signficant (300 mg/kg). The importance of this value is dismissed by Sumitomo (and we can infer by regulatory authorities who approved the use of pyriproxyfen in drinking water). The reason for this dismissal is that the 1000 mg/kg dosage value is not statistically significant and it is assumed that if pyriproxyfen is the cause of the low brain mass then the higher dosage level would also give a statistically significant result. Note, however, that the 1,000 mg/kg value (as well as the 100 mg/kg value) are low relative to the control and their values are not statistically different from the 300 mg/kg value. Remarkably, this failure of proper statistical reasoning appears to be the reason for regulatory approval.
Reported cases of microcephaly and of Zika in Brazil and Colombia.
A. Cumulative reported cases of Zika in Brazil and Colombia. B. Total microcephaly cases reported in Brazil and Zika associated microcephaly cases reported in Colombia. The number of Zika cases in Colombia is lower by a factor of 2, while the number of microcephaly cases is lower by a factor of 50. (Brazil reports total microcephaly numbers and does not distinguish those linked to Zika. Colombia reports only Zika-linked microcephaly cases. The historical background rate of microcephaly in Colombia is 140 per year.)
Comparison of reported cases in Colombia with background and Zika causal models.
Reported cases of Zika and microcephaly (red dots) are compared with expected number of background cases due to coincidence of microcephaly with Zika infections at a rate of 2 per 10,000 births (gray) and two models of Zika-induced microcephaly suggested by the study in French Polynesia. The first assumes that pregnancies infected in the first trimester have a 1:100 rate of microcephaly; the second assumes that pregnancies infected in the first and second trimester have a 1:200 rate of microcephaly. The data is consistent with just background cases until the report of epidemiological week 24, ending June 18. The data in weeks 24 through 27 is reasonably consistent with the first trimester model, but not with later weeks. The overall rate is much lower than that consistent with the number of cases in northeast Brazil.
Population of Zika infected pregnancies.
To model the Colombian Zika and microcephaly epidemic, the reported number of symptomatic cases per week until March 28 (green line) is normalized by the number of reported Zika infected pregnancies (11,944, shaded purple) and multiplied by 5 to obtain the total number of symptomatic and asymptomatic cases (red shading), due to the observation of four Zika and microcephaly cases that do not have Zika symptoms. While we don't use it directly, the total number of Zika infections can be estimated (blue line) by similarly multiplying the number of reported cases, correcting for the bias in reporting between women and men, assuming the infection rate is comparable. Other assumptions about the total number of cases do not affect the results reported here.
None
Fig. 7: Pregnancies during a particular week (vertical axis) present during a particular epidemiological week (horizontal axis). (A) Total number of pregnancies, (B) the number of pregnancies exposed in the first trimester, and (C) the number of pregnancies exposed in either the first or second trimester. A uniform exposure by week of pregnancy is assumed. The number of births in each category is approximately the number that crosses the 39/40 week boundary (horizontal black line), but it is more accurately given by weighting them according to the distribution of births from week 35 through 43.
None
Fig. 8: Cumulative Zika (blue) and microcephaly (red) cases over time in five northeast Brazilian states and the state with the largest number of cases elsewhere, Rio de Janeiro (log scale). Blue and red dots are separated by 33 weeks, the expected delay between first trimester infections and expected microcephaly births caused by them. The differences in ratios in different states (Figure 10) suggests that Zika is not the cause of microcephaly.
None
Fig. 9: Weekly Zika (blue) and microcephaly (red) reports over time in each Brazilian state. Note the multipliers for the microcephaly numbers. If Zika is the cause of the cases of microcephaly a delay of about 33 weeks should be seen between peaks of the former and latter. This appears to be the case for Bahia, Ceara, and Alagoas for early peaks of Zika and later peaks of microcephaly. We note that if seasonal use of insecticides coincides with outbreaks, then the cause may also be those insecticides. A filter (0.25, 0.5, 0.25) has been applied to smooth the data.
None
Fig. 10: Ratio of microcephaly cases to Zika cases 33 weeks earlier as a function of time for all Brazilian states. The horizontal green line represents a ratio of 1% and the purple horizontal line represents a ratio of 0.05%. To obtain the number of microcephaly cases per first trimester Zika infected pregnancy (rather than all Zika cases) we would have to include both unreported Zika cases and multiply by the proportion of pregnancies, multiplying the ratio by a factor of 25. Differences between rates would remain.
None
Fig. 11: Comparison of Zika and microcephaly cases in Bahia, Brazil. We compare reported microcephaly cases with or without symptoms of Zika (red dots) with the projected number of cases for susceptibility up to weeks 8, 10, 12, 14, 16 (shades of darker blue) with microcephaly in 84%, 71%, 63%, 56%, 49% of the Zika pregnancies (optimized fit), based upon the reported number of Zika infections (green shows estimated Zika infected pregnancies per week of gestation). The left green peak gives rise to the central red/blue peak due to the delay between first trimester infection and the births. The inset shows the goodness of fit for different numbers of weeks in which infections cause microcephaly. The best fit overall occurs for susceptibility up to 16 weeks, but the initial rise is more consistent with 8 weeks, suggesting that the Zika-induced microcephaly cases are likely due to infections approximately during the second month of pregnancy rather than the first trimester as a whole.
None
Fig. 12: Plots of Zika and microcephaly cases in Brazil Plots (log scale) are shown for eight states of Brazil: Pernambuco (PE), Bahia (BA), Paraiba (PB), Ceará (CE), São Paulo (SP), Rio de Janeiro (RJ), Mato Grosso (MT), and Rio Grande do Norte (RN). Bahia has the highest counts of Zika relative to microcephaly six months later when births of pregnancies exposed in the first trimester are expected.
None
Fig. 13: Same as Figure 12, but using a linear scale.
None
Fig. 14: Microcephaly versus elevation by Colombian department Each point represents the reported rate of microcephaly per capita (not per Zika infection) among departments of Colombia versus the elevation of their most populace city. Only departments with more than 10,000 births are shown and color of points reflect the total number of births in the department (scale on right). According to the report, high elevation cities (above 2,000 m) do not have self-propagating Zika infections. This includes Bogota and its suburbs which constitute two departments, Bogota and Cundinamarca, at 2,640 m. The observations suggest a background (non-Zika associated) rate of 5.7 per 10,000 births in 2016 given the study's methodology. The only department consistent with the previous year's background rate of 2.1 is that of Nariño, whose most populous city Pasto is at 2,527 m. The rate observed, 2.2, results from only 3 cases in 14,000 births, so that statistics are very limited compared to the 60 observed in the Bogota area.

References

    1. (2016) Saude investiga 4.231 casos de microcefalia. Instituto Nacional de Salud: Boletim.
    1. (2016) Zika cases and congenital syndrome associated with Zika virus reported by countries and territories in the Americas, 2015-2016, Cumulative cases. World Health Organization.
    1. (2015) Zika virus infection, Brazil and Colombia. Disease outbreak news, World Health Organization.
    1. Mlakar J, Korva M, Tul N, Popovic M, Poljvsak-Prijatelj M, et al. (2016) Zika virus associated with microcephaly. The New England Journal of Medicine. doi: 10.1056/NEJMoa1600651. - PubMed
    1. Tang H, Hammack C, Ogden SC, Wen Z, Qian X, et al. (2016) Zika virus infects human cortical neural progenitors and attenuates their growth. Cell Stem Cell. doi: 10.1016/j.stem.2016.02.016. - PMC - PubMed

LinkOut - more resources