Review
. 2018 Apr 25;118(8):4120-4155.
doi: 10.1021/acs.chemrev.7b00519. Epub 2018 Jan 24.

Life under the Microscope: Single-Molecule Fluorescence Highlights the RNA World

Affiliations
Review

Life under the Microscope: Single-Molecule Fluorescence Highlights the RNA World

Sujay Ray et al. Chem Rev. .

Abstract

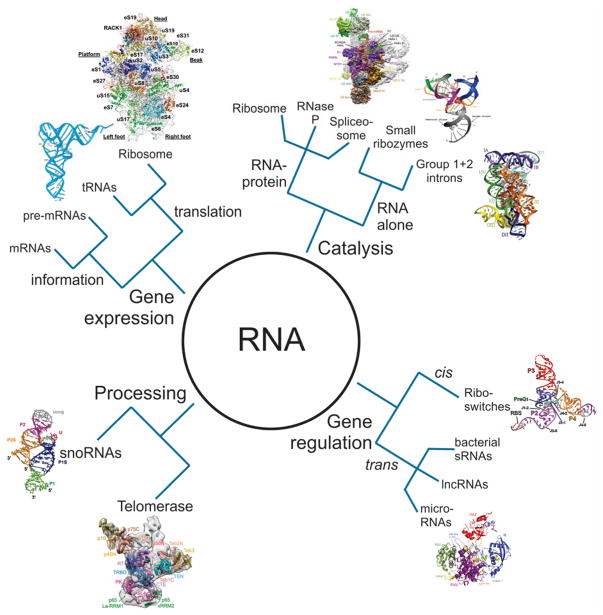
The emergence of single-molecule (SM) fluorescence techniques has opened up a vast new toolbox for exploring the molecular basis of life. The ability to monitor individual biomolecules in real time enables complex, dynamic folding pathways to be interrogated without the averaging effect of ensemble measurements. In parallel, modern biology has been revolutionized by our emerging understanding of the many functions of RNA. In this comprehensive review, we survey SM fluorescence approaches and discuss how the application of these tools to RNA and RNA-containing macromolecular complexes in vitro has yielded significant insights into the underlying biology. Topics covered include the three-dimensional folding landscapes of a plethora of isolated RNA molecules, their assembly and interactions in RNA-protein complexes, and the relation of these properties to their biological functions. In all of these examples, the use of SM fluorescence methods has revealed critical information beyond the reach of ensemble averages.


Conflict of interest statement

Notes

The authors declare no competing financial interest.

Figures

Figure 1
Figure 1. The many roles of RNA in biology
Different RNA structures were reproduced with permission from the following references. Ref Copyright 2000 RNA Society, Ref Copyright 2007 The National Academy of Sciences of the USA, Ref Copyright 2008 American Association for the Advancement of Science, Ref Copyright 2012 Elsevier Inc, Ref Copyright 2015, American Association for the Advancement of Science, Ref Copyright 2015 Macmillan Publishers Limited, Ref Copyright 2017 Macmillan Publishers Limited, Ref , Ref .
Figure 2
Figure 2. Photo-physical properties of fluorescent molecules and different SM excitation and emission methods
(a) Jabłoński Diagram: A photo-physical description of fluorescence. S0, S1-Sn, and T1-Tn represent the singlet ground state, singlet excited states and triplet excited states respectively. Schematic representations of excitation and emission pathway of different SM microscopes: (b) confocal, (c) objective type TIRF and (d) prism type TIRF.
Figure 3
Figure 3. The different single molecule fluorescence techniques employed in RNA research
The schematics represent Single molecule (a) Fluorescence co-localization, (b) Fluorescence hybridization, (c) Förster resonance energy transfer, (d) Protein induced fluorescence enhancement, (e) Zero mode waveguide, and (f) Fluorescence correlation spectroscopy.
Figure 4
Figure 4. smFRET studies of the hairpin ribozyme
(a) Schematic of the hairpin ribozyme with only two internal loops. (b) Single-molecule and bulk solution measurements of enzymatic activities. The FRET efficiency histogram showed three distinct ribozyme populations: undocked (EFRET=0.15), docked(EFRET=0.81), and substrate-free ribozymes (EFRET=0.38). The S-free fraction is plotted against time, indicating heterogeneous reaction kinetics. (c) The undocking kinetics suggests four docked states of distinct stabilities. The inset represents other representative exponential fits that fit the data poorly. Panel (b) and (c) are reproduced with permission from Ref Copyright 2002 American Association for the Advancement of Science. (d) Schematic of the hairpin ribozyme with two internal loops and a four-way junction. (e) Structural transitions in single hairpin ribozyme molecules and loop-free 4H junctions at different Mg2+ concentration. Reproduced with permission from Ref Copyright 2003 The National Academy of Sciences of the USA. (f) smFRET study to assign cleaved and ligated states of hairpin ribozyme. The schematics of the assay to identify the ligated (Left top panel) and cleaved (Right top panel) form of the ribozyme. A sample SM time trace (left bottom panel) shows that upon addition of 1 mM Mg2+ (blue arrow) the ribozyme docks (high FRET) and remains docked until it exhibits a brief period of rapid undocking and docking signifying a cleavage event (purple bar). A sample time trace (right bottom panel), showing rapid docking-undocking (indicated by the purple bar) before a transition to the stably docked state. Reproduced with permission from Ref Copyright 2004 Nature Publishing Group.
Figure 5
Figure 5. SM studies of various riboswitches
(a) Generalized mechanisms for riboswitch-mediated transcriptional and translational gene expression regulation. (b) single-molecule smFRET experiments show Mg2+ and ligand dependent docking between P2–P3 stem for adenine riboswitch. Reproduced with permission from Ref Copyright 2010 American Chemical Society (c) Dynamics of pseudoknot formation of the SAM-II riboswitch: FRET histograms showing the mean FRET values of each state observed for the SAM-II riboswitch in the absence of Mg2+ and SAM ligand (left), 2mM Mg2+ and SAM ligand (center), 2mM of Mg2+ and 10 μM SAM ligand (right). Reproduced with permission from Ref Copyright 2011 Nature America, Inc. (d) schematic of smFRET experiments for ligand dependent riboswitch study(left). Fraction of ligand dependent riboswitch folding (right). Reproduced with permission from Ref Copyright 2013, Oxford University Press. (e) Repeated binding and dissociation of the anti-SD probe labelled with Cy5 is monitored through co-localization with the mRNA. Representative SM trace shows bursts (green bars) and non-burst periods (red bars) identified through spike train analysis. Reproduced with permission from Ref Copyright 2016 Nature Publishing Group (f) Representative SM traces showing KL docking kinetics in the absence (left) and presence (right) of hydroxocobalamin (HyCbl). Ligand binding significantly diminishes the fluorescence intensity providing an independent signature of ligand binding. HyCbl binding significantly decreases the undocking time. Reproduced with permission from Ref Copyright 2014 American Chemical Society.
Figure 6
Figure 6. smFRET studies of RNA kissing-loop interaction
(a) Typical single-molecule time traces with donor (blue) and acceptor (red). The corresponding FRET trajectory shows states with FRET efficiencies of 0.0 and 0.5, representative of single hairpin and assembled kissing complexes, respectively. The bottom panel shows a FRET trace in which after several kissing interactions extended duplex formation is observed in real time. (b) FRET efficiency histogram shows 0.0, 0.5 and 1.0 FRET states representative of single hairpin, kissing complex formation and extended duplex formation. Each schematic represents the corresponding states. After formation of the duplex, the molecules are trapped in that form under experimental conditions. Reproduced with permission from Ref Copyright 2012 Biophysical Society.
Figure 7
Figure 7. Various examples of SM studies of protein-RNA interaction
(a) Schematic of partial duplex DNA/RNA construct for smFRET based duplex unwinding studies of RNA helicases. The 3′ single strand overhang serves as a motif for protein binding. The acceptor is attached at the single strand-double strand junction and the donor is attached either at the junction (Myong et. al.) or at the 3′ end (Fairman-Williams et. al.). (b) NS3 unwinds duplex DNA in 3-bp steps. Six unfolding steps are identified for 18bp duplex. Reproduced with permission from Ref Copyright 2002 American Association for the Advancement of Science (c) Representative smFRET time trace showing two structurally different conformations upon NPH-II binding to RNA. (d) smFRET histograms of NPH-II binding to RNA. Lines indicate Gaussian fits of each FRET population. NPH-II binding to RNA partial duplex shows at least two distinct conformations (FRET 0.33 and 0.15) compared to the protein unbound RNA (FRET 0.85). Upon addition of ATP the duplex is unfolded, and the donor strand is released. Panel (c) and (d) are reproduced with permission from Ref Copyright 2011 Elsevier Ltd. (e) Experimental design for quantized photobleaching of fluorescent pRNA in procapsid/pRNA complexes. Each pRNA is labeled with a dye at its 5′ end. (f) Photobleaching analysis of procapsid-pRNA complex. Fluorescence intensity plots over time showing six steps in photobleaching. g) Fitting a statistical model to the empirical photobleaching step histogram supports binding of three dimers as opposed to six monomers. Panel (e), (f) and (g) are reproduced with permission from Ref Copyright 2007 European Molecular Biology Organization. h) Sequence and secondary structure of the RRE construct. i) Representative fluorescence intensity trajectory for a single complex of Rev and RRE. The fluorescence intensity histogram shown on the right is fit with 4 Gaussian peaks (black lines), corresponding to discrete Rev: RRE stoichiometry. Panel (h) and (i) are reproduced with permission from Ref .
Figure 8
Figure 8. Recognition of RNA interference targets by Ago2
(a) The miRNA biogenesis pathway. Colored stars indicate the labeling sites used for various studies discussed in the text. (b) Left: Binding of Ago2 loaded with fluorophore-labeled miRNA to a labeled, immobilized RNA target. Right: The bound time Δτ was determined as a function of the number of miRNA-target base pairs. It increases greatly when a 7-nucleotide seed sequence at the 5′ end of the miRNA is fully paired. (c) 1D diffusion of Ago2 was studied using an immobilized RNA target with two adjacent binding sites (left). A high-FRET state is observed when Ago2 is bound at “Site 1”, and a mid-FRET state is observed when it is bound at “Site 2” (right). Ago2 was found to fluctuate between the two binding sites without dissociating, implicating sliding as a mechanism for target location. Reproduced with permission from Ref Copyright 2015 Elsevier Inc.
Figure 9
Figure 9. Study of CRISPR systems from E. coli and S. pyogenes
(a) Pathway of target recognition, binding and DNA degradation by guide RNA-Cas protein complexes. Colored stars indicate the labeling sites used for various studies discussed in the text. (b) Binding of quantum dot-labeled E. coli Cascade complex (purple) to a DNA curtain (green) at varying Cascade concentrations. Left: A target sequence with a wild-type PAM at position ~29 kbp is populated at low Cascade concentrations, and a second target with a mutant PAM at position ~21 kbp additionally becomes populated at higher concentrations. Right: Translocation of Cas3 is unidirectional at targets with WT PAM sequences (green) and bidirectional at targets with mutant PAM sequences (pink). Reproduced with permission from Ref Copyright 2015 Elsevier Inc. (c) Conformational changes in a doubly-labeled DNA target upon binding to immobilized Cascade. Three different DNA conformations are observed upon initial binding to a target with a WT PAM, whereas only two are observed upon binding to a mutant PAM sequence. Reproduced with permission from Ref Copyright 2015 Elsevier Inc. (d) Detection of binding of S. pyogenes Cas9 to fluorophore-labeled DNA targets. Several mismatches between the guide RNA and target are tolerated distal to the PAM, whereas the target region proximal to the PAM is highly sensitive to mismatches. Reproduced with permission from Ref Copyright 2017 Macmillan Publishers Limited, part of Springer Nature.
Figure 10
Figure 10. Molecular mechanisms of E. coli RNA polymerase and HIV reverse transcriptase
(a) Left: Schematic of a bacterial transcription complex containing RNA polymerase, template (tDNA) and nontemplate (ntDNAs) and nascent RNA. Right: Events in the life cycle of HIV that are catalyzed by HIV RTase. (b) DNA dynamics during early transcription were studied by placing fluorophores upstream and downstream of the transcription bubble. As NTPs were added, “scrunching” of the DNA yielded increasingly high FRET states. A long pause often precedes addition of the 7th NTP (right). Reproduced with permission from Ref Copyright 2016 The Author(s) (c) Multiple binding modes of HIV RTase. RTase binds in opposite orientations on duplex DNA and RNA/DNA hybrids, resulting in high- and low-FRET states, respectively (top). On PPTs, it can spontaneously transition between these two orientations (bottom). Reproduced with permission from Ref Copyright 2008 Nature Publishing Group (d) RTase can slide to the end of a target after binding, indicated by an increase in FRET efficiency shortly after binding (upper left). If RTase arrives at the end of the primer in a polymerization-incompetent, it can flip orientations, leading to the observation of a transient high-FRET state prior to flipping (upper right). Reproduced with permission from Ref Copyright 2008 American Association for the Advancement of Science.
Figure 11
Figure 11. SM studies of the telomerase RNP holoenzyme
(a) Top: Telomeres are protected from DNA damage by the Shelterin protein complex, and are extended by the RNA-templated telomerase reverse transcriptase. Bottom: The same six-nucleotide template portion of telomerase RNA is re-used to synthesize multiple telomeric repeats. Adapted with permission from Ref Copyright 2017 by Annual Reviews. (b) After synthesis of a repeat, the DNA substrate fluctuates between different alignment registers with TR. The newly-formed RNA/DNA hybrid is eventually trapped in the active site for further extension. When the fluorophores are placed on TR and the DNA substrate, this results in fluctuations between low- and high-FRET states. Reproduced with permission from Ref Copyright 2014 Macmillan Publishers. (c) Telomere extension detected by binding of fluorescent probes to telomeric repeats. After addition of dNTPs, an activation period is followed by an extension period in which multiple repeats are rapidly added. Right: the protein co-factors POT1 and TPP1 decrease the time required for extension without impacting the time required for activation. POT1 and TPP1 were also found to enhance repeat addition processivity. Reproduced with permission from Ref Copyright 2014 Macmillan Publishers Limited.
Figure 12
Figure 12. Assembly, catalytic activation, and regulation of the spliceosome
(a) The splicing cycle, indicating binding and dissociation of the snRNPs and steps in which ATP hydrolysis is required to promote conformational rearrangements. (b) Spliceosome assembly was studied by monitoring the binding and dissociation of fluorophore-labeled snRNPs. Binding is reversible (upper right), but has a largely enforced order of U1, followed by U2, U5 (likely as part of the tri-snRNP), and the NTC (bottom). Reproduced with permission from Ref Copyright 2011, American Association for the Advancement of Science (c) Study of the Bact-to-B*-to-C complex transition by single-molecule pull-down FRET with the BP and 5′SS labeled. FRET traces show the static mid-FRET state that characterizes the Bact complex, fluctuations between mid-FRET and high-FRET states that characterize the branching-competent B* complex, and relatively stable high-FRET state that characterizes the post-branching C complex. Reproduced with permission from Ref Copyright 2013 Nature America, Inc. (d) Left: pre-mRNA conformations in stalled spliceosomes were studied following purification via glycerol gradient centrifugation. Middle: the helicase Prp16 can separate the branchpoint and 5′SS after branching. When the BP and 5′SS are labeled, this results in a shift of population to lower EFRET upon addition of Prp16. Right: the helicase Prp22 can separate the 5′SS and 3′SS before exon ligation. When the 5′SS and 3′SS are labeled, this results in a shift of population to lower EFRET upon addition of Prp22. Both of these rearrangements represent proofreading mechanisms by which suboptimal substrates can be rejected. Reproduced with permission from Ref Copyright 2016 Elsevier Inc. (e) Left: U2AF65 exists largely in a high-FRET “closed” conformation in the absence of RNA (gray), and transitions to a mid-FRET “open” state upon binding to RNAs with strong Py-tracts (red). Weak Py-tracts cause an intermediate shift (blue). Middle: Addition of U2AF35 enables U2AF65 to adopt the open state even in the presence of weak Py-tracts. Reproduced with permission from Ref .
Figure 13
Figure 13. Protein and RNA dynamics during mRNA translation
(a) The elongation cycle of the bacterial ribosome. (b) Study of ribosome translocation by monitoring FRET between multiple tRNAs and between tRNAs and the ribosome. In the absence of EF-G, the ribosome fluctuates between conformations in which the tRNAs are in classical (high-FRET) and hybrid (mid-FRET) states. Addition of EF-G (at the time marked “G” in the traces) suppresses these fluctuations, and leads to a rapid transition to a low-FRET post-translocation state. Panel (a) and (b) are reproduced with permission from Ref Copyright 2011 Elsevier Inc. (c) Study of rotational motions in EF-G by polarization-resolved single-molecule microscopy. Left: rapid increases in overall fluorescence intensity indicate EF-G binding events, while changes in the relative intensities of 16 polarization-resolved signals indicate rotations of the labeled domain of EF-G. Right: Histograms binning the angles of rotations observed during EF-G binding events. Two different fluorophore positions (residues 429–436 and 467–474 of domain III) indicate that domain III exhibits large re-orientations. These re-orientations are suppressed in the presence of Viomycin. Reproduced with permission from Ref . (d) Translational bypassing on T4 gene 60 mRNA. Translating ribosomes fluctuate between rotated and non-rotated states. Upon reaching the “take-off” codon, ribosomes that bypass exhibit a long-lived rotated state. Reproduced with permission from Ref Copyright 2015 Elsevier Inc.

References

    1. Kruger K, Grabowski PJ, Zaug AJ, Sands J, Gottschling DE, Cech TR. Self-Splicing Rna: Autoexcision and Autocyclization of the Ribosomal Rna Intervening Sequence of Tetrahymena. Cell. 1982;31:147–157. - PubMed
    1. Guerrier-Takada C, Gardiner K, Marsh T, Pace N, Altman S. The Rna Moiety of Ribonuclease P Is the Catalytic Subunit of the Enzyme. Cell. 1983;35:849–857. - PubMed
    1. Moerner WE, Kador L. Optical Detection and Spectroscopy of Single Molecules in a Solid. Phys Rev Lett. 1989;62:2535–2538. - PubMed
    1. Birney E, Stamatoyannopoulos JA, Dutta A, Guigo R, Gingeras TR, Margulies EH, Weng ZP, Snyder M, Dermitzakis ET, Stamatoyannopoulos JA, et al. Identification and Analysis of Functional Elements in 1% of the Human Genome by the Encode Pilot Project. Nature. 2007;447:799–816. - PMC - PubMed
    1. Carninci P, Kasukawa T, Katayama S, Gough J, Frith MC, Maeda N, Oyama R, Ravasi T, Lenhard B, Wells C, et al. The Transcriptional Landscape of the Mammalian Genome. Science. 2005;309:1559–1563. - PubMed

Publication types

LinkOut - more resources