

Sidt2 regulates hepatocellular lipid metabolism through autophagy
- PMID: 29363559
- PMCID: PMC5832936
- DOI: 10.1194/jlr.M073817
Sidt2 regulates hepatocellular lipid metabolism through autophagy
Abstract
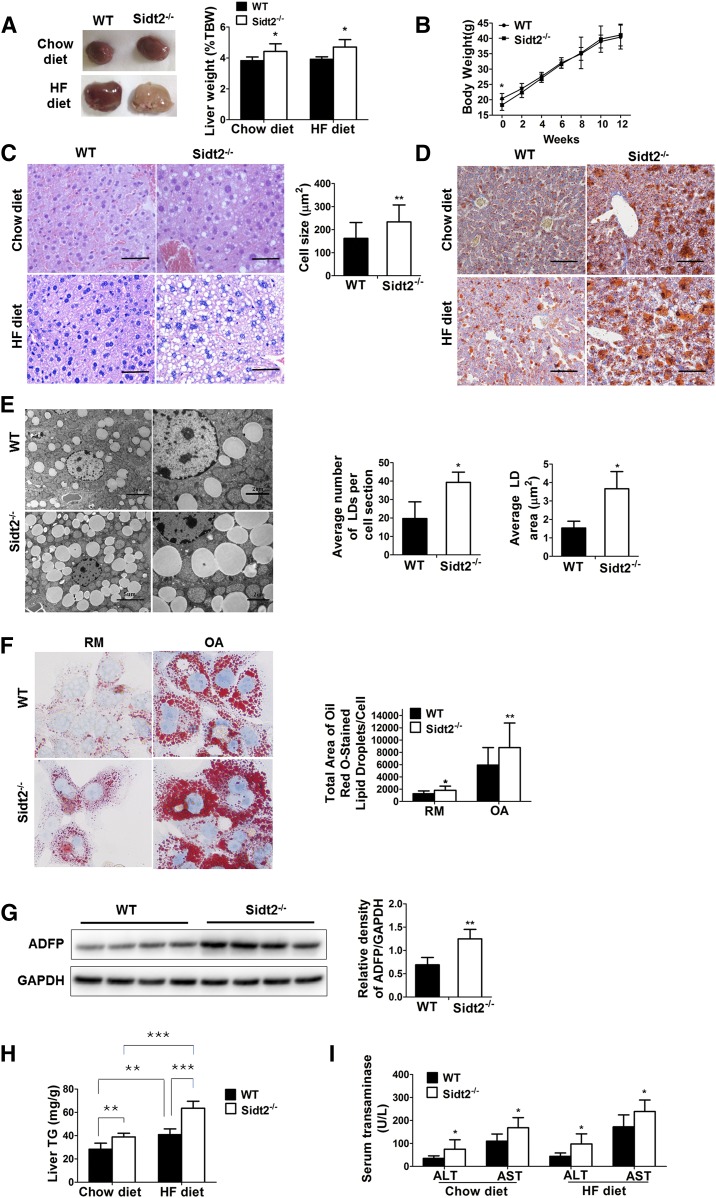
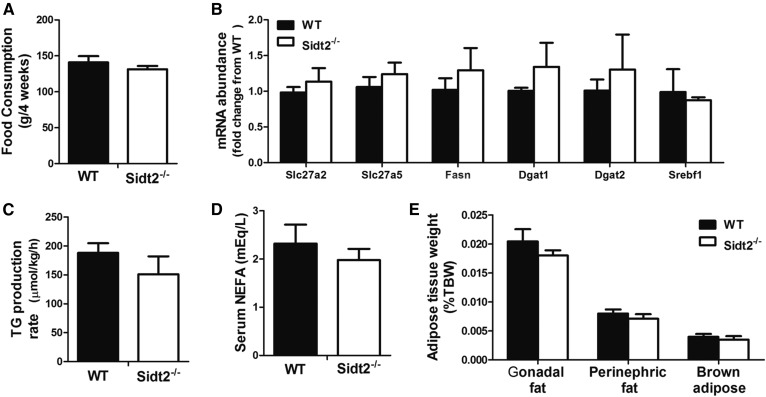
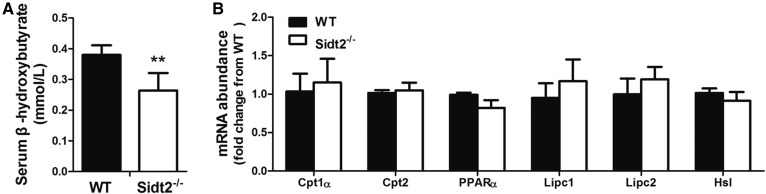
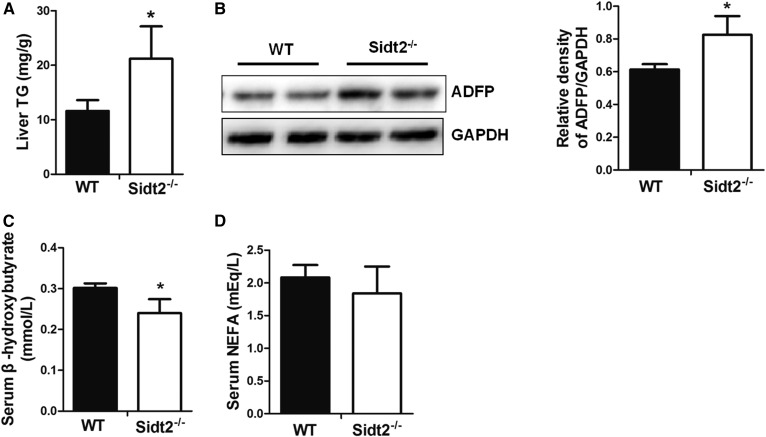
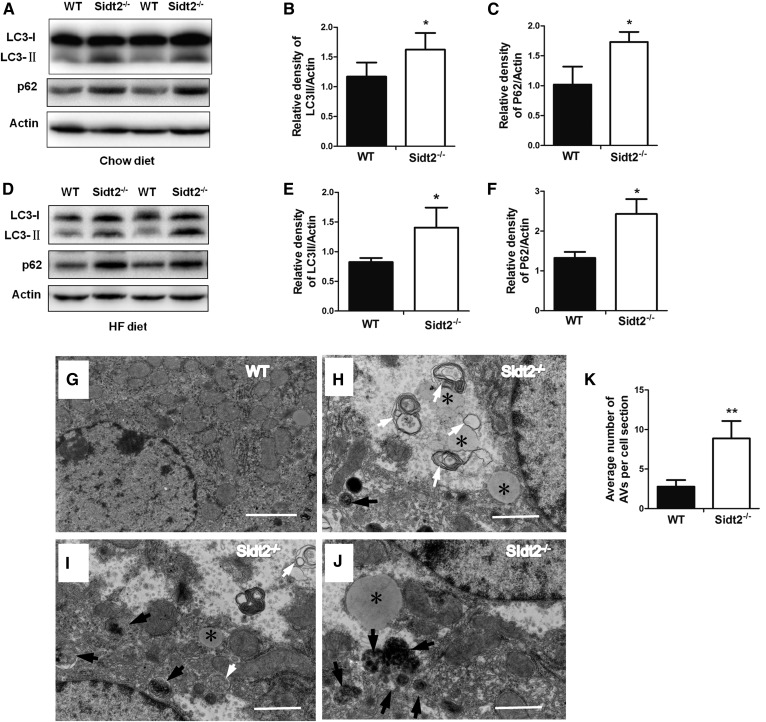
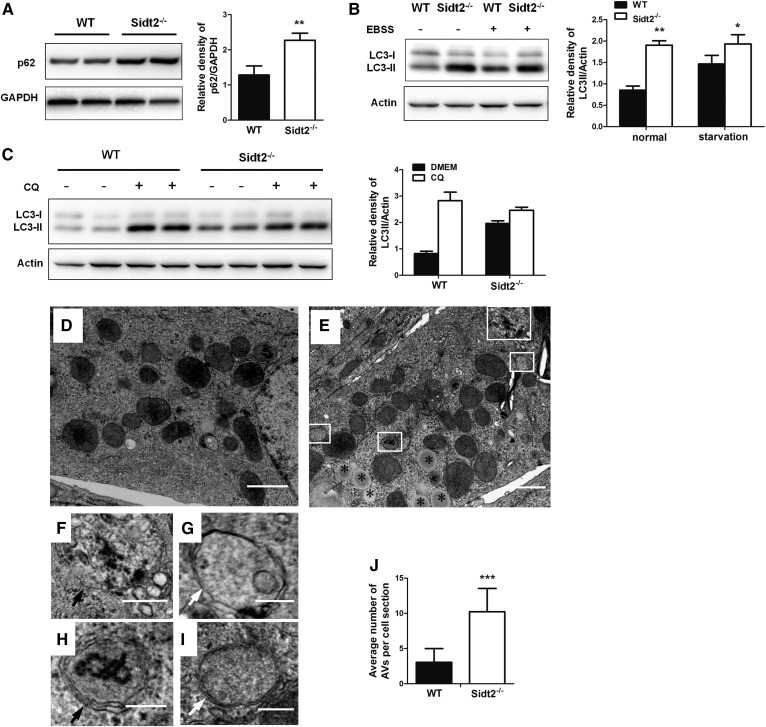
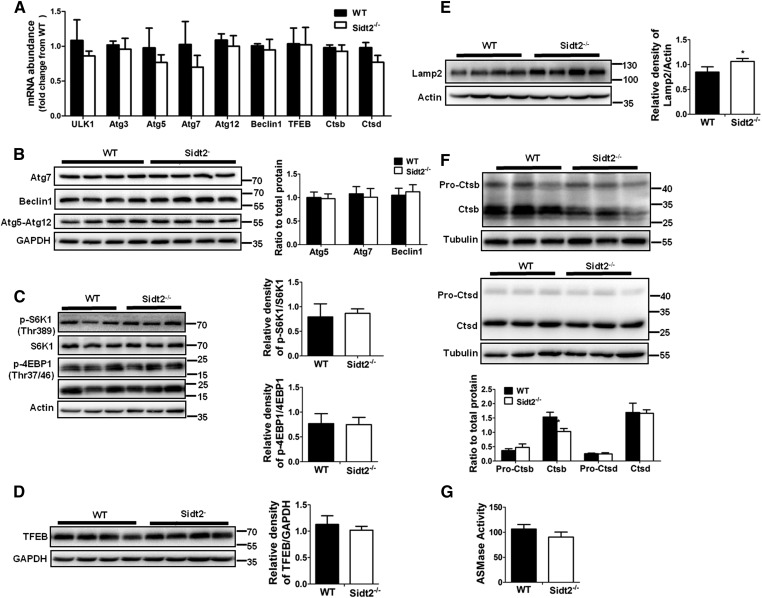
SID1 transmembrane family member 2 (Sidt2) is an integral lysosomal membrane protein. To investigate its explicit function, we generated a global Sidt2 knockout mouse model (Sidt2-/-). Compared with the littermate controls, Sidt2-/- mice exhibited a remarkable accumulation of lipid droplets in liver. First, it was observed that food consumption, hepatocyte fatty acid uptake and de novo lipogenesis, hepatocyte lipolysis, and TG secretion in the form of very low density lipoprotein were comparable between Sidt2-/- and WT mice. However, the hepatic β-oxidation of fatty acids decreased significantly as revealed by a low level of serum β-hydroxybutyrate in the Sidt2-/- mice along with normal mRNA expression of genes involved in fatty acid oxidation. In addition, the classical autophagy pathway marker proteins, p62 and LC3-II, increased in liver, along with compromised autophagic flux in primary hepatocytes, indicating a block of autophagosome maturation due to Sidt2 deficiency, which was also supported by electron microscopy image analysis both in livers and in primary hepatocytes from Sidt2-/- mice. It was concluded that Sidt2 plays an important role in mouse hepatic lipid homeostasis by regulating autophagy at the terminal stage.
Keywords: SID1 transmembrane family member 2; lipid droplets; liver metabolism; triglycerides.
Copyright © 2018 by the American Society for Biochemistry and Molecular Biology, Inc.
Figures
Similar articles
-
Spontaneous nonalcoholic fatty liver disease and ER stress in Sidt2 deficiency mice.Biochem Biophys Res Commun. 2016 Aug 5;476(4):326-332. doi: 10.1016/j.bbrc.2016.05.122. Epub 2016 May 24. Biochem Biophys Res Commun. 2016. PMID: 27233614
-
Changes of lysosomal membrane permeabilization and lipid metabolism in sidt2 deficient mice.Exp Ther Med. 2018 Jul;16(1):246-252. doi: 10.3892/etm.2018.6187. Epub 2018 May 18. Exp Ther Med. 2018. PMID: 29896245 Free PMC article.
-
Skeletal muscle-specific Sidt2 knockout in mice induced muscular dystrophy-like phenotype.Metabolism. 2018 Aug;85:259-270. doi: 10.1016/j.metabol.2018.05.004. Epub 2018 May 9. Metabolism. 2018. PMID: 29752955
-
The functions of SID1 transmembrane family, member 2 (Sidt2).FEBS J. 2023 Oct;290(19):4626-4637. doi: 10.1111/febs.16641. Epub 2022 Oct 14. FEBS J. 2023. PMID: 36176242 Review.
-
Lipophagy and liver disease: New perspectives to better understanding and therapy.Biomed Pharmacother. 2018 Jan;97:339-348. doi: 10.1016/j.biopha.2017.07.168. Epub 2017 Nov 6. Biomed Pharmacother. 2018. PMID: 29091883 Review.
Cited by
-
SIDT2 RNA Transporter Promotes Lung and Gastrointestinal Tumor Development.iScience. 2019 Oct 25;20:14-24. doi: 10.1016/j.isci.2019.09.009. Epub 2019 Sep 10. iScience. 2019. PMID: 31546103 Free PMC article.
-
SIDT2 Associates with Apolipoprotein A1 (ApoA1) and Facilitates ApoA1 Secretion in Hepatocytes.Cells. 2023 Sep 26;12(19):2353. doi: 10.3390/cells12192353. Cells. 2023. PMID: 37830567 Free PMC article.
-
Role of glycoproteins in hepatic lipid metabolism: emerging diagnostic markers and therapeutic targets.PeerJ. 2025 Jul 4;13:e19627. doi: 10.7717/peerj.19627. eCollection 2025. PeerJ. 2025. PMID: 40625923 Free PMC article. Review.
-
Structure of the human systemic RNAi defective transmembrane protein 1 (hSIDT1) reveals the conformational flexibility of its lipid binding domain.bioRxiv [Preprint]. 2024 Jun 12:2023.12.21.572875. doi: 10.1101/2023.12.21.572875. bioRxiv. 2024. Update in: Life Sci Alliance. 2024 Jun 26;7(9):e202402624. doi: 10.26508/lsa.202402624. PMID: 38187772 Free PMC article. Updated. Preprint.
-
Cryo-EM structures of human SID-1 transmembrane family proteins and implications for their low-pH-dependent RNA transport activity.Cell Res. 2024 Jan;34(1):80-83. doi: 10.1038/s41422-023-00893-1. Epub 2023 Nov 6. Cell Res. 2024. PMID: 37932445 Free PMC article. No abstract available.
References
-
- Saftig P., and Klumperman J.. 2009. Lysosome biogenesis and lysosomal membrane proteins: trafficking meets function. Nat. Rev. Mol. Cell Biol. 10: 623–635. - PubMed
-
- Conus S., and Simon H. U.. 2008. Cathepsins: key modulators of cell death and inflammatory responses. Biochem. Pharmacol. 76: 1374–1382. - PubMed
-
- Coxon F. P., and Taylor A.. 2008. Vesicular trafficking in osteoclasts. Semin. Cell Dev. Biol. 19: 424–433. - PubMed
-
- Boustany R. M. 2013. Lysosomal storage diseases–the horizon expands. Nat. Rev. Neurol. 9: 583–598. - PubMed
Publication types
MeSH terms
Substances
LinkOut - more resources
Full Text Sources
Other Literature Sources
Molecular Biology Databases
Miscellaneous
