

Large-scale image-based profiling of single-cell phenotypes in arrayed CRISPR-Cas9 gene perturbation screens
- PMID: 29363560
- PMCID: PMC5787707
- DOI: 10.15252/msb.20178064
Large-scale image-based profiling of single-cell phenotypes in arrayed CRISPR-Cas9 gene perturbation screens
Abstract
High-content imaging using automated microscopy and computer vision allows multivariate profiling of single-cell phenotypes. Here, we present methods for the application of the CISPR-Cas9 system in large-scale, image-based, gene perturbation experiments. We show that CRISPR-Cas9-mediated gene perturbation can be achieved in human tissue culture cells in a timeframe that is compatible with image-based phenotyping. We developed a pipeline to construct a large-scale arrayed library of 2,281 sequence-verified CRISPR-Cas9 targeting plasmids and profiled this library for genes affecting cellular morphology and the subcellular localization of components of the nuclear pore complex (NPC). We conceived a machine-learning method that harnesses genetic heterogeneity to score gene perturbations and identify phenotypically perturbed cells for in-depth characterization of gene perturbation effects. This approach enables genome-scale image-based multivariate gene perturbation profiling using CRISPR-Cas9.
Keywords: CRISPR‐Cas9; arrayed library; functional genomics; nuclear pore complex; single‐cell phenotypic profiling.
© 2018 The Authors. Published under the terms of the CC BY 4.0 license.
Figures

Schematic overview of CRISPR‐Cas9‐mediated gene perturbation by transient transfection of a targeting plasmid. tdTomato expression (magenta) marks transfected cells. Single‐cell measurements are obtained by quantitative immunofluorescence (green) combined with computer vision and automated cell segmentation, see text for details.
tdTomato (magenta) and TFRC (green) expression in HeLa cells transfected with a control plasmid, or a TFRC targeting plasmid. Scale bar, 50 μm.
Quantification of normalized TFRC staining per cell, 1–4 days after transfection of a TFRC targeting plasmid. Violin plots of normalized TFRC staining intensity in all analysed cells (grey) or tdTomato expressing (T(+), magenta) cells.
Quantification of the efficacy of genetic perturbation by TFRC, LAMP1 and YAP1 targeting plasmids; bars indicate the percentage of genetically perturbed T(+) cells. The mean ± standard deviation of three independent experiments is displayed.
Evaluation of genetic perturbations in single cells using bDNA FISH. Schematic representation of the expected phenotype in wild‐type and functionally genetically perturbed cells.
bDNA FISH staining of TFRC mRNA in HeLa cells transfected with a control plasmid, or a TFRC targeting plasmid. Cell outlines are indicated and colour‐coded white for T(−) cells, magenta for T(+) cells. Scale bar, 50 μm.
Quantification TFRC mRNA spots in cells transfected with a control plasmid, or a TFRC targeting plasmid. Violin plots of TFRC mRNA spot counts per T(+) cell.
Heatmap representation of the efficacy of targeting plasmids designed to perturb 26 selected genes as assayed by smFISH.
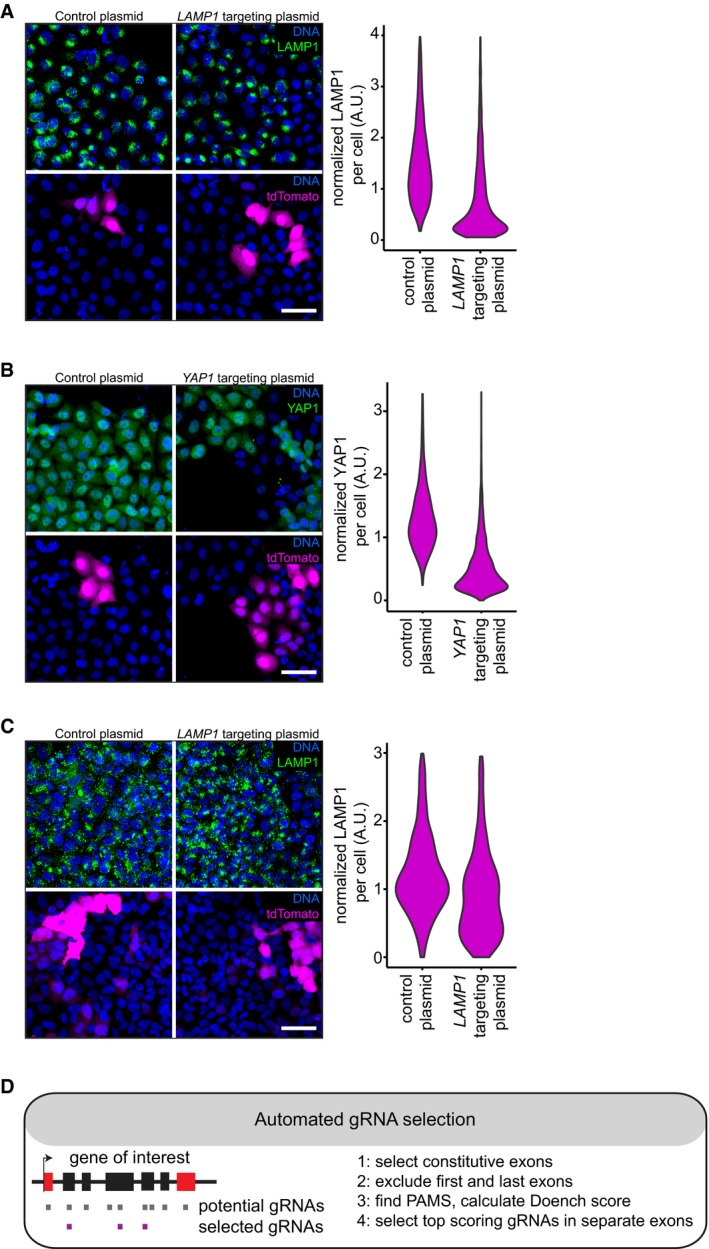
Immunofluorescence staining of LAMP1 in HeLa cells transfected with a control plasmid, or a LAMP1 targeting plasmid. Scale bar, 50 μm. Violin plots of normalized mean LAMP1 staining intensity in tdTomato expressing (T(+)) cells 4 days post‐transfection.
Immunofluorescence staining of YAP1 in HeLa cells transfected with a control plasmid, or a YAP1 targeting plasmid. Scale bar, 50 μm. Violin plots of normalized mean YAP1 staining intensity in tdTomato expressing (T(+)) cells 4 days post‐transfection.
Immunofluorescence staining of LAMP1 in U2OS cells transfected with a control plasmid, or a LAMP1 targeting plasmid. Scale bar, 50 μm. Violin plots of normalized mean TFRC staining intensity in tdTomato expressing (T(+)) cells 4 days post‐transfection.
Rational selection of highly functional gRNA sequences, see main text and material and methods for details.
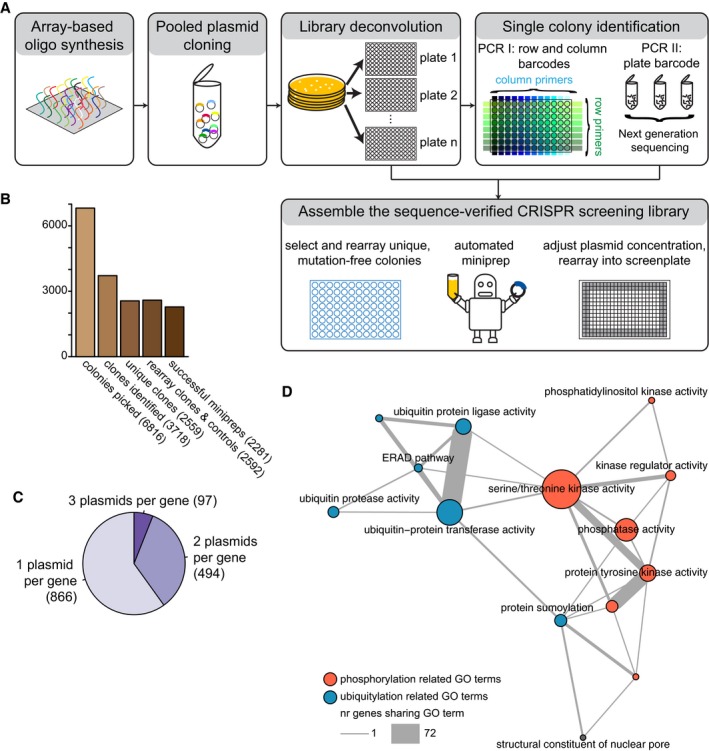
Schematic representation of the workflow for the construction of an arrayed CRISPR‐Cas9 screening library. A pool of oligos is synthesized and cloned into the vector backbone in a single reaction. Single colonies are picked into multi‐well plates. The gRNA sequence of every colony is PCR amplified with primers that introduce barcodes to identify the row, column and plate of the well where the colony is located. The sequence of the PCR products is analysed in a deep sequencing reaction. Unique, mutation‐free colonies are selected, re‐arrayed and miniprepped to generate an arrayed CRISPR‐Cas9 screening library.
Representation of the number of picked colonies, the number of mutation‐free identified gRNAs, the number of unique mutation‐free gRNAs, the number of re‐arrayed colonies and the number of constructs in the arrayed CRISPR‐Cas9 screening library.
Pie chart representing the number of genes targeted by 1, 2 or 3 targeting plasmids.
Network representation of the arrayed CRISPR‐Cas9 screening library. Nodes represent selected Gene Ontology annotations of targeted genes, node size represents the number of genes with the functional annotation, edges indicate genes sharing functional annotations. Edge thickness scales with number of genes that share functional annotations. Nodes are colour coded for phosphorylation‐related functional annotations (red) or ubiquitylation‐related functional annotations (blue).
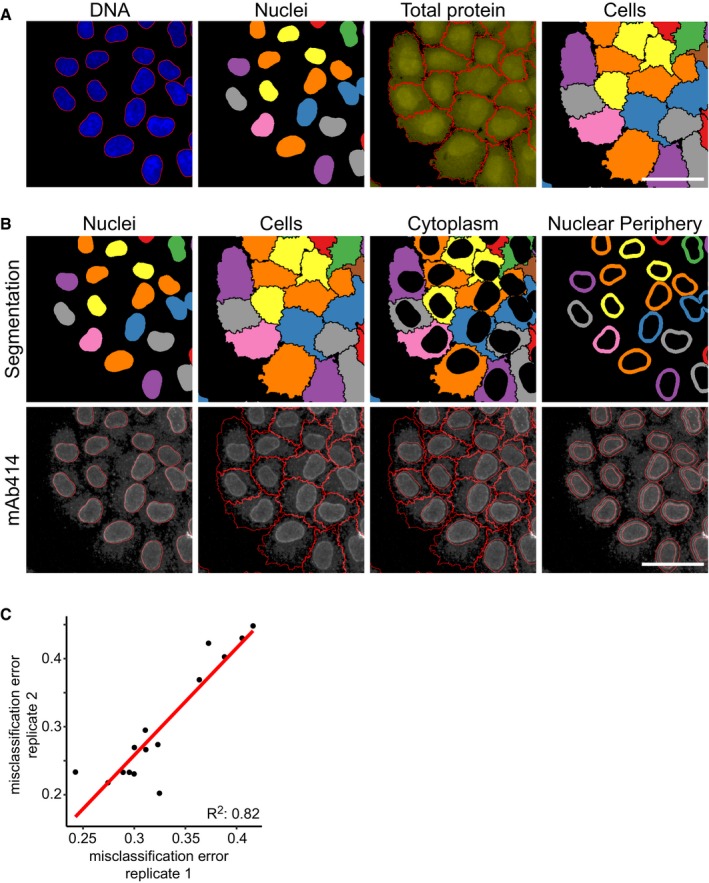
Nucleus and cell segmentation based on image processing and computer vision of cells stained for DNA and total protein. Scale bar, 50 μm.
Nucleus, cell, cytoplasm and nuclear periphery segmentation and mAb414 staining for the large‐scale CRISPR‐Cas9 gene perturbation profiling experiment of the mAb414 staining pattern. Scale bar, 50 μm.
Scatterplot of misclassification errors of classifiers trained on cells transfected with plasmids targeting HSPA5, NPC components and non‐targeting controls from two independent experiments.

- A
Schematic representation of the profiling of CRISPR‐Cas9 gene perturbation phenotypes. Transient transfection of a targeting plasmid results in a mixed population of wild‐type and genetically perturbed cells. Technical well‐to‐well variability can be accounted for by standardizing single‐cell features to the wild‐type cell population in every well. Logistic regression classifiers are fitted to the cell population to attempt to distinguish between T(+) and T(−) cells based on a set of single‐cell features.
- B, C
The predicted value (PV) is calculated for every cell in a well that was transiently transfected with a control targeting plasmid, or a NUP160 targeting plasmid. A positive PV indicates classification into the phenotypically perturbed class. The dotted line indicates the threshold for further single‐cell characterization [PV > 0.62 (mean + 3 × standard deviation of non‐targeting control cells)].
- D
Immunofluorescence image of mAb414 staining in HeLa cells transfected with a NUP160 targeting plasmid. Cell outlines are coloured orange for T(+) cells that show a gene perturbation phenotype (PV > 0.62), red for T(+) cells with a PV < 0.62, blue for T(−) cells. Missegmented cells are outlined grey. Scale bar, 50 μm.
- E, F
tSNE projection of cells transfected with a NUP160 targeting plasmid. Single cells are colour coded according to tdTomato expression (E) and PV (F).

Image‐based profiling of the arrayed CRISPR‐Cas9 library for perturbations affecting cellular morphology and total protein staining features. The classification score is a linear transformation of the misclassification error of logistic regression models trained to classify T(+) and T(−) cells. Perturbations targeting proteasome subunits or structural components of the NPC are colour‐coded purple and green. Non‐targeting control perturbations are colour‐coded brown. The dotted line indicates the threshold used to select perturbations that have a higher classification score than non‐targeting controls (third quartile + 1.5 × interquartile range of the classification scores of non‐targeting controls). The size of the perturbation nodes is scaled according to the phenotypic score, which reflects the KS statistic calculated between the PV distributions of non‐targeting control plasmid transfected cells and the transfected cells of the respective perturbation (see Materials and Methods).
Image‐based profiling of mAb414 staining pattern. Colour coding and threshold calculation as in (A).
Hierarchical clustering of the standardized mean feature profiles of control cells or phenotypically perturbed cells transfected with plasmids targeting HSPA5 or selected structural components of the NPC.
Immunofluorescence images and schematic representation of the mAb414 staining pattern in control cells or phenotypically perturbed cells from the NUP62, HSPA5, NUP133, NUP107, NUP160 or NUP98 targeted populations. Scale bar, 10 μm.

Network representation of selected GO terms associated with perturbations identified in the profiling of cell morphology and total protein staining features. Edges between nodes are formed if GO terms share genes. Node size represents enrichment of GO terms relative to the screening library, and the P‐value is calculated using a hypergeometric test.
Network representation of GO terms associated with perturbations identified in the profiling of the mAb414 staining pattern. Node size represents enrichment of GO terms relative to the screening library, and P‐values are calculated using a hypergeometric test.
Hierarchical clustering of the mean feature values of phenotypically perturbed cells from populations of cells transfected with plasmids targeting proteasome subunits and mean feature profiles of cells transfected with non‐targeting control plasmids. The mean feature profiles were calculated based on all features used in the cell morphology profiling.

- A, C
The mean mAb414 feature profiles (A) or cell morphology features (C) were calculated for T(+) and T(−) cells per well. For each profile, the Mahalanobis distance from the distribution of all profiles was calculated. Nodes represent feature profiles, colour‐coded magenta and grey for profiles obtained from T(+) and T(−) cells, respectively. The dotted line indicates the threshold used to select perturbations have a large distance to non‐targeting controls (third quartile + 3 × interquartile range of the distance of non‐targeting controls). Nodes are scaled according to the classification score which is based on the within‐well comparison of T(+) and T(−) cells.
- B, D
The Mahalanobis distance of T(+) profiles from the total distribution of mean feature profiles was plotted against the classification score (as obtained from within‐well comparison of T(+) and T(−) cells) for the profiling of the mAb414 features (B) and cell morphology features (D).

Boxplots of the standardized single‐cell feature values of all transfected cells and phenotypically perturbed cells transfected with plasmids targeting NUP62, HSPA5, NUP107 or NUP98, bar graph representation of the percentage of T(+) cells with a PV > 0.62. Boxes indicate the 1st and 3rd quartile of the data distribution. The whiskers indicate the maximum and minimum datapoints within the 1st quartile minus 1.5 times the interquartile range (IQR) of the data and the third quartile plus 1.5 times the IQR.
Schematic representation of the NPC, adapted from Weberruss and Antonin (Weberruss & Antonin, 2016).
Cells were transfected with three independent plasmids targeting each of the genes NUP62, HSPA5, NUP107 or NUP98. Mean feature profiles were obtained from all transfected cells, or the subset of T(+) cells with a high PV. The Pearson correlation coefficient between pairs of profiles obtained from populations targeted for the same gene with different plasmids was calculated. The correlations between profiles obtained from all transfected cells, or the subset of T(+) cells with a high PV are compared.
Boxplots of Pearson's correlation coefficients calculated between mean feature profiles of phenotypically perturbed cells transfected with plasmids targeting the same gene, or different genes. Phenotypic profiles were obtained from cells transfected with plasmids targeting selected subunits of the NPC and HSPA5 (green) or the top‐scoring genes that were identified in the large‐scale profiling of the mAb414 staining features for which multiple targeting plasmids were present in the library (grey). Boxes indicate the 1st and 3rd quartile of the data distribution. The whiskers indicate the maximum and minimum datapoints within the 1st quartile minus 1.5 times the interquartile range (IQR) of the data and the third quartile plus 1.5 times the IQR.
Similar articles
-
Development of drug-inducible CRISPR-Cas9 systems for large-scale functional screening.BMC Genomics. 2019 Mar 19;20(1):225. doi: 10.1186/s12864-019-5601-9. BMC Genomics. 2019. PMID: 30890156 Free PMC article.
-
Genome-scale CRISPR-Cas9 knockout and transcriptional activation screening.Nat Protoc. 2017 Apr;12(4):828-863. doi: 10.1038/nprot.2017.016. Epub 2017 Mar 23. Nat Protoc. 2017. PMID: 28333914 Free PMC article.
-
Large-Scale Single Guide RNA Library Construction and Use for CRISPR-Cas9-Based Genetic Screens.Cold Spring Harb Protoc. 2016 Mar 1;2016(3):pdb.top086892. doi: 10.1101/pdb.top086892. Cold Spring Harb Protoc. 2016. PMID: 26933254 Free PMC article.
-
[Application of machine learning in the CRISPR/Cas9 system].Yi Chuan. 2018 Sep 20;40(9):704-723. doi: 10.16288/j.yczz.18-135. Yi Chuan. 2018. PMID: 30369475 Review. Chinese.
-
CRISPR/Cas9-mediated genome editing in sea urchins.Methods Cell Biol. 2019;151:305-321. doi: 10.1016/bs.mcb.2018.10.004. Epub 2018 Nov 29. Methods Cell Biol. 2019. PMID: 30948015 Free PMC article. Review.
Cited by
-
Subcellular proteomics.Nat Rev Methods Primers. 2021;1:32. doi: 10.1038/s43586-021-00029-y. Epub 2021 Apr 29. Nat Rev Methods Primers. 2021. PMID: 34549195 Free PMC article.
-
Transitive prediction of small-molecule function through alignment of high-content screening resources.Nat Biotechnol. 2025 Jul 11. doi: 10.1038/s41587-025-02729-2. Online ahead of print. Nat Biotechnol. 2025. PMID: 40646169
-
Blank spots on the map: some current questions on nuclear organization and genome architecture.Histochem Cell Biol. 2018 Dec;150(6):579-592. doi: 10.1007/s00418-018-1726-1. Epub 2018 Sep 20. Histochem Cell Biol. 2018. PMID: 30238154 Free PMC article. Review.
-
Rapid identification of human mast cell degranulation regulators using functional genomics coupled to high-resolution confocal microscopy.Nat Protoc. 2020 Mar;15(3):1285-1310. doi: 10.1038/s41596-019-0288-6. Epub 2020 Feb 14. Nat Protoc. 2020. PMID: 32060492 Free PMC article.
-
A statistical simulation model to guide the choices of analytical methods in arrayed CRISPR screen experiments.PLoS One. 2024 Aug 20;19(8):e0307445. doi: 10.1371/journal.pone.0307445. eCollection 2024. PLoS One. 2024. PMID: 39163294 Free PMC article.
References
-
- Adamson B, Norman TM, Jost M, Cho MY, Nuñez JK, Chen Y, Villalta JE, Gilbert LA, Horlbeck MA, Hein MY, Pak RA, Gray AN, Gross CA, Dixit A, Parnas O, Regev A, Weissman JS (2016) A multiplexed single‐cell CRISPR screening platform enables systematic dissection of the unfolded protein response. Cell 167: 1867–1882 - PMC - PubMed
-
- Battich N, Stoeger T, Pelkmans L (2013) Image‐based transcriptomics in thousands of single human cells at single‐molecule resolution. Nat Methods 10: 1127–1133 - PubMed
-
- Boutros M, Ahringer J (2008) The art and design of genetic screens: RNA interference. Nat Rev Genet 9: 554–566 - PubMed
-
- Boutros M, Heigwer F, Laufer C (2015) Microscopy‐based high‐content screening. Cell 163: 1314–1325 - PubMed
-
- Caicedo JC, Singh S, Carpenter AE (2016) Applications in image‐based profiling of perturbations. Curr Opin Biotechnol 39: 134–142 - PubMed
Publication types
MeSH terms
LinkOut - more resources
Full Text Sources
Other Literature Sources
Research Materials
