. 2018 Feb 21;38(8):1973-1988.
doi: 10.1523/JNEUROSCI.2341-17.2018. Epub 2018 Jan 23.

Deficient Surveillance and Phagocytic Activity of Myeloid Cells Within Demyelinated Lesions in Aging Mice Visualized by Ex Vivo Live Multiphoton Imaging

Affiliations

Deficient Surveillance and Phagocytic Activity of Myeloid Cells Within Demyelinated Lesions in Aging Mice Visualized by Ex Vivo Live Multiphoton Imaging

Khalil S Rawji et al. J Neurosci. .

Abstract

Aging impairs regenerative processes including remyelination, the synthesis of a new myelin sheath. Microglia and other infiltrating myeloid cells such as macrophages are essential for remyelination through mechanisms that include the clearance of inhibitory molecules within the lesion. Prior studies have shown that the quantity of myeloid cells and the clearance of inhibitory myelin debris are deficient in aging, contributing to the decline in remyelination efficiency with senescence. It is unknown, however, whether the impaired clearance of debris is simply the result of the reduced number of phagocytes or if the dynamic activity of myeloid cells within the demyelinating plaque also declines with aging and this question is relevant to the proper design of therapeutics to mobilize myeloid cells for repair. Herein, we describe a high-resolution multiphoton ex vivo live imaging protocol that visualizes individual myelinated/demyelinated axons and lipid-containing myeloid cells to investigate the demyelinated lesion of aging female mice. We found that aging lesions have fewer myeloid cells and that these have reduced phagocytosis of myelin. Although the myeloid cells are actively migratory within the lesion of young mice and have protrusions that seem to survey the environment, this motility and surveillance is significantly reduced in aging mice. Our results emphasize the necessity of not only increasing the number of phagocytes, but also enhancing their activity once they are within demyelinated lesions. The high-resolution live imaging of demyelinated lesions can serve as a platform with which to discover pharmacological agents that rejuvenate intralesional remodeling that promotes the repair of plaques.SIGNIFICANCE STATEMENT The repair of myelin after injury depends on myeloid cells that clear debris and release growth factors. As organisms age, remyelination becomes less efficient correspondent with fewer myeloid cells that populate the lesions. It is unknown whether the dynamic activity of cells within lesions is also altered with age. Herein, using high-resolution multiphoton ex vivo live imaging with several novel features, we report that myeloid cells within demyelinated lesions of aging mice have reduced motility, surveillance, and phagocytic activity, suggesting an intralesional impairment that may contribute to the age-related decline in remyelination efficiency. Medications to stimulate deficient aging myeloid cells should not only increase their representation, but also enter into lesions to stimulate their activity.

Keywords: demyelination; live imaging; macrophages; microglia.


Figures

Figure 1.
Figure 1.
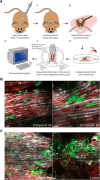
Ex vivo multiphoton live imaging of a demyelinated dorsal column in Cx3cr1GFP/+:Thy1YFP+ mice. A, Schematic of ex vivo live imaging protocol depicting injection of lysolecithin into the dorsal spinal cord with a pulled microcapillary, followed by excision of the spinal cord at 3 d after demyelination, incubation with Nile red, suspension and immersion of spinal cord in aCSF perfusion system, imaging under multiphoton microscope, and post-acquisition analysis. B, Representative spectrally unmixed images acquired from Cx3cr1GFP/+:Thy1YFP+ uninjured mice incubated with Nile red. Cx3cr1GFP/+ microglia (green) are distributed throughout the spinal cord. Thy1YFP+ dorsal column axons are pseudocolored in white and run longitudinally and in parallel. Myelin is in red and appears as intact myelin sheaths surrounding Thy1YFP+ axons. The health and viability of the spinal cord preparation can be sustained for 3 h, as evidenced by the lack of axonal spheroids or other dystrophic features. C, Representative spectrally unmixed images contrasting an uninjured dorsal column with a lesioned dorsal column 3 d after demyelination. In the latter, axons are disrupted or transected and myelin is no longer present as continuous structures around axons. Scale bars, 10 μm.
Figure 2.
Figure 2.
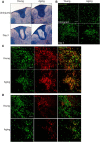
Cx3cr1GFP/+ cells are Iba1-positive macrophages/microglia and CD11c-positive dendritic cells. A, Representative spinal cord cross-sections from young and aging mice stained with eriochrome cyanine (blue) and neutral red (red) to detect myelin and nuclei, respectively. Shown are uninjured dorsal columns and lesioned dorsal columns 3 d after demyelination. B, Representative spinal cord cross-sections of uninjured dorsal columns from young and aging mice display evenly distributed ramified Cx3cr1GFP/+ microglia (green). Also shown are lesioned dorsal columns from young and aging mice 3 d after demyelination. These lesions display accumulation of Cx3cr1GFP/+ cells. C, Representative images of demyelinated lesions from young and aging mice stained with the macrophage/microglia marker Iba1 (red). Most Cx3cr1GFP/+ cells (green) are also Iba1-positive (orange). D, Representative images of demyelinated lesions from young and aging mice stained with CD11c (red). The majority of Cx3cr1GFP/+ cells (green) display a low or negligible level of CD11c (orange). Also present are CD11c-positive, GFP-negative cells (red). Scale bars, 100 μm.
Figure 3.
Figure 3.
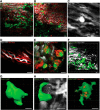
Ex vivo multiphoton live imaging facilitates high-resolution acquisition of many features in the lesion microenvironment. A, Spectrally unmixed image depicting a demyelinated dorsal column lesion with infiltration of activated Cx3cr1GFP/+ microglia and other myeloid cells (green). Nile red-positive myelin debris (red) is present within the lesion. Thy1YFP+ axons (white) appear with axonal endbulbs. Normal appearing white matter is visible in the top portion of the image with intact Thy1YFP+ axons surrounded by normal appearing Nile red-positive myelin sheaths. B, Spectrally unmixed image of a region caudal to the lesion site depicting Wallerian degeneration. This site has many Thy1YFP+ axonal endbulbs (white) and Cx3cr1GFP/+ cells (green). C, Denuded Thy1YFP+ axons with a prominent axonal endbulb on one axon. D, Spectrally unmixed image of a dystrophic Thy1YFP+ axon (white) with its respective Nile red-positive myelin sheath (red). E, Spectrally unmixed image of phagocytic Cx3cr1GFP/+ cells (green) containing Nile red-positive phagosomes (red) within the cytoplasm. Thy1YFP+ axonal fragments (white) are also evident in this image. F, 3D reconstruction of a demyelinated dorsal column lesion with infiltrating activated Cx3cr1GFP/+ cells (green) and Thy1YFP+ axons (white). G, Single amoeboid Cx3cr1GFP/+ cell that has been 3D reconstructed. H, Example of a 3D-reconstructed Cx3cr1GFP/+ cell in the process of engulfing a Thy1YFP+ axonal endbulb. I, 3D reconstruction of a single phagocytic Cx3cr1GFP/+ cell containing numerous Nile red-positive phagosomes (red) within its cytoplasm. Scale bars, 10 μm.
Figure 4.
Figure 4.
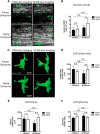
Live imaging of unlesioned young and aging dorsal columns does not alter microglia cell number of morphology over 90 min of imaging. A, Representative 3D-reconstructed still frames of time-lapse videos of uninjured dorsal columns from young and aging mice. The first time point (0 Minutes Imaging) and the final time point (90 Minutes Imaging) are displayed. Cx3cr1GFP/+ microglia are depicted in green and Thy1YFP+ axons are shown in white. B, There is no change in the number of Cx3cr1GFP/+ microglia over 90 min of live imaging (interaction, F(1,8) = 0.2456, p = 0.6335; time, F(1,8) = 1.447, p = 0.2634; age, F(1,8) = 0.6102, p = 0.4572). C, Representative 3D reconstructions of a single Cx3cr1GFP/+ microglial cell (green) from uninjured dorsal columns from young and aging mice. The same cell is shown at the first time point (0 Minutes Imaging) and the final time point (90 Minutes Imaging) for both the young and aging condition. D, Graph comparing the surface area of Cx3cr1GFP/+ microglia over the 90 min imaging session in uninjured young and aging dorsal columns (interaction, F(1,62) = 1.154, p = 0.2869; time, F(1,62) = 0.1541, p = 0.6960; age, F(1,62) = 0.139, p = 0.7106). E, Measurements of the cellular volume of Cx3cr1GFP/+ microglia over the 90 min imaging session in uninjured young and aging dorsal columns (interaction, F(1,62) = 1.238, p = 0.2702; time, F(1,62) = 0.1773, p = 0.6751; age, F(1,62) = 0.8302, p = 0.3657). F, Graph depicting the mean sphericity of Cx3cr1GFP/+ microglia over the 90 min imaging session in uninjured young and aging dorsal columns (interaction, F(1,62) = 1.123, p = 0.2934; time, F(1,62) = 0.3178, p = 0.5750; age, F(1,62) = 0.004751, p = 0.9453). Values are represented as mean and SEM. Results were analyzed with a two-way ANOVA with a Bonferroni's multiple-comparisons test. For B, each data point was of individual mice and 3 young mice and 3 aging mice were analyzed. For DF, between 1 and 11 cells were quantified per mouse from 3 young mice and 3 aging mice. n.s., Not significant. Scale bars: A, 20 μm; C, 10 μm.
Figure 5.
Figure 5.
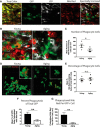
Lesions from aging mice have fewer Nile red-positive Cx3cr1GFP/+ cells that are also less phagocytic. A, Example of spectral unmixing in which a true color image depicting spectral data from 490–650 nm is unmixed into a GFP, YFP, and Nile red channel. B, Representative spectrally unmixed images from lesions in a young mouse (left) and aging mouse (right) 3 d after demyelination. Thy1YFP+ axons are displayed in white, Nile red-labeled myelin is shown in red, and Cx3cr1GFP/+ cells are shown in green. C, Lesions from young mice have significantly more Cx3cr1GFP/+ cells containing Nile red-positive phagosomes than lesions from aging mice (t = 1.988, df = 6, p = 0.0470). D, 3D reconstruction of Cx3cr1GFP/+ cells containing Nile red-positive phagosomes in lesions from young and aging mice 3 d after demyelination. E, There is no difference in the percentage of Cx3cr1GFP/+ cells that contain Nile red-positive phagosomes in lesions from young mice compared with lesions from aging mice (t = 0.3516, df = 6, p = 0.3686). F, At 3 d after demyelination, lesions from aging mice display a significant reduction in the percentage of total GFP signal colocalized with Nile red (t = 2.8, df = 54, p = 0.0035). G, Lesions from aging mice show a significant reduction in the amount of Nile red phagocytosed per Cx3cr1GFP/+ cell (t = 3.215, df = 51, p = 0.0011). Values are represented as mean with the SEM. Results were analyzed with a one-tailed Student's t test. For C and E, each data point represents one mouse. For F and G, the percentage and volume of Nile red colocalized with Cx3cr1GFP/+ cells, respectively, were quantified from several time points in each of 4 young mice and 4 aging mice. *p < 0.05; **p < 0.01; n.s., Not significant. Scale bars, 10 μm.
Figure 6.
Figure 6.
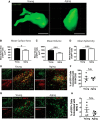
Lesions from aging mice have alterations in Cx3cr1GFP/+ cell morphology. A, Representative 3D reconstructions of a single Cx3cr1GFP/+ cell from a young and an aging mouse 3 d after demyelination. B, Graph comparing the mean surface area of Cx3cr1GFP/+ cells over the entire imaging session in lesions from young and aging mice 3 d after demyelination (t = 2.323, df = 624, p = 0.0103). C, Measurements of the mean cellular volume of Cx3cr1GFP/+ cells over the entire imaging session in lesions from young and aging mice 3 d after demyelination (t = 3.768, df = 624, p < 0.0001). D, Graph depicting the mean sphericity of Cx3cr1GFP/+ cells over the entire imaging session in lesions from young and aging mice 3 d after demyelination (t = 3.382, df = 624, p = 0.0004). E, Representative images of lesions from young and aging mice immunostained with antibodies to Cx3cr1GFP/+ (green) and the activation marker CD16/CD32 (red). Shown are the individual channels and the merged image. F, There is no difference in the percentage of Cx3cr1GFP/+ cells that are colocalized with the activation marker CD16/CD32 (t = 0.1691, df = 7, p = 0.4353). G, Representative images of lesions from young and aging mice immunostained with antibodies to Cx3cr1GFP/+ (green) and the activation marker MHC II (red). Displayed are the individual channels and the merged image. H, Lesions from young mice show an increased trend in the percentage of Cx3cr1GFP/+ cells that are colocalized with MHC II (t = 1.074, df = 7, p = 0.1591). Values are represented as mean with the SEM. Results were analyzed with a one-tailed Student's t test. For BD, between 41 and 145 cells were quantified per mouse from 4 young and 4 aging mice. For F and H, each data point represents one mouse. *p < 0.05; ***p < 0.001; n.s., Not significant. For A, scale bars, 10 μm. For E and G, scale bars, 100 μm.
Figure 7.
Figure 7.
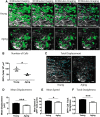
Aging Cx3cr1GFP/+ cells are significantly less motile in the lesion and are fewer in number. A, Representative 3D-reconstructed still frames of time-lapse videos of lesions from young and aging mice 3 d after demyelination. Cx3cr1GFP/+ cells are shown in green and Thy1YFP+ axons are shown in white. Displacement vectors are shown in blue. B, Lesions from young mice contain significantly more Cx3cr1GFP/+ cells than lesions from aging mice 3 d after demyelination (t = 3.584, df = 4, p = 0.0115). C, Representative diagram displaying displacement vectors of individual Cx3cr1GFP/+ cells over imaging session in young and aging lesions 3 d after demyelination. Thy1YFP+ axons are shown in white. D, E, Graphs comparing the mean displacement (t = 3.631, df = 574, p = 0.0002; D) and mean speed (t = 1.778, df = 574, p = 0.0380; E) of individual Cx3cr1GFP/+ cells in lesions from young and aging mice 3 d after demyelination. F, Graph displaying the track straightness (t = 5.052, df = 574, p < 0.0001) of individual Cx3cr1GFP/+ cells in lesions from young and aging mice 3 d after demyelination. Values are shown as mean and SEM. Results were analyzed with a one-tailed Student's t test. For B, each data point represents one mouse. For DF, between 41 and 145 cells were quantified per mouse from 3 young mice and 3 aging mice. *p < 0.05; ***p < 0.001. Scale bars, 10 μm.

References

    1. Arnaud E, Zenker J, de Preux Charles AS, Stendel C, Roos A, Médard JJ, Tricaud N, Kleine H, Luscher B, Weis J, Suter U, Senderek J, Chrast R (2009) SH3TC2/KIAA1985 protein is required for proper myelination and the integrity of the node of ranvier in the peripheral nervous system. Proc Natl Acad Sci U S A 106:17528–17533. 10.1073/pnas.0905523106 - DOI - PMC - PubMed
    1. Beltman JB, Marée AF, de Boer RJ (2009) Analysing immune cell migration. Nat Rev Immunol 9:789–798. 10.1038/nri2638 - DOI - PubMed
    1. Chatterjee S. (2014) Artefacts in histopathology. J Oral Maxillofac Pathol 18:S111–S116. 10.4103/0973-029X.141346 - DOI - PMC - PubMed
    1. D'Agostino PM, Gottfried-Blackmore A, Anandasabapathy N, Bulloch K (2012) Brain dendritic cells: biology and pathology. Acta Neuropathol 124:599–614. 10.1007/s00401-012-1018-0 - DOI - PMC - PubMed
    1. Damani MR, Zhao L, Fontainhas AM, Amaral J, Fariss RN, Wong WT (2011) Age-related alterations in the dynamic behavior of microglia. Aging Cell 10:263–276. 10.1111/j.1474-9726.2010.00660.x - DOI - PMC - PubMed

Publication types

Grants and funding