. 2018 Jan 23;11(514):eaah4120.
doi: 10.1126/scisignal.aah4120.

Biased signaling by thyroid-stimulating hormone receptor-specific antibodies determines thyrocyte survival in autoimmunity

Affiliations

Biased signaling by thyroid-stimulating hormone receptor-specific antibodies determines thyrocyte survival in autoimmunity

Syed A Morshed et al. Sci Signal. .

Abstract

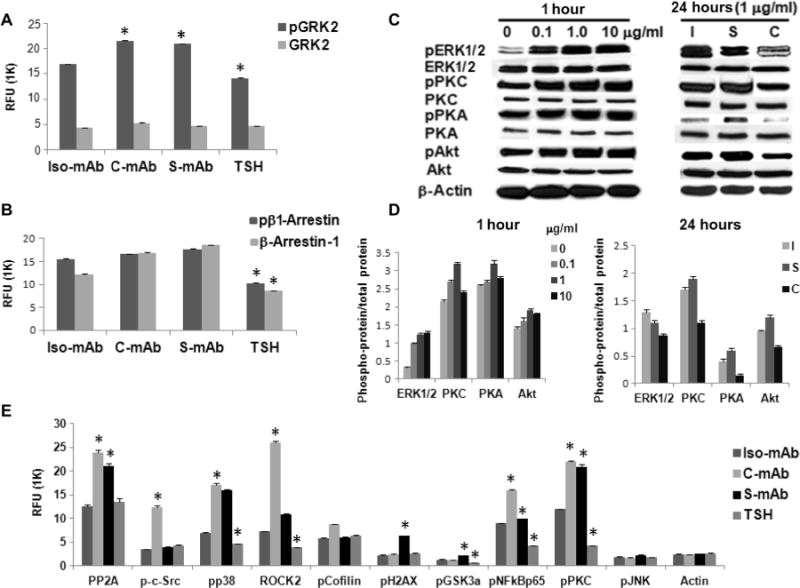
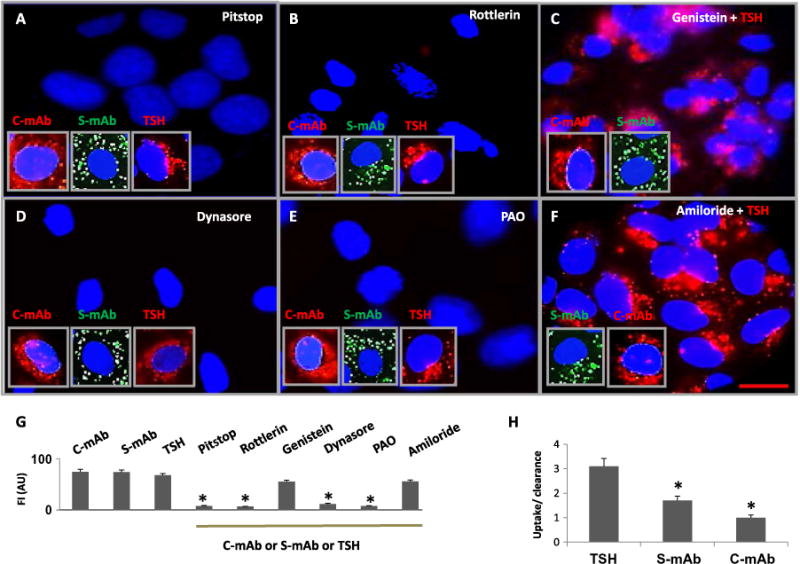
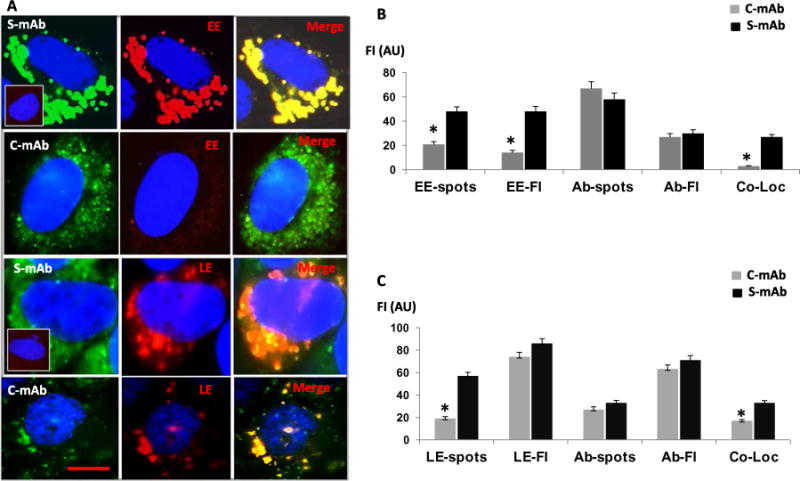
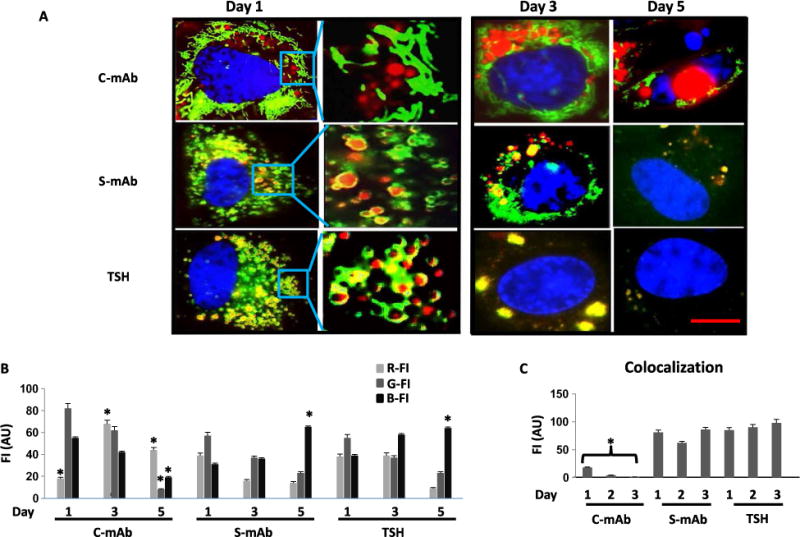
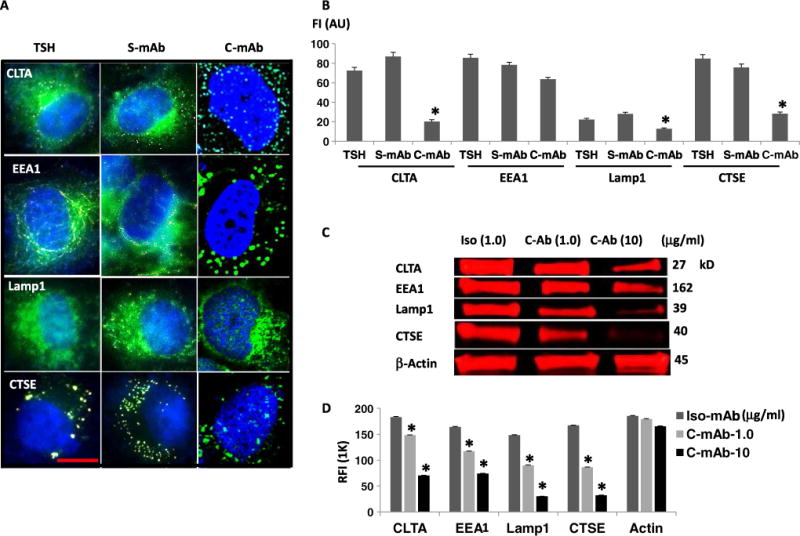
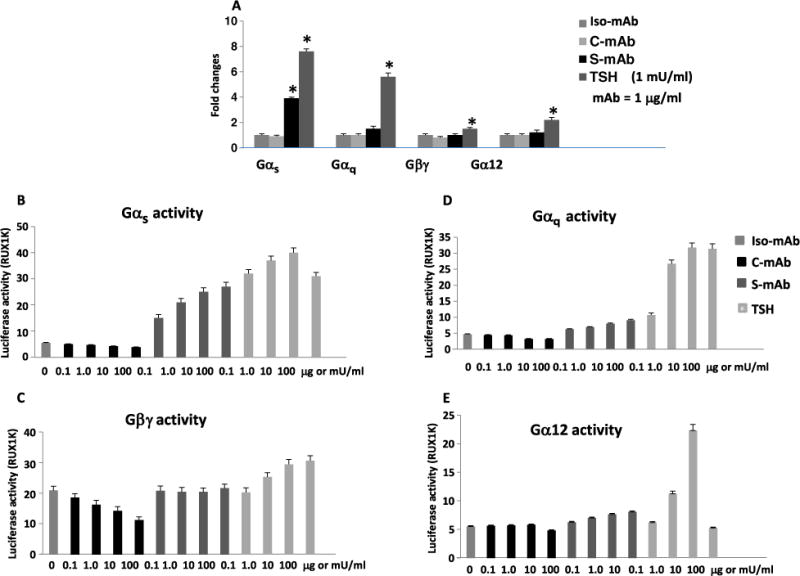
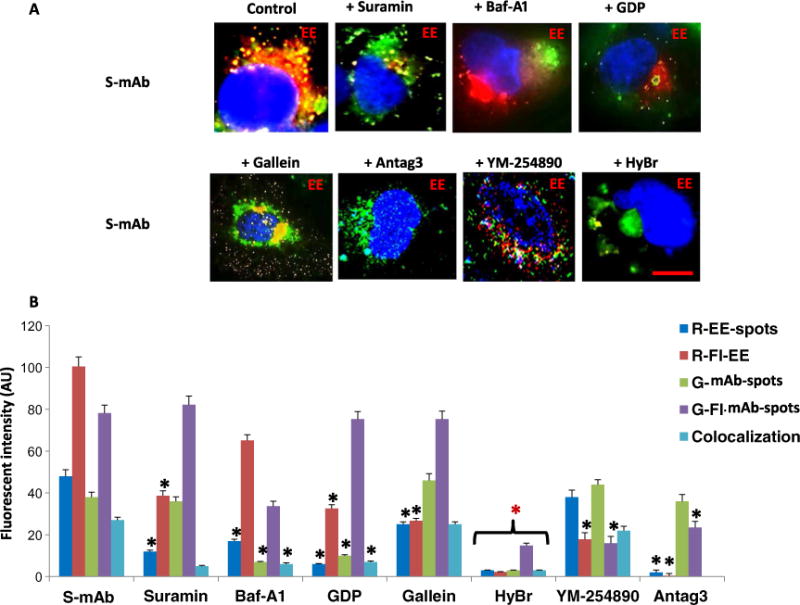
The thyroid-stimulating hormone receptor (TSHR) is a heterotrimeric guanine nucleotide-binding protein (G protein)-coupled receptor (GPCR). Autoimmune hyperthyroidism, commonly known as Graves' disease (GD), is caused by stimulating autoantibodies to the TSHR. We previously described TSHR-specific antibodies (TSHR-Abs) in GD that recognize linear epitopes in the cleavage region of the TSHR ectodomain (C-TSHR-Abs) and induce thyroid cell apoptosis instead of stimulating the TSHR. We found that C-TSHR-Abs entered the cell through clathrin-mediated endocytosis but did not trigger endosomal maturation and failed to undergo normal vesicular sorting and trafficking. We found that stimulating TSHR-Abs (S-TSHR-Abs) activated Gαs and, to a lesser extent, Gαq but that C-TSHR-Abs failed to activate any of the G proteins normally activated in response to TSH. Furthermore, specific inhibition of G proteins in the presence of S-TSHR-mAbs or TSH resulted in a similar failure of endosomal maturation as that caused by C-TSHR-mAbs. Hence, whereas S-TSHR-mAbs and TSH contributed to normal vesicular trafficking of TSHR through the activation of major G proteins, the C-TSHR-Abs resulted in GRK2- and β-arrestin-1-dependent biased signaling, which is interpreted as a danger signal by the cell. Our observations suggest that the binding of antibodies to different TSHR epitopes may decrease cell survival. Antibody-induced cell injury and the response to cell death amplify the loss of self-tolerance, which most likely helps to perpetuate GPCR-mediated autoimmunity.


Conflict of interest statement

Competing interests: The authors declare that they have no competing interests.

Figures

Fig. 1
Fig. 1. C-TSHR-mAb stimulates biased signaling in thyrocytes through the activation of GRK2 and β-arrestin-1
(A) Thyrocytes were treated with thyroid-stimulating hormone (TSH) (1 mU/ml) or with isotype control monoclonal antibody (Iso-mAb), C-TSHR-mAb (C-mAb), or S-TSHR-mAb (S-mAb) (all at 1 μg/ml) for 1 hour. The relative abundances of total heterotrimeric guanine nucleotide–binding protein (G protein)–coupled receptor kinase 2 (GRK2) and phosphorylated GRK2 (pGRK2) were then measured by proteomic array. The relative fluorescence unit (RFU) from bound antibody was then measured. Data are means ± SEM of three independent experiments. *P < 0.02 compared to isotype control mAb–treated cells. (B) Cells treated as described in (A) were analyzed to determine the relative amounts of total and phosphorylated β-arrestin-1 (pβ1-Arrestin). Data are means ± SEM of three independent experiments. *P < 0.006 compared to isotype control mAb–treated cells. (C) Thyrocytes were treated for 1 hour with the indicated concentrations of C-TSHR-mAb in a dose-dependent manner (left) or for 24 hours (right) compared with isotype control mAb (I) and S-TSHR-mAb (S) (all at 1 μg/ml) before being analyzed by Western blotting with antibodies against the indicated proteins. Western blots are representative of three experiments. (D) Densitometric quantification of the Western blots shown in (C). Data are presented as the ratio between the abundances of the indicated total proteins and phosphorylated proteins. β-Actin was used as a loading control. *P < 0.05 compared to untreated or isotype control mAb. (E) Thyrocytes were treated with TSH (1 mU/ml) or with isotype control mAb, C-TSHR-mAb, or S-TSHR-mAb (all at 1 μg/ml) for 1 hour. PP2A, protein phosphatase 2A; pp38, phosphorylated p38; pCofilin; phosphorylated cofilin; pH2AX, phosphorylated histone 2AX; pGSK3a, phosphorylated glycogen synthase kinase 3α; pNFkBp65, phosphorylated NF-κB p65; pJNK, phosphorylated c-Jun N-terminal kinase. The relative abundances of the indicated proteins were then determined by protein array. Data are means ± SEM of three independent experiments. *P < 0.05 compared to isotype control mAb–treated cells.
Fig. 2
Fig. 2. C-TSHR-mAb induces clathrin-dependent endocytosis but fails to undergo normal vesicular trafficking and sorting
(A to F) Representative live-cell images of thyrocytes are shown in the presence of the indicated labeled TSHR-mAbs or TSH. In addition, the cells were treated with Pitstop (to inhibit clathrin; A), rottlerin [non-selective δ isoform of PKC (PKC-δ) inhibitor; B], genistein (caveolin inhibitor; C), dynasore (dynamin inhibitor; D), PAO (endocytosis inhibitor; E), or amiloride (micropinocytosis inhibitor; F). Endocytosis of labeled C-TSHR-mAb (red, inset), S-TSHR-mAb (green, inset), and TSH (red, inset) was observed. Scale bar, 100 μm. (G) Quantitative evaluation of internalized or nonendocytosed antibodies or TSH was performed in live cells. Data are means ± SEM of three independent experiments with three or more microscopic images analyzed per experiment. *P < 0.006 compared to TSHR-mAb–, TSH-, genistein-, and amiloride-treated cells. FI, fluorescence intensity; AU, arbitrary units. (H) The ratio of the relative abundance of labeled antibody or TSH taken up by the cells (endocytosed) to that cleared by the cell (sorted or secreted into the culture medium) was determined. Data are means ± SEM of three independent experiments. *P < 0.01 compared to TSH.
Fig. 3
Fig. 3. C-TSHR-mAb fails to induce endosomal maturation in thyrocytes
(A) Representative live-cell images of early endosomes (EE; red) induced by S-TSHR-mAb (green) or C-TSHR-mAb (green). The top panel inset shows that no induction of EE formation occurred in the absence of antibody. Representative live-cell images of late endosomes (LE; red) are shown in the bottom two panels. Inset (third row, left column) shows the lack of induction of LE formation in the absence of antibody. Scale bar, 100 μm. (B) EE-spots, EE-FI, Ab-spots, Ab-Fl, and Co-Loc (colocalization) by TSHR-mAbs were quantified by image analysis software and expressed in arbitrary units. *P < 0.005 compared to S-mAb. (C) LE-spots, LE-FI, Ab-spots, Ab-Fl, and Co-Loc in TSHR-mAb–treated thyrocytes were also quantified. Data are means ± SEM of three independent experiments with at least three images per experiment analyzed. *P < 0.005 compared to S-mAb.
Fig. 4
Fig. 4. C-TSHR-mAb fails to undergo lysosomal degradation
(A) Microscopic analysis of lysosomal three-dimensional structure was visualized in round red organelles encircled in yellow (colocalization of the indicated TSHR-mAbs or TSH; red with green). Accumulated C-TSHR-mAb (red) in the perinuclear region at day 3 is shown in the top panel. DNA fragmentation at day 5 (apoptosis, blue) is shown in the top right panel. Clearance of endocytosed labeled S-TSHR-mAb or TSH (red) on day 5 is accompanied by the lack of DNA fragmentation. Representative live-cell images of lysosomes (green) and labeled TSHR-mAbs (red) or TSH (red) are shown in the insets at higher magnifications. Images are representative of three independent experiments with at least three images analyzed per experiment. Scale bar, 100 μm. (B) Quantitative analysis of the representative images shown in (A) was measured as red FI (R-FI), green FI (G-FI), and blue FI (B-FI) in arbitrary units. Data are means ± SEM of three independent experiments. *P < 0.002 compared to S-mAb or TSH. (C) The colocalization of lysosomes (green) with the indicated TSHR-mAbs (red), which is represented as yellow fluorescence, was also quantified. Data are means ± SEM of three independent experiments. *P < 0.004 compared to S-mAb or TSH.
Fig. 5
Fig. 5. C-TSHR-mAb induces fewer vesicular proteins
(A) Immunohistochemical analysis of clathrin light chain (CLTA), EE (EEA1), LE (Lamp1), and cathepsin E (CTSE) after the exposure of thyrocytes to TSH or the indicated antibodies for 24 hours. Scale bar, 100 μm. Images are representative of three independent experiments. (B) The relative abundances of CLTA, EEA1, Lamp1, and CTSE in cells treated with the indicated reagents were then quantified by image analysis and expressed as FI in arbitrary units. Data are means ± SEM of three independent experiments. *P < 0.03 compared to S-mAb. (C) LI-COR Western blot analysis of cells after exposure to isotype control mAb [hamster immunoglobulin G2 (IgG2), κ chain] or the indicated concentrations of C-TSHR-mAb. Western blots are representative of three independent experiments. (D) Quantification of the relative FI (RFI) of the bands in the Western blots represented in (C) with Image Studio software. Data are means ± SEM of three independent experiments. *P < 0.008 compared to the isotype control mAb.
Fig. 6
Fig. 6. C-TSHR-mAb fails to activate major G proteins
(A) G protein activities were detected by dose-dependent luciferase activity assays in Chinese hamster ovary (CHO)–TSHR cells. The activities of the indicated G proteins (Gαs, Gαq, Gβγ, and Gα12) were measured after treatment of the cells with the indicated TSHR-mAbs (1 μg/ml) or TSH (1 mU/ml). Data are presented as the fold change in luciferase activity and are means ± SEM of three independent experiments. *P < 0.0001 compared to S-TSHR-mAb or TSH. (B to E) Dose-dependent activation or inhibition of the indicated G proteins by the indicated antibodies or TSH was determined by measurement of luciferase activity in the treated CHO-TSHR cells. Data are means ± SEM of three independent experiments.
Fig. 7
Fig. 7. Lack of G protein activation fails to induce endosomes
(A) Perturbation of the S-TSHR-mAb–induced formation of early endosomes (red) by the G protein disruptors suramin, hydrobromide (HyBr), and Antag3. Note that Baf-A1 and guanosine diphosphate (GDP) induced malformed EE formation. Antibodies are labeled in green. Scale bar, 100 μm. Images are representative of three independent experiments. (B) Quantification of the images represented in (A) was performed by measuring the FI of red EE-spots (R-EE-spots), R-FI-EE, green mAb-spots (G-mAb-spots), G-Fl mAb-spots, and colocalization. Data are means ± SEM of three experiments with at least three images analyzed per experiment. *P < 0.003 compared to S-mAb.

References

    1. Li J, Ning Y, Hedley W, Saunders B, Chen Y, Tindill N, Hannay T, Subramaniam S. The Molecule Pages database. Nature. 2002;420:716–717. - PubMed
    1. Kobilka BK. Agonist-induced conformational changes in the β2 adrenergic receptor. J Pept Res. 2002;60:317–321. - PubMed
    1. Farid NR, Szkudlinski MW. Minireview: Structural and functional evolution of the thyrotropin receptor. Endocrinology. 2004;145:4048–4057. - PubMed
    1. Calebiro D, Nikolaev VO, Lohse MJ. Imaging of persistent cAMP signaling by internalized G protein-coupled receptors. J Mol Endocrinol. 2010;45:1–8. - PubMed
    1. Cherezov V, Rosenbaum DM, Hanson MA, Rasmussen SG, Thian FS, Kobilka TS, Choi HJ, Kuhn P, Weis WI, Kobilka BK, Stevens RC. High-resolution crystal structure of an engineered human β2-adrenergic G protein–coupled receptor. Science. 2007;318:1258–1265. - PMC - PubMed

Publication types

LinkOut - more resources