Review
. 2018 Jan 24;553(7689):418-426.
doi: 10.1038/nature25022.

From haematopoietic stem cells to complex differentiation landscapes

Affiliations
Review

From haematopoietic stem cells to complex differentiation landscapes

Elisa Laurenti et al. Nature. .

Abstract

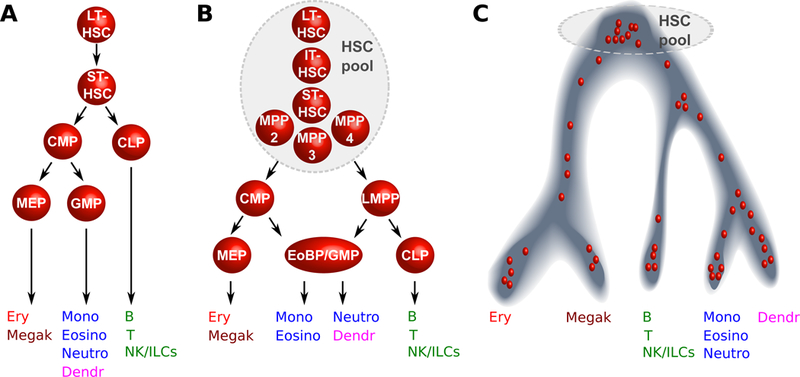
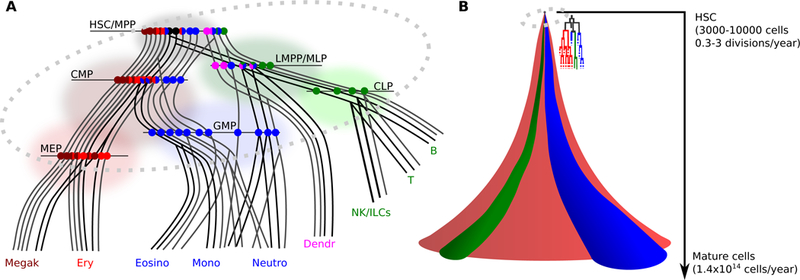
The development of mature blood cells from haematopoietic stem cells has long served as a model for stem-cell research, with the haematopoietic differentiation tree being widely used as a model for the maintenance of hierarchically organized tissues. Recent results and new technologies have challenged the demarcations between stem and progenitor cell populations, the timing of cell-fate choices and the contribution of stem and multipotent progenitor cells to the maintenance of steady-state blood production. These evolving views of haematopoiesis have broad implications for our understanding of the functions of adult stem cells, as well as the development of new therapies for malignant and non-malignant haematopoietic diseases.


Figures

Fig.1:
Fig.1:. Timeline of hierarchical models of hematopoiesis.
A. Visualisation based on state-of-the-art around the year 2000: HSCs are represented as a homogeneous population downstream of which the first lineage bifurcation separates the myeloid and lymphoid branches via the CMP and CLP populations; B. During the years 2005 to 2015 this visualisation incorporates new findings: the HSC pool is now accepted to be more heterogeneous both in terms of self-renewal (vertical axis) and differentiation properties (horizontal axis), the myeloid and lymphoid branches remain associated further down in the hierarchy via the LMPP population, the GMP compartment is shown to be fairly heterogeneous . C. From 2016 onwards, single cell transcriptomics snapshots indicate a continuum of differentiation. Each red dot represents a single cell and its localisation along a differentiation trajectory.
Fig.2:
Fig.2:. Trajectory based visualizations of the hematopoietic hierarchy.
A. 2D visualisation of early hematopoiesis. Continuous lines: trajectories of differentiation for different types of single cells present in the phenotypic HSC compartment (grey shaded area). Along these trajectories, cells and their progeny pass through progenitor compartments commonly defined by specific combinations of cell surface markers (shaded areas). Horizontal lines represent snapshots of the lineage potential of the cells present in each phenotypic compartment (single colour circles: unilineage cells, 2 colours circles: bi-lineage cells, 3 colours circles: tri-lineage cells, black circles: multipotent cells). In most progenitor compartments the number of unilineage cells outnumbers that of bi- or tri-lineage ones. The figure illustrates differentiation trajectories reported in the literature to date, but their proportions may not reflect the in vivo situation. B. 3D visualisation of the progeny of one single HSC. Red, blue and green respectively represent the erythroid, myeloid and lymphoid lineage. Cell history, division and progenitor expansion should all be considered when modelling the differentiation journey of one HSC and all its progeny. In an adult human, there are an estimated 3000–10000 HSCs, which most likely divide only from once every 3 months to once every 3 years . Humans produce an estimated 1.4×10¹⁴ mature blood cells/year. The amplification from a few thousand HSCs therefore is staggering and must include a strong contribution from a transient-amplifying compartment. Also, because there are many more terminally differentiated erythroid cells than myeloid cells, and even less lymphoid cells, all with different turn-over rates, the flux into each compartment must be highly regulated.
Fig.3:
Fig.3:. The composition of the HSPC compartment changes in space and time.
HSPCs are found in many organs in the body across a lifetime. Cells of different colours represent distinct HSPC subsets. To date it is unclear whether all HSPC subsets and differentiation trajectories are present in the same proportions in each of the organs. Current evidence suggests that age-related changes result from a combination of shifts in the composition of the HSPC pool, as well as phenotypic changes in particular cell types driven by intrinsic genetic and epigenetic changes as well as systemic alterations of the microenvironment. AGM: Aorta Gonad Mesonephros.

References

    1. Haeckel E Natürliche Schöpfungsgeschichte. (Georg Reimer, 1868).
    1. Pappenheim A Ueber Entwickelung und Ausbildung der Erythroblasten. Virchows Arch Pathol Anat 145, 587–643 (1896).
    1. Pappenheim A Zwei Fälle akuter grosslymphozytärer Leukämie. Fol Haematol 4, 301–308 (1907).
    1. Jacobson LO, Simmons EL, Marks EK & Eldredge JH Recovery from Radiation Injury. Science 113, 510–511 (1951). - PubMed
    1. Till JE & McCulloch EA A direct measurement of the radiation sensitivity of normal mouse bone marrow cells. Radiat. Res. 14, 213–222 (1961). - PubMed

Publication types