. 2018 Feb 1;554(7690):62-68.
doi: 10.1038/nature25459. Epub 2018 Jan 24.

Evolutionary routes and KRAS dosage define pancreatic cancer phenotypes

Affiliations

Evolutionary routes and KRAS dosage define pancreatic cancer phenotypes

Sebastian Mueller et al. Nature. .

Abstract

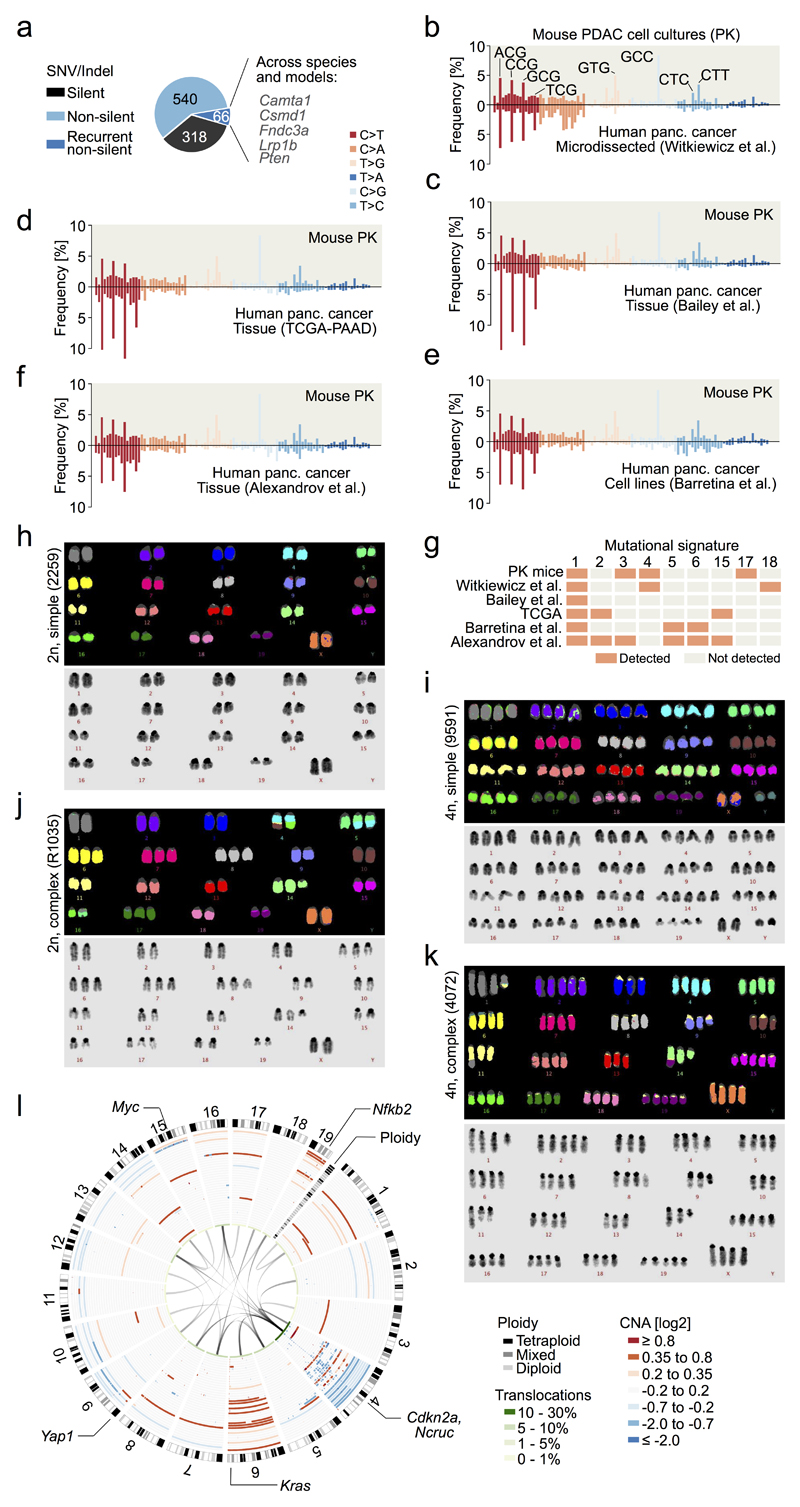
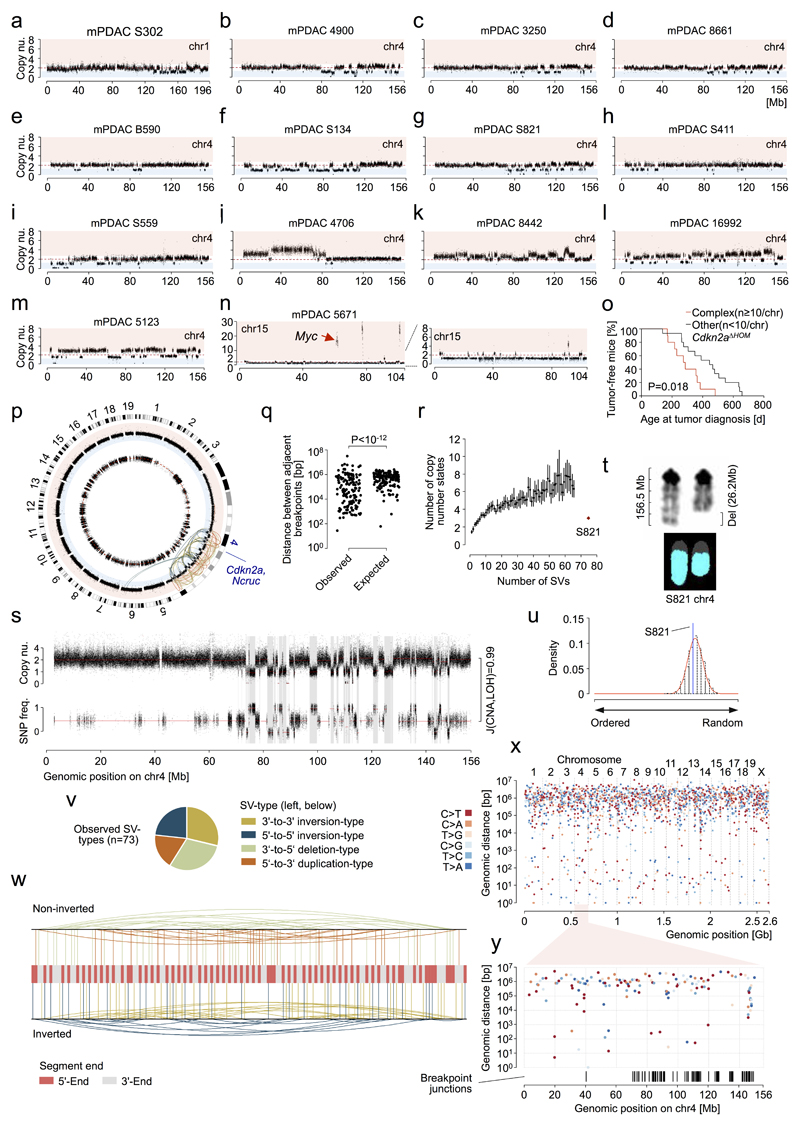
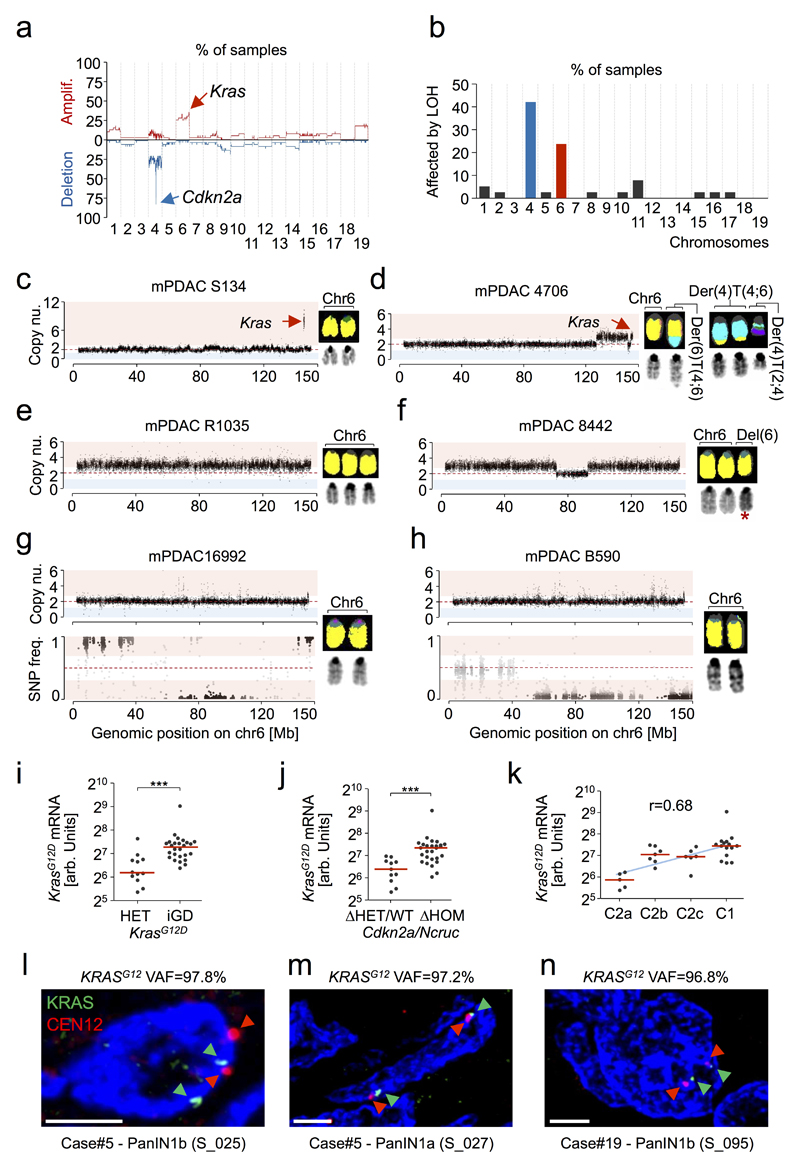
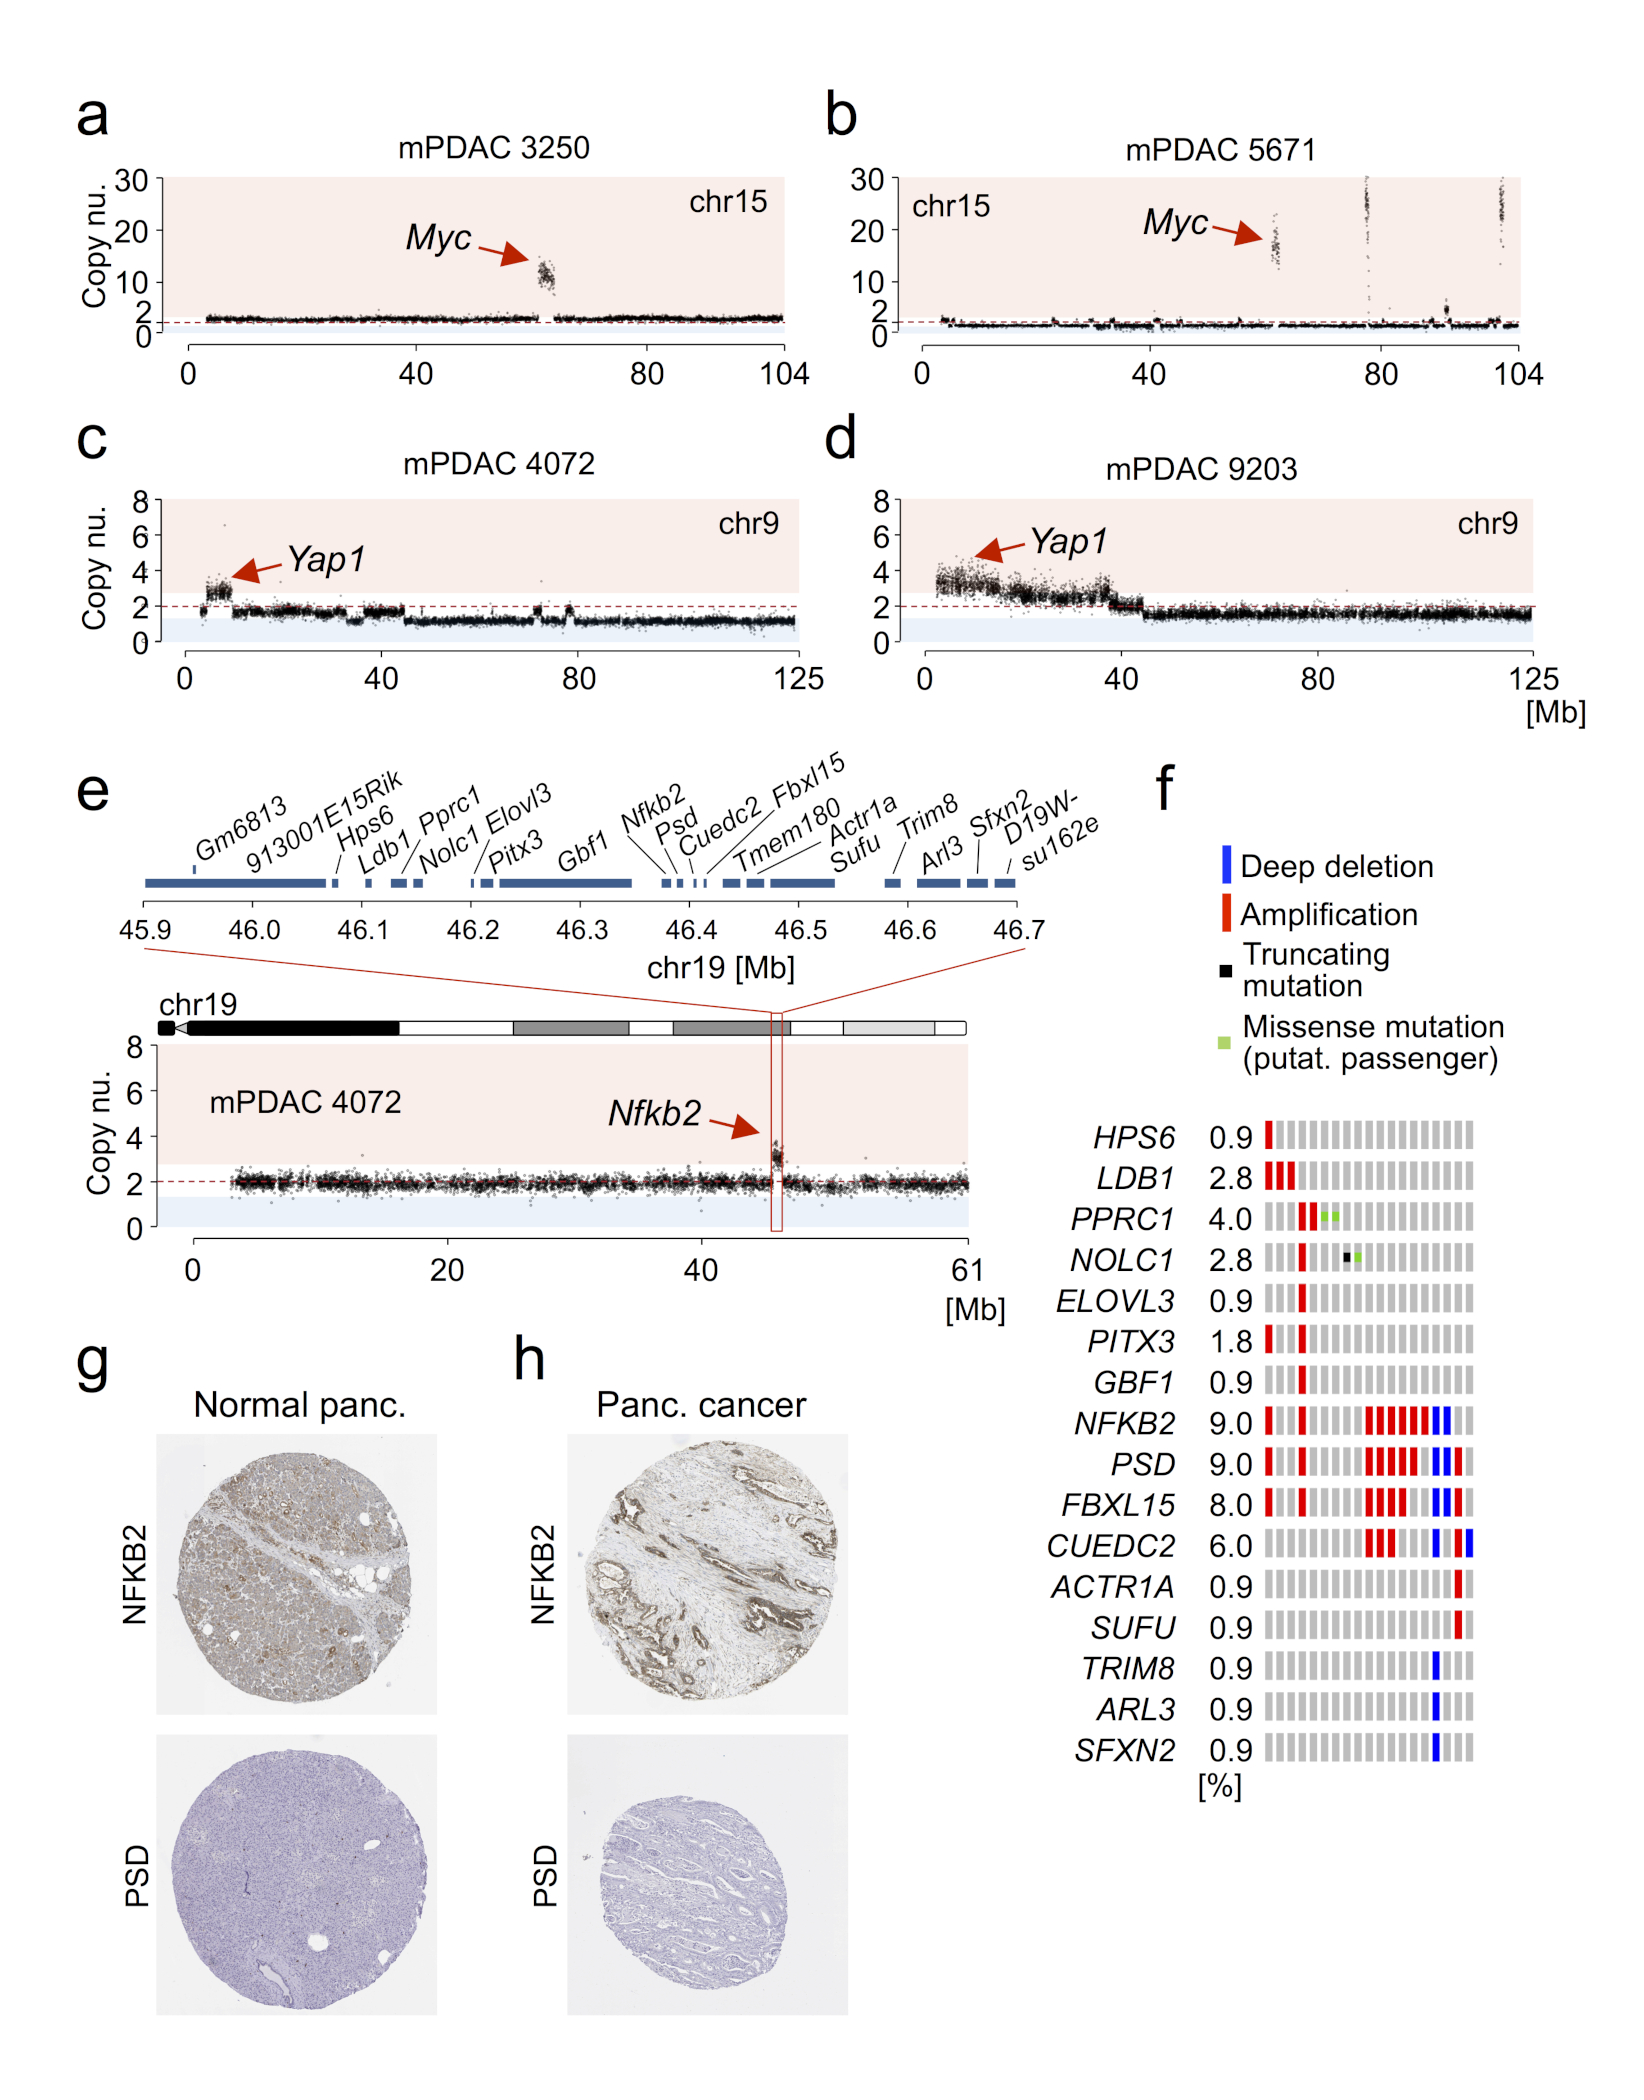
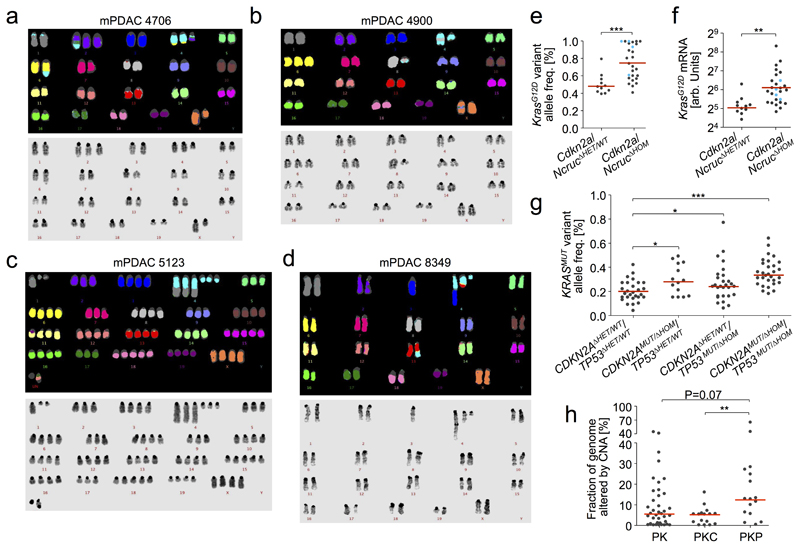
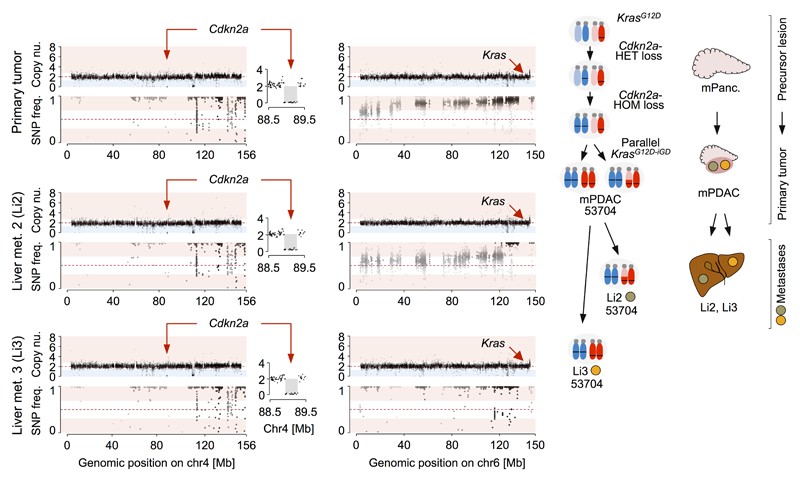
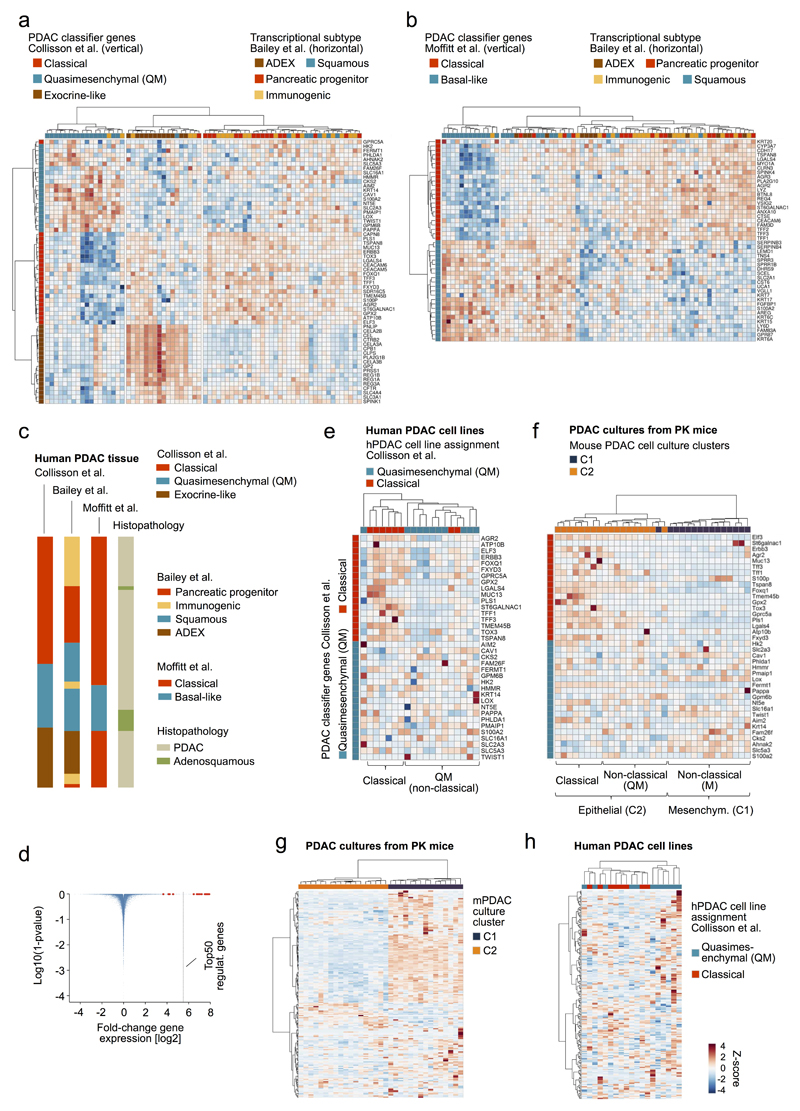
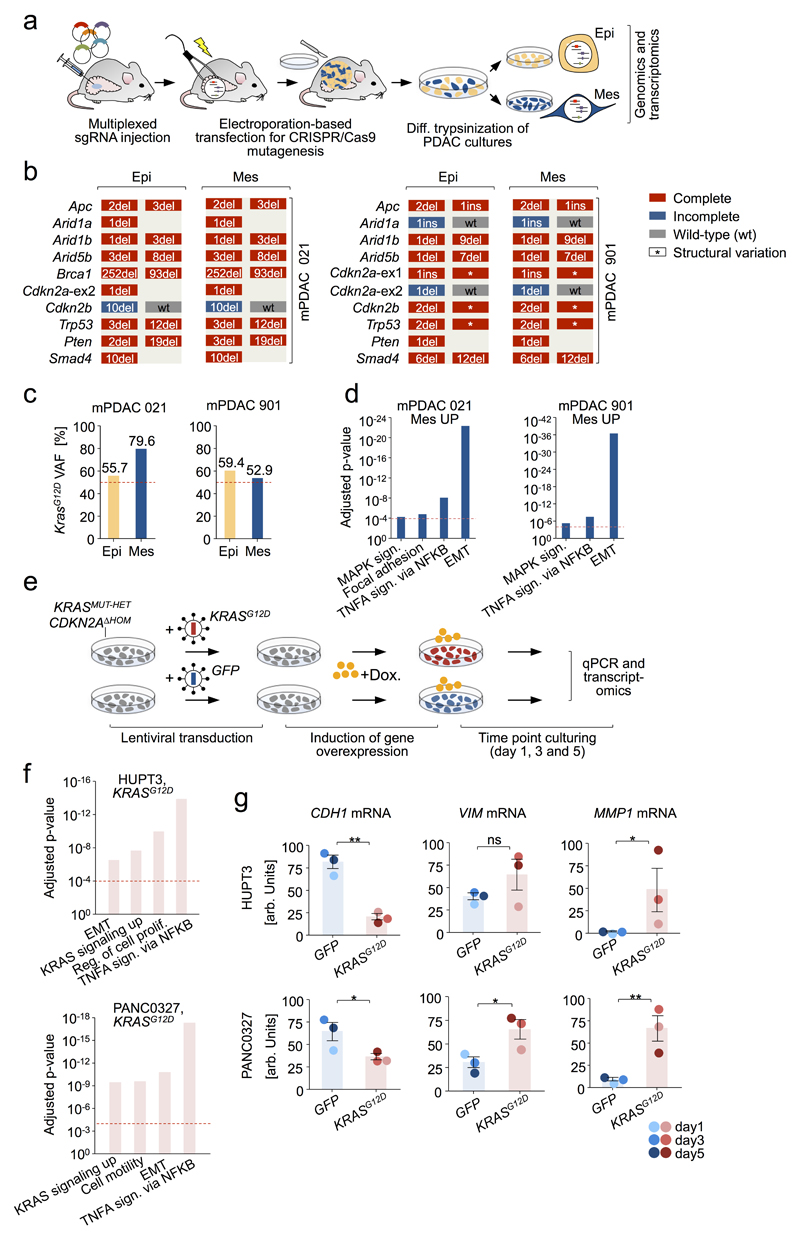
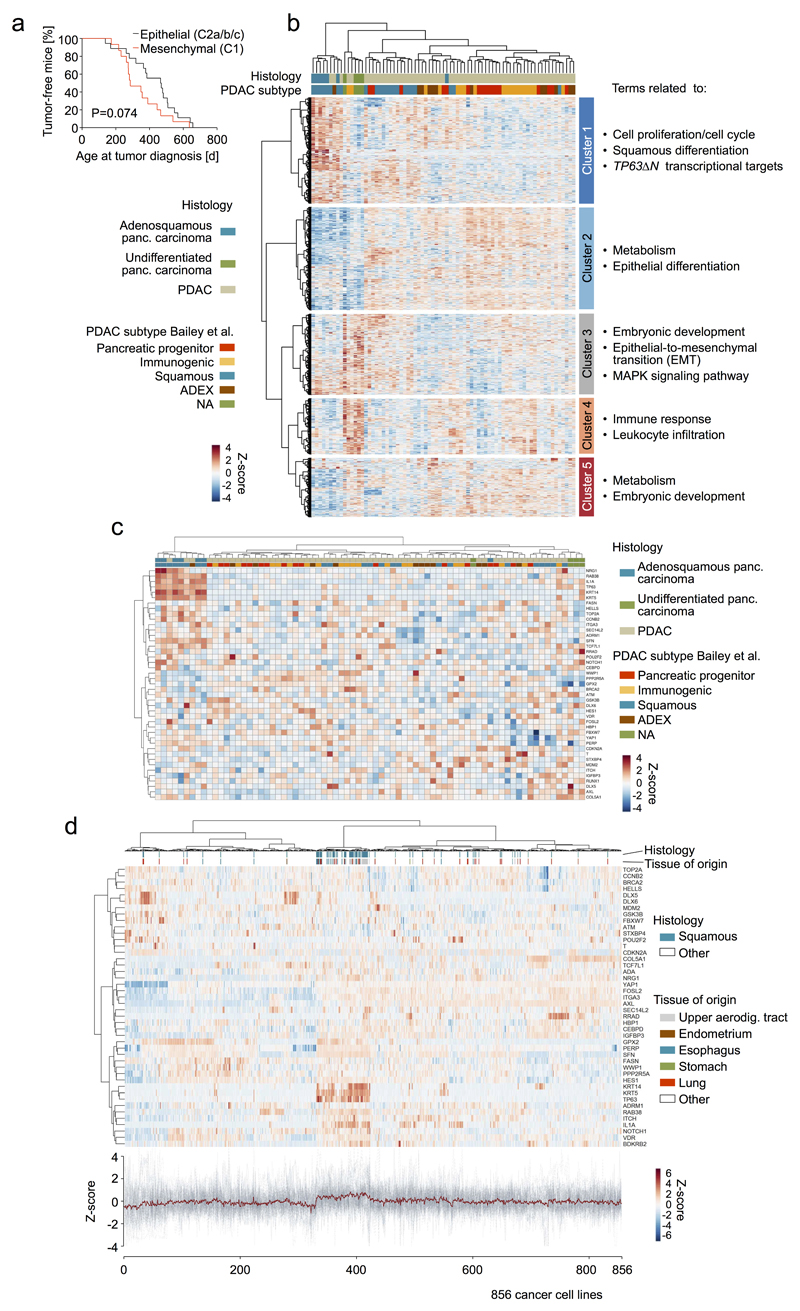
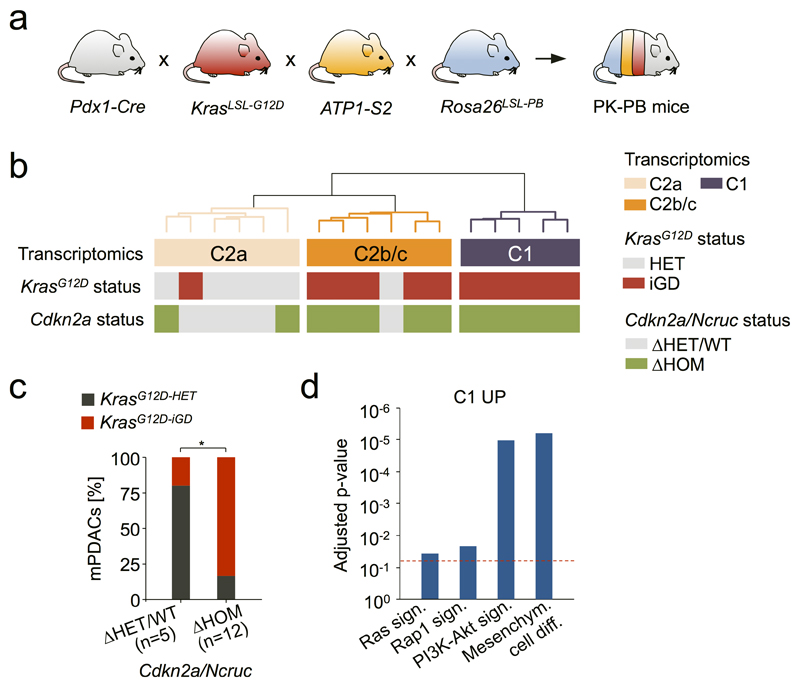
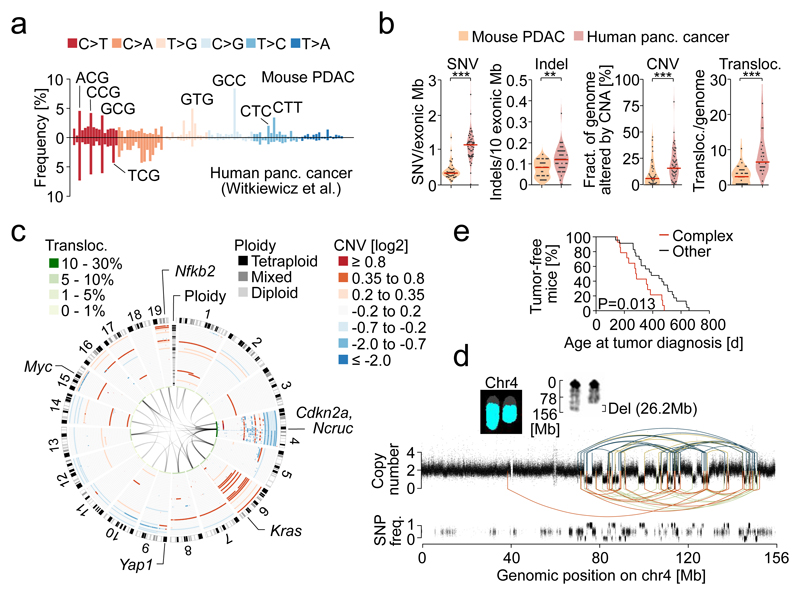
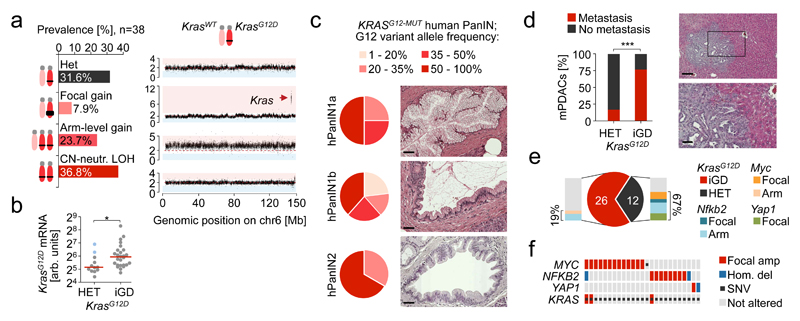
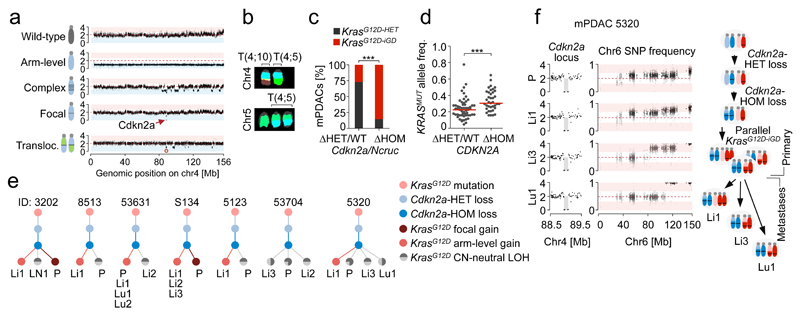
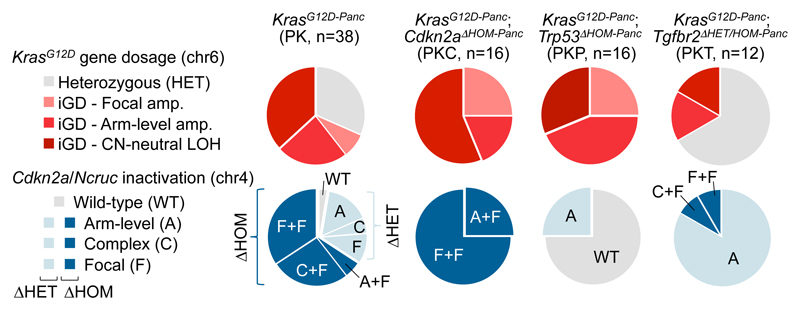
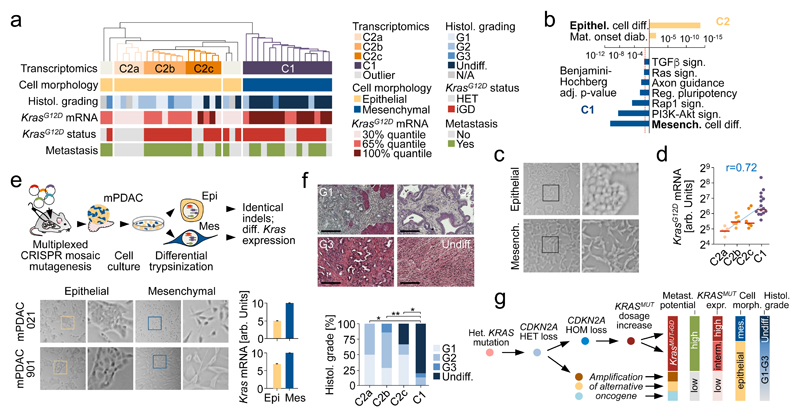
The poor correlation of mutational landscapes with phenotypes limits our understanding of the pathogenesis and metastasis of pancreatic ductal adenocarcinoma (PDAC). Here we show that oncogenic dosage-variation has a critical role in PDAC biology and phenotypic diversification. We find an increase in gene dosage of mutant KRAS in human PDAC precursors, which drives both early tumorigenesis and metastasis and thus rationalizes early PDAC dissemination. To overcome the limitations posed to gene dosage studies by the stromal richness of PDAC, we have developed large cell culture resources of metastatic mouse PDAC. Integration of cell culture genomes, transcriptomes and tumour phenotypes with functional studies and human data reveals additional widespread effects of oncogenic dosage variation on cell morphology and plasticity, histopathology and clinical outcome, with the highest KrasMUT levels underlying aggressive undifferentiated phenotypes. We also identify alternative oncogenic gains (Myc, Yap1 or Nfkb2), which collaborate with heterozygous KrasMUT in driving tumorigenesis, but have lower metastatic potential. Mechanistically, different oncogenic gains and dosages evolve along distinct evolutionary routes, licensed by defined allelic states and/or combinations of hallmark tumour suppressor alterations (Cdkn2a, Trp53, Tgfβ-pathway). Thus, evolutionary constraints and contingencies direct oncogenic dosage gain and variation along defined routes to drive the early progression of PDAC and shape its downstream biology. Our study uncovers universal principles of Ras-driven oncogenesis that have potential relevance beyond pancreatic cancer.


Conflict of interest statement

The authors declare no competing financial interests.

Figures

Extended Data Figure 1
Extended Data Figure 1. Mutational patterns, karyotype complexity and structural alterations in primary PDAC.
a, Single nucleotide variants (SNVs) and indels in primary PDAC cultures derived from 38 KrasG12D (PK) mice, as detected by whole-exome sequencing. Recurrently mutated genes that are frequently altered in human cancers and/or genomewide pancreas-specific transposon screens are indicated. b, Frequency of somatic base substitutions based on trinucleotide context in mouse (n=38 PK mice) and human PDAC (n=51 patients, data used for analysis from 6). b-f, Mutation spectra defined by trinucleotide contexts around base substitutions as detected by whole-exome sequencing show similar patterns in PK mice (n=38) and in relevant human pancreatic cancer cohorts. Base substitutions were extracted from BAM, VCF or MAF files from: b, Witkiewicz et al., c, Bailey et al., d, TCGA-PAAD, e, Barretina et al. and f, Alexandrov et al.. Additional information regarding the analysis of each cohort is provided in Supplementary Table 2. g, Mutational signatures in mouse and human pancreatic cancer cohorts. Information on mutational signatures was used from Alexandrov et al., who identified 21 mutational signatures operative in human cancer. The „deconstructSigs“ tool was used to determine the composition of the given set of 21 mutational signatures in each pancreatic cancer cohort. Extraction of mutational signatures strongly depends on SNV load per tumor. Due to the low mutational burden of mPDACs from PK mice (median of 18 SNVs per tumor as detected by WES), the analyses of mutational signatures could not be performed at the level of individual tumors. We have therefore investigated the contribution of each of the 21 mutational signatures to the SNV spectrum at the cohort-level (see Methods). Signature 1, reflecting age-associated C>T transversions at NCG trinucleotides, was the only signature consistently identifiable in all cohorts of human and mouse pancreatic cancer. In comparison to human cohorts, PK mice show C>G substitutions at GCC trinucleotides that cannot be attributed to one of 21 mutational signatures. Note that mutations at the GCC motif are not a general phenomenon of PDAC from PK mice, since only 4 samples are predominantly contributing to this peak. h-i, Representative M-FISH karyotypes with no or few karyotypic changes are shown for a diploid (40 chromosomes) and tetraploid mouse PDAC (81 chromosomes). Tumor 9591 shows gain of chr14. j, Representative karyotype of a complex diploid mPDAC genome with aneuploidy and translocations (46 chromosomes). Both copies of chr4 are involved in translocations: der(4)t(4;10) and der(4)t(4;16); likely affecting Cdkn2a. Further structural alterations and copy number changes are: +5, der(5)t(4;5)*2, +6, +7, +8, del(9), +14, del(14), der(16)t(5;16), +17. k, Representative example of a complex tetraploid mPDAC karyotype (77 chromosomes). Structural alterations are: der(1)t(1;11), dic(9;9), der(11)t(1;11), and der(14)t(14;19). Single chromosomal copy number changes are: +2, -3, -9, -10, -11, -13, -14, +15 and +19. Del, deletion; der, derivative chromosome; dic, dicentric chromosome; t, translocation; „-“, chromosome loss; „+“, chromosome gain. l, (Extension to Fig. 1c.) Circos plot shows CNAs assessed by aCGH as well as translocations and ploidy states detected by M-FISH in 38 primary PDACs derived from PK mice (n=38). CNAs for each mPDAC are displayed as log2 difference from tail control. Frequencies of translocations per chromosome are indicated in green in the inner circle of the graph. Connecting lines indicate individual translocations and involved chromosomes. On chr4, genomic alterations frequently involve Cdkn2a or Ncruc, a Non-coding regulatory region upstream of Cdkn2a (27/38 cancers with homozygous and 10/38 with heterozygous inactivation of Cdkn2a and/or Ncruc). Only one cancer remained Cdkn2aWT. The target of copy number changes on chr6 is KrasG12D, either through arm level gain or focal amplification. In addition, primary mPDAC of PK mice exhibited recurrent genetic amplifications affecting other known oncogenes, such as Myc or Yap1, or Nfkb2, a novel oncogenic PDAC driver identified in this study (see also Fig. 2e,f and Extended Data Figure 4).
Extended Data Figure 2
Extended Data Figure 2. Characterization of complex rearrangements in PDAC from PK mice and statistical inference of chromothripsis based on whole genome sequencing (WGS).
a-n, Copy number profiles of chromosomes with complex rearrangements (defined as n≥10 CNAs per chromosome) from primary mPDAC cell cultures as detected by aCGH. A total of 14 mPDACs had chromosomes with complex rearrangements. a-i, Nine primary mPDACs show copy number patterns characterized by heterozygous deletions and oscillation of copy number around few states, indicating chromothripsis as the underlying mechanism. g, mPDAC-S821 was subjected to whole genome sequencing for the inference of chromothripsis using previously established criteria (see Fig. 1d and Extended Data Figure 2p-w). j-m, Four primary mPDACs showed complex rearrangements with multiple copy number states on chr4, likely acquired through progressive/sequential rearrangement cycles. n, Cancer 5671 carries a complex rearrangement on chr15 characterized by oscillating copy number states and 3 prominent focal amplifications, of which one contained the Myc oncogene. Myc amplification is most likely the result of double minute chromosome formation during chromothriptic rearrangement of chr15. o, Comparison of age at tumor diagnosis in Cdkn2aΔHOM-deleted cancers with (n=10) or without (n=15) complex clustered chromosomal rearrangements (n≥10 CNAs/chromosome). Complex clustered rearrangements are associated with significantly shortened time to tumor diagnosis, indicating accelerated tumor evolution through genetic crisis. Two-sided log-rank test. p, Criteria proposed by Korbel et al. were tested for the inference of chromothripsis. Circos plot displays SNP ratio (inner circle, red dashed line indicating heterozygosity), CNV (outer circle, blue area indicating deletion, red amplification) and structural variations (SVs, colors as in v) as detected by WGS. Chr4 shows a complex deletion pattern and massive rearrangements associated with loss of one copy of Cdkn2a. The second copy of Cdkn2a is focally deleted. In addition, a balanced translocation of a ~200Kb segment from trisomic chr6 to chr4 and a far smaller segment of chr4 into chr6 was detected. The Kras locus is not directly affected by this inter-chromosomal translocation. LOH, CNAs and rearrangements are not detected on other chromosomes. q, In a chromothriptic model, DNA breakpoints tend to cluster on a chromosome. Testing against an exponential distribution (parameter λ derived from mean of observed distance between adjacent breakpoints), revealed significantly shorter distances than expected in a progressive model (n=146 breakpoints). P<10-12; χ_-goodness-of-fit test. r, In a progressive model of acquisition of massive rearrangements, copy number states tend to be more complex than in the chromothriptic. Monte Carlo simulations were used to generate a progressive evolution model with sequential accumulation of observed rearrangements (n=100 simulations per number of SVs). mPDAC S821 showed fewer copy number states on chr4 than expected in the progressive model. Mean is indicated as a black point and lines represent the 95% CI. s, Chromothriptic tumors typically feature interspersed loss and retention of heterozygosity. Accordingly, there was a high overlap between deleted regions and LOH segments on chr4 (Jaccard index (J) = 0.99). t, In a chromothriptic model, DNA shattering typically occurs on a single haplotype. M-FISH showed that significant loss of chromosomal content occurred on only one copy of chr4. u, To show random chromothriptic DNA shattering and re-joining, observed segments (n=73) were re-ordered by running Monte Carlo simulations (n=103) that generate a background probability distribution. S821 segment order lies within the chromothriptic null model. Two-sided P=0.78. v, All 4 SV-types are uniformly distributed in a chromothriptic tumor model. P=0.43; χ_-goodness-of-fit test. w, In a chromothriptic model, paired end connection types (as given by the SV-type) induce an alternating sequence of DNA segment ends when ordered according to the genomic position on the original chromosome. Tendency towards this alternating 3’-to-5’ pattern of rearranged DNA segment ends (n=146) was tested by using right-sided Wald-Wolfowitz runs test. P<10-12. x, Mutation clusters in relation to breakpoint junctions involved in chromothripsis are shown as rainfall plot for primary PDAC from PK mouse S821. Each dot represents a single somatic nucleotide variation (SNV) and is ordered on the x-axis according to its position in the mouse genome. The distance of each SNV to the previous SNV in the genome is shown on the y-axis. The coloring of individual SNV dots indicates the type of nucleotide substitution. y, Chr4 “zoom-in” from (x). Breakpoint junctions are shown according to their genomic position on chr4. No mutation clusters - neither in absence nor in combination with breakpoint junctions - were detected, consistent with chromothripsis involving end joining DNA repair mechanisms. This is in contrast to other complex rearrangement types, such as chromoanasynthesis, which arise through replication-based mechanisms with breakpoint-associated high mutation rates (e.g. kataegis).
Extended Data Figure 3
Extended Data Figure 3. Specificity, timing, mechanisms and impact of KrasG12D gene dosage alterations on gene expression in pancreatic tumorigenesis.
a, Overlay of copy number profiles of primary mPDAC cell cultures from PK mice (n=38) as determined by aCGH. Y-axis shows frequency of a genomic region to be amplified (up) or deleted (down) in the cohort, with Cdkn2a and Kras loci being most frequently affected by CNAs. b, Prevalence of LOH in primary mPDAC cell cultures from PK mice (n=38) based on whole exome sequencing (WES) data. A chromosome was considered to be affected by LOH if the SNP frequency was shifted to ≤0.1 or ≥0.9 in a segment with a size ≥200kb. LOH on chr4 is frequently the consequence of heterozygous deletions involving the Cdkn2a locus. By contrast, LOH on chr6 is predominantly copy number neutral and linked to increase in KrasG12D gene dosage. Chr4 (home of Cdkn2a) and chr6 (home of Kras) show markedly increased rates of LOH as compared to all other chromosomes reflecting their functional importance during tumorigenesis. c-h, Genetic mechanisms of KrasG12D gene dosage alterations as identified by aCGH, M-FISH and whole exome sequencing (WES) in pancreatic cancers from PK mice. The observed types of increased KrasG12D gene dosage acquisition were: (i) focal gain (affecting ≤50% of the chromosome length), arising either through replication-based mechanisms (2 cases, one with high-level KrasG12D amplification [shown in c] and one with low level amplification) or translocation and subsequent amplification of the translocated chromosome (one case [shown in d]), (ii) arm-level gain (affecting ≥50% of the chromosome length) arising through mitotic errors (7 cases of whole-chromosome gain [example shown in e], occasionally [2 cases] with concomitant intra-chromosomal deletions or translocations not affecting Kras [example shown in f]) and (iii) copy-number neutral LOH (CN-LOH, KrasG12D homozygosity, acquired uniparental disomy), arising either through mitotic recombination (affecting parts of chr6 [shown in h]) or chromosomal missegregation (duplication of KrasG12D-mutant chr6 and loss of wild-type chr6 [shown in g]). c, mPDAC S134 shows a high-order focal amplification of KrasG12D. Sharp borders, small size of the amplification (600kb) and strong increase in copy number (4x) indicate that KrasG12D was amplified through multiple cycles of repeated template-switching by a replication-based DNA repair mechanism. KrasG12D mutant allele frequency is 89.1%. d, Tumor 4706 carries a focal amplification of KrasG12D. M-FISH analysis revealed that the mutant KrasG12D allele (chr6) was likely first affected by a reciprocal translocation of chr4 and chr6, resulting in two rearranged chromosomes: Der(4)T(4;6) and Der(6)T(4;6). Subsequently, Der(4)T(4;6) was missegregated through mitotic error resulting in focal gain of the KrasG12D locus. KrasG12D mutant allele frequency is 72.2%. e, mPDAC R1035 shows ‘classical’ whole chromosome gain (trisomy) of chr6, which was likely generated through mitotic error/missegregation. The KrasG12D mutant allele frequency is 69.8%. f, In tumor 8442 arm-level gain of KrasG12D was likely generated through mitotic missegregation of chr6. Intra-chromosomal deletion on one of three chromosomes (19.6Mb) does not affect Kras. KrasG12D mutant allele frequency is 66.4%. Asterisk, chr6 with reduced length resulting from intra-chromosomal deletion. g-h, mPDAC 16992 and B590 display copy-number neutral LOH (CN-LOH) leading to increased KrasG12D gene dosage. KrasG12D mutant allele frequency is 99.2% and 96.3%, respectively. The SNP pattern of chr6 in mPDAC 16992 reveals that the whole chromosome is affected by CN-LOH indicating chromosome missegregation (duplication of the KrasG12D-mutant chr6 and loss of wild-type chr6) as the underlying mechanism. By contrast, in mPDAC B590 only a partial region of chr6 is affected by CN-LOH, therefore probably resulting from mitotic recombination. i, Allele-specific KrasG12D mRNA expression in KrasG12D-HET (n=12) vs. KrasG12D-iGD (n=26) primary PDAC cell cultures from PK mice as detected by combined analysis of amplicon-based RNA-Seq (proportion of mutant/wild-type Kras mRNA) and 3’-prime pA RNA-Seq (amount of total Kras mRNA, but not the proportion of mutant/wild-type Kras mRNA due to sequencing of 3’-prime transcript ends; see Methods section). This figure is related to Fig. 2b. ***P≤0.001, two-tailed Mann-Whitney test; bars, median. j, Mutant KrasG12D mRNA levels in Cdkn2a/NcrucΔHET/WT (n=11) vs. Ckdn2a/NcrucΔHOM (n=27) primary PDAC cell cultures from PK mice as detected by combined amplicon-based RNA-Seq and 3’-prime pA RNA-Seq. This figure is related to Extended Data Figure 5f. ***P≤0.001, two-tailed Mann-Whitney test; bars, median. k, Mutant KrasG12D mRNA levels in transcriptional clusters of mPDAC from PK mice (C2a/b/c/C1, n=5/7/6/15) as detected by combined amplicon-based RNA-Seq and 3’-prime pA RNA-Seq. This figure is related to Fig. 5d. P=1.6*10-5, two-sided Pearson correlation; bars, median. l-n, Interphase fluorescence in situ hybridization (FISH) for the analysis of copy-number and ploidy states at the KRAS locus on chr12 in human pancreatic intra-epithelial neoplasia (PanIN) with KRASG12 variant allele frequencies (VAFs) of ~100%. KRASG12 VAFs are indicated above each FISH profile as detected by amplicon-based deep sequencing. A VAF of ~100% can be caused either by loss of the wild-type KRAS-locus (hemizygosity of KRASG12-MUT: one KRASG12-MUT allele per cell) or by CN-LOH (acquired uniparental disomy; homozygosity of KRASG12-MUT: two KRASG12-MUT alleles per cell). All samples show a diploid genome as suggested by CEN12 (two red signals per nucleus). Neither loss of one KRAS allele nor monosomy of chr12 was observed providing evidence for CN-LOH and increased KRASG12-MUT gene dosage in hPanIN. Scale bars, 2.5µm; CEN12, centromere probe chr12.
Extended Data Figure 4
Extended Data Figure 4. Enrichment for amplification of alternative oncogenic drivers in mPDACs of PK mice with KrasG12D-HET status.
a-b, Two primary mPDACs with strong focal Myc amplification on chr15 are shown, as detected by aCGH. Red dashed line indicates no copy number change. c-d, Focal copy number gains targeting the Yap1 locus on chr9 in primary mPDACs 4072 and 9203 as revealed by aCGH. e, Chr19 was also frequently subject to arm-level gain (see Fig. 1c and Extended Data Figure 1l). Primary mPDAC of PK mouse 4072 harbors a focal gain on chr19 containing 20 genes: 9130011E15Rik, Gm6813, Hps6, Ldb1, Pprc1, Nolc1, Elovl3, Pitx3, Gbf1, Nfkb2, Psd, Fbxl15, Cuedc2, Tmem180, Actr1a, Sufu, Trim8, Arl3, Sfxn2, D19Wsu162e. f, Cross-species analyses revealed that the orthologous region on human chr10 is also subject to recurrent amplifications in human PDAC (8 out of 109 hPDACs have focal amplifications; data from Witkiewicz et al.6). Of the 20 mouse genes, sixteen could be assigned to orthologues in humans. Further analyses revealed that only two genes, NFKB2 and PSD, are within the minimal overlapping region of recurrent amplification (data from and oncoplot from cBioPortal60,61). g, NFKB2, but not PSD, shows medium protein expression in exocrine glandular cells of normal pancreatic tissue, as detected by immunohistochemistry (IHC, data from TheHumanProteinAtlas62). h, NFKB2 is highly expressed in 17% (2/12) of stained hPDAC biopsies as shown by IHC. In contrast, there was no PSD expression in any of the analyzed pancreatic cancers (0/12). Protein expression data was used from TheHumanProteinAtlas.
Extended Data Figure 5
Extended Data Figure 5. Characterization of Cdkn2a (chr4) alterations and correlation with KrasMUT gene dosage variation and mRNA expression in mouse and human PDAC.
a-d, Cdkn2a alteration on mouse chr4 can occur through arm-level, complex or focal loss as well as uniparental disomy (see Figure 3). In addition, chr4 is frequently involved in inter-chromosomal translocations. Examples of representative karyotypes of primary pancreatic cancer cultures derived from PK mice with translocations involving chr4, likely affecting the Cdkn2a locus. In all 4 cases, chr4 translocations were found in all 10 metaphase spreads of each cancer, indicating their early acquisition during tumor evolution. a, mPDAC 4706 with diploid karyotype: 42, XX, del(X), +2, der(2)t(2;4)is(2;4), der(4)t(4;6)*2, +der(4)t(2;4), der(6)t(4;6). b, mPDAC 4900 also features a diploid karyotype: 41, XX, der(X)is(X;4), der(4)is(4;8), del(4), +6, der(8)t(4;8). c, mPDAC 5123 underwent polyploidization, after translocation of chr4 with chr1 and an deletion on the other copy: 78, XXXX, -1, del(1)*2, -2, +4*2, der(4)t(1;4)*3, del(4)*3, -5, -7, -9, +15, -17, +18 d, mPDAC 8349 shows a diploid karyotype: 40,XX, der(4)t(3;4), der(4)t(4;13), +del(4), der(13)t(4;13). e, KrasG12D variant allele frequencies detected by amplicon-based deep sequencing of the Kras locus are higher in Cdkn2a/NcrucΔHOM mPDAC (n=27) as compared to Cdkn2a/NcrucΔHET/WT (n=11) pancreatic cancers. All cancers are from PK mice. Blue dots indicate tumors with complete Ncruc deletion. ***P≤0.001, two-tailed Mann-Whitney test; bars, median. f, Allele-specific expression of mutant KrasG12D mRNA is increased in primary tumors from PK mice with Cdkn2a/NcrucΔHOM (n=27) background in comparison to Cdkn2a/NcrucΔHET/WT (n=11) cancers. Primary mPDACs with homozygous loss of Ncruc are highlighted in blue. KrasG12D expression was analyzed by combining amplicon-based RNA-Seq and qRT-PCR (as described in the Methods section). **P=0.003, two-tailed Mann-Whitney test; bars, median. g, KRASMUT variant allele frequencies based on WES in a published dataset of microdissected human PDAC (Witkiewicz et al., reduced stromal content) was analyzed with respect to CDKN2A and TP53 status. KRASMUT allele frequency was higher in mutated/homozygous deleted CDKN2A and/or TP53 (CDKN2AMUT/ΔHOM/TP53MUT/ΔHOM; hPDACs as compared to cancers with CDKN2AΔHET/WT/TP53ΔHET/WT status (from left: n=28, n=14, n=28, n=30). Two-sided rank-based ANOVA (P=5.8*10-6); post hoc testing with two-sided Tukey honest significant difference test, *adj. P≤0.05, ***adj. P≤0.001; bars, median. h, Fraction of the genome altered by copy number changes detected by aCGH in primary mPDACs of PK (n=38), PKC (n=16) and PKP (n=16) mice. PKP mice show a significantly increased CNA load as compared to PKC mice. Two-sided rank-based ANOVA (P=0.01); post hoc testing with two-sided Tukey honest significant difference test, **adj. P=0.009, adj. P-values for group wise comparisons are shown; bars, median. Del, deletion; der, derivative chromosome; is, insertion; t, translocation; „-“, chromosome loss; „+“, chromosome gain.
Extended Data Figure 6
Extended Data Figure 6. Complete Cdkn2a barrier loss precedes KrasG12D-iGD in primary mPDAC of PK mouse 53704.
Copy number alterations at chr4 (Cdkn2a) and chr6 (Kras) in mPDAC 53704 and corresponding metastases, as detected by aCGH (top) and whole-exome sequencing based SNP pattern analysis (bottom). The primary cancer and both liver metastases display identical focal deletions of Cdkn2a and similar SNP patterns on chr4 revealing that all lesions share the same ancestor cell with complete Cdkn2a loss. By contrast, SNP analysis on chr6 revealed discordant patterns in the primary mPDAC and both metastases. Li2 shows partial LOH of a distal region on chr6 involving the Kras locus, while LOH in Li3 involves the whole chr6. This explains the step-wise LOH pattern observed on chr6 in the primary mPDAC. The graphic on the right shows the combined interpretation of CNV/LOH profiles, which suggests the following sequence of genetic events during tumor evolution: The initial KrasG12D mutation was followed by focal deletion of one copy of Cdkn2a. In a subsequent genetic event, the second copy of Cdkn2a was lost by chr4 missegregation and copy-number neutral LOH. Complete barrier loss allowed for convergent evolution of increased KrasG12D gene dosage through copy-number neutral LOH and gave rise to independent metastases in the liver. Note: A major obstacle for equivalent human studies is the limited availability of human matched primary/metastases samples, particularly of treatment naive ones. We performed cross-species analyses using data from a recent study, which analyzed human treatment-naive metastatic PDACs by whole-genome sequencing and provided CDKN2A and KRAS copy number data for matched primaries/metastases from 3 patients. In one patient the sequential order of CDKN2A deletion and KRAS amplification could be reconstructed: homozygous CDKN2A deletions were identical in all primaries and metastases, whereas there were 5 different KRAS gains in the 6 metastases. This suggests convergent evolution of mutant KRAS gene dosage gain upon homozygous CDKN2A loss in this patient, in line with similar data in large series of mouse cancers and their metastases (see Figure 3e).
Extended Data Figure 7
Extended Data Figure 7. Transcriptome-based subtyping of human primary pancreatic cancer and classification of human PDAC cell lines and primary PDAC cell cultures from PK mice.
a-c, Independent cross-comparison of transcriptional classification systems from Collisson et al., Moffitt et al. and Bailey et al.. Collisson et al. performed PDAC microdissection and defined 3 transcriptional subtypes: classical, quasimesenchymal (QM) and exocrine-like. Moffitt et al. defined 2 subtypes (classical, basal-like) using (i) virtual separation of tumor and non-tumor gene expression patterns, (ii) transplantation studies and (iii) human PDAC cell lines; and proposed that the exocrine-like signature stems from exocrine pancreatic cells, rather than from the cancer cells. Bailey et al. used bulk tumors and defined 4 subtypes (pancreatic progenitor, immunogenic, squamous, aberrantly differentiated endocrine exocrine [ADEX]). RNA-Seq data from PDAC and adenosquamous pancreatic carcinoma from Bailey et al. was used for cross-comparison of classification systems. Other histological subentities of pancreatic cancer were excluded (e.g. IPMN, MCN, acinar cell carcinoma). The Bailey subtyping for this dataset was available. a, Unbiased hierarchical clustering of primary pancreatic cancer samples (n=71) from Bailey et al. using Collisson classifier genes. b, Subtyping of primary pancreatic cancer samples (n=71) from Bailey et al. using classifier genes defined by Moffitt et al. c, Consensus clustering based on analyses performed in a/b. There is considerable overlap between at least two subtypes, which are in large parts captured by the initially proposed Collisson classical and quasimesenchymal (QM) signatures (which are also detected in mouse and human PDAC cell lines; see Extended Data Figure 7e-h). The Bailey classification (based on bulk tissue analyses) suggests that Collisson classical cancers (microdissected cancer tissue) can be further sub-stratified in some with and some without a strong immune cell infiltration. The Moffitt classification suggests that the Collisson exocrine-like signature (Bailey ADEX subtype) stems from “contaminating” healthy exocrine pancreatic cells, based on the evidence described above. Given that the Collisson exocrine-like signature was derived from microdissected PDAC, such “contamination” is only conceivable, if exocrine-like signature genes were dramatically higher expressed in pancreatic acinar cells as compared to PDAC cells. d, Volcano plot showing strongly upregulated expression of exocrine-like genes in human wild-type pancreas (13 to 241 fold; median: 183-fold upregulation). Note that 15 out of 19 exocrine-like signature genes (red dots) are among the top50 genes upregulated in human wild-type pancreas (n=3) as compared to hPDAC cell lines (n=30) (y axis is calculated on Benjamini-Hochberg adj. P-values derived from R package limma [see Methods section]). Although these data do not exclude the existence of exocrine-like PDACs, they support the possibility that “contamination” with few acinar cells can impose an exocrine-like signature on a cancer. This might explain why human or mouse PDAC cell lines don´t cluster into the exocrine-like subtype (see also Extended Data Figure 7e-f below). e, Hierarchical clustering of microarray-based expression profiles using Collisson identifier genes on human PDAC cell lines (n=19, GEO series GSE17891). As also described earlier by Collisson et al., only two subtypes can be detected in human cell line collections: classical and quasimesenchymal (QM). Of note, the most prominent change in the QM cell lines is downregulation (extinction) of the classical assigner genes, whereas expression of QM classifier genes is quite variable. We therefore also use here the terms classical and non-classical. f, Projection of the Collisson classifiers on mouse PDAC cell culture transcriptomes (n=33) also identified classical and non-classical subtypes. The non-classical subtype contained a subset of mPDAC cell cultures from cluster C2a/b/c (epithelial morphology; equivalent of human QM) and all cluster C1 mPDACs (mesenchymal morphology; “M” cluster). g, Application of a human EMT hallmark gene set for hierarchical clustering of expression profiles from primary PDAC cultures (PK mice; n=33) resulted in a separation of C1 (mesenchymal) and C2a/b/c (epithelial) cell lines. h, Projection of the EMT hallmark gene set on human PDAC cell line transcriptomes (n=19, GEO series GSE17891) did not result in a clear separation of samples, indicating underrepresentation of the mesenchymal M subtype (equivalent to murine C1/“M”) in available human cell line collections. As shown in Extended Data Figure 9b, however, the EMT signature is detectable in undifferentiated human pancreatic carcinoma, which is the human equivalent of the mesenchymal mouse PDACs in C1.
Extended Data Figure 8
Extended Data Figure 8. Functional analyses to study the role of KrasG12D gene dosage increase in EMT. a-d, Multiplexed somatic CRISPR/Cas9 mutagenesis for phylogenetic tracking of epithelial/mesenchymal mPDAC clones in vivo.
a, Graphic demonstrates major steps of multiplexed gene editing by pooled delivery of CRISPR/Cas9 vectors, each targeting a different tumor suppressor gene in the pancreas of PK mice. Electroporation-based transfection enables low-frequency mosaic vector delivery (average of 120 cells per pancreas are transfected) to induce clonal tumors. Primary tumor cell cultures were screened for the simultaneous presence of epithelial and mesenchymal cells. Two such cancers were identified (mPDACs from mouse 021 and mouse 901) and subjected to differential trypsinization in order to enrich for each morphology. b, Amplicon-based deep sequencing of all sgRNA-targeted loci revealed identical indel patterns in both epithelial/mesenchymal culture pairs. This shows (i) that epithelial and mesenchymal cells originate from the same clone and (ii) that the CRISPR-induced mutations are not contributing to the differential phenotype. c, KrasG12D variant allele frequencies in epithelial and mesenchymal cell cultures from mPDAC 021 and mPDAC 901, as detected by amplicon-based deep sequencing. Both cancers had increased KrasG12D expression in mesenchymal cells (see Fig. 5e). In mPDAC 021 this is due to selective amplification of the KrasG12D allele in mesenchymal cells. In mPDAC 901 genetic KrasG12D amplification was not observed, suggesting induction of increased Kras expression in mesenchymal cells by other mechanisms. d, Gene set enrichment analysis using “Molecular Signatures Database” (MSigDB) of differentially regulated genes in mesenchymal versus epithelial mPDACs based on RNA-Seq. Mesenchymal clones of mPDAC 021 and mPDAC 901 show an upregulation of genes involved in “MAPK signaling pathway” and “EMT” as compared to the corresponding epithelial clones, in line with increased KrasG12D gene dosage (a full list of enriched gene sets is provided for comparisons in Supplementary Table 15). FDR-adjusted P-values are shown on y axis. Representative data from one experiment are shown. e-g, induction of EMT-like transcriptional programs by KRASG12D overexpression in human PDAC cell lines. e, Graphic of experimental workflow. Two human PDAC cell lines (HUPT3 and PANC0327) with homozygous CKDN2A loss (CDKN2AΔHOM) and heterozygous KRASMUT (KRASMUT-HET) status were transduced with lentivirus carrying doxycycline-inducible KRASG12D or GFP-control expression constructs. KRASG12D or GFP expression was induced by adding doxycycline for 1, 3 and 5 days. f, Gene set enrichment analysis using “Molecular Signatures Database” (MSigDB) of differentially regulated genes in KRASG12D- versus GFP-induced hPDAC cell lines HUPT3 and PANC0327 based on RNA-Seq. Upon doxycycline treatment, both hPDAC cell lines showed a consistent upregulation of genes involved in “KRAS signaling up” and “EMT” (a full list of enriched gene sets is provided for both cell lines in Supplementary Table 16). FDR-adjusted P-values are shown on y axis. g, Expression of marker genes for epithelial (CDH1) or mesenchymal (VIM) cell differentiation and invasion/matrix disassembly (MMP1) was validated by qPCR (normalized to GAPDH and PPIA). In line with RNA-Seq data KRASG12D-induced cells show an increased expression of the mesenchymal marker gene VIM, increased expression of MMP1 and reduced levels of epithelial marker gene CDH1. *P≤0.05, **P≤0.005, ns=not significant, two-tailed t-test; bars=mean; error bars=SEM.
Extended Data Figure 9
Extended Data Figure 9. Transcriptional profiles of human undifferentiated pancreatic carcinomas are enriched for signatures of oncogenic signaling intensification and EMT but not for activation of TP63ΔN transcriptional network.
a, Primary pancreatic tumors from PK mice with a mesenchymal phenotype (C1 cluster, n=15) are almost exclusively classified as undifferentiated/sarcomatoid by histopathological evaluation and tend to have a reduced age at diagnosis when compared to epithelial (C2a/b/c cluster, n=18) tumors (histopathological grade 1 to 3 [G1-G3]). This aggressive behavior of undifferentiated pancreatic carcinoma is also observed in human patients and is associated with worse clinical outcome. P-value calculated by two-sided log-rank test. b, Comparison of publically available expression profiles of human undifferentiated pancreatic carcinoma (n=4), PDAC (WHO grade 1 to 3 [G1-G3], n=64) and adenosquamous pancreatic carcinoma (n=7). Human samples with the above histopathological characteristics for which expression-based subtype information from Bailey et al. was available were used and complemented with available undifferentiated pancreatic carcinomas from the ICGC PACA-AU cohort (Supplementary Table 18). Other histological subentities of pancreatic cancer were excluded (e.g. IPMN, MCN, acinar cell carcinoma). ANOVA was performed to select genes which are differentially expressed in at least one of the six defined subgroups of pancreatic cancer: (i) undifferentiated, (ii) adenosquamous pancreatic carcinoma and (iii-vi) PDAC (G1-G3) sub-stratified in pancreatic progenitor, immunogenic, squamous and aberrantly differentiated endocrine exocrine (ADEX) Bailey subtypes. Differentially regulated genes were used for unbiased hierarchical clustering of these pancreatic cancer transcriptional profiles. Five sub-clusters of co-regulated gene expression could be identified according to the cluster tree on the y-axis (separated by white horizontal bars in the heatmap). Gene set enrichment analysis using “Molecular Signatures Database” (MSigDB) was performed for individual sub-clusters and terms related to predominating gene sets/pathways are annotated for each cluster on the right (full list provided in Supplementary Table 17). Undifferentiated pancreatic carcinomas cluster together and are associated with (i) upregulation of genes in cluster 3 (containing MAPK signaling pathway and gene sets relevant during embryonic development or EMT) and (ii) downregulation of genes in clusters 2 and 5, which contain gene sets related to epithelial cell differentiation, embryonic development or metabolic signatures. This reflects the pathway enrichment signature in the equivalent undifferentiated (mesenchymal) mouse PDACs (cluster C1/"M" in PK mice; see Extended Data Figure 7g) and provides further support for the link between KRAS signaling intensification, EMT and the undifferentiated tumor phenotype. The immunogenic PDAC subtype showed high expression of cluster 4 genes, which was also strong (even elevated) in undifferentiated pancreatic carcinomas, suggesting an increased immune cell infiltration in undifferentiated carcinomas. Cluster 1 contained gene sets related to cell proliferation/cell cycle, squamous differentiation and TP63ΔN transcriptional targets, which were most highly overexpressed in pancreatic carcinomas with adenosquamous histology. Undifferentiated pancreatic carcinomas did not show activation of the TP63ΔN transcriptional targets. This suggests that activation of TP63ΔN transcriptional targets is not causally linked to KRAS signaling intensification and EMT (see also Extended Data Figure 9c-d, showing a lack of association of undifferentiated carcinomas withTP63ΔN transcriptional network activation). c, Unbiased hierarchical clustering of human pancreatic carcinomas with adenosquamous histology (n=7) as well as PDACs (WHO grade 1 to 3 [G1-G3], n=64) and undifferentiated pancreatic carcinomas (n=4) (sample set as in Extended Data Figure 9b) using a list of validated TP63ΔN transcriptional targets. Pancreatic cancers with adenosquamous differentiation were significantly enriched in a cluster showing increased TP63ΔN transcriptional network activity (P≤0.001, two-sided Fisher’s exact test, OR 130, 95% CI 11.6-1452). Undifferentiated pancreatic carcinomas did not contribute to this cluster. In line, pancreatic cancers from PK mice did not show differential regulation of the TP63ΔN network, reflecting the lack of adenosquamous tumors in this cohort (not shown). d, Unbiased hierarchical clustering across solid cancers (Cancer Cell Line Encyclopedia, n=856) using the same gene list showed a strong enrichment of tumors with squamous differentiation in the sub-cluster with highest TP63ΔN transcriptional network expression (P≤0.001, two-sided Fisher’s exact test, OR 28.1, 95% CI 16.4-48.1), in line with the observation of Hoadley et al. that TP63ΔN is a signature for squamous differentiation across cancers.
Extended Data Figure 10
Extended Data Figure 10. KrasG12D-gene dosage is a critical determinant of PDAC biology in a mouse model with high mutational load.
The mutational burden in primary PDAC cultures of PK mice was significantly lower as compared to human PDAC studies (see Fig. 1b). To account for this potential confounding factor and to test if our discoveries in PK mice also apply in a setting of high mutational burden, we used a mouse model combining KrasG12D mutation and PiggyBac transposon-based insertional mutagenesis (PK-PB mice13). PK-PB mice show accelerated tumorigenesis as compared to PK mice. PK-PB derived tumors had an extensive mutational burden (median of 494 transposon insertions per tumor). Primary cultures of PDAC from PK-PB mice (n=17) were subjected to comprehensive genetic characterization using aCGH, microarray-based gene expression profiling, quantitative transposon insertion site sequencing (QiSeq) and amplicon-based deep sequencing of the Kras locus. a, Transcriptome profiles of primary PDAC cultures from PK-PB mice (n=17) were used for unbiased hierarchical clustering that resulted in 2 major clusters (C1 and C2), like in PK mice. KrasG12D gene dosage status (as determined by aCGH and amplicon-based deep sequencing of the Kras locus) and Cdkn2a status (as determined by aCGH and quantitative transposon insertion site sequencing [QiSeq]) are indicated below the cluster tree for each individual tumor. Similarly to PK mice, cluster C2a was characterized by KrasG12D-HET and Cdkn2a/NcrucΔHET/WT status, whereas mPDACs in clusters C2b/c and C1 had increased KrasG12D gene dosage (KrasG12D-iGD) and were Cdkn2a/NcrucΔHOM. The genetic KrasG12D-status was significantly associated with expression clusters (P=0.01, two-sided Fisher’s exact test) providing further evidence that expression clusters are associated with KrasG12D gene dosage. b, Prevalence of KrasG12D-iGD in cultures of primary mPDAC (from PK-PB mice) with homozygous (n=12) or heterozygous/wild-type (n=5) Cdkn2a/Ncruc status. *P=0.03, two-sided Fisher’s exact test, OR 20.0, 95% CI 1.4-287.8. c, Gene set enrichment analysis using DAVID of upregulated genes in cluster C1 (n=5) as compared to cluster C2 (n=12) of primary mPDAC cultures from PK-PB mice. As in PK mice, PK-PB tumors in C1 are characterized by upregulation of genes enriched in gene sets describing mesenchymal cell differentiation and revealed a strong enrichment for Ras downstream signaling pathways (full list in Supplementary Table 19). FDR-adjusted P-values are shown on y axis. Overall, these analyses show that the biological principles discovered in the PK model also apply to pancreatic cancers from PK-PB mice with high mutational load.
Figure 1
Figure 1. Genetic landscape of mouse PDAC and comparison to the human disease.
a, Trinucleotide context-dependent SNV frequencies in mouse (n=38 PK mice) and human PDAC (n=51 patients from6) derived from WES. b, SNV, indel, CNA and translocation burdens by WES, aCGH and M-FISH in PK mice (n=38) and human PDAC (n=51 patients for SNV, indel, CNA [data from6] and n=24 cell lines for translocations). **P=0.002, ***P≤0.001, two-sided Mann-Whitney test; bars, median. c, CNAs, ploidy and translocations in PK mice (n=38), detected by aCGH and M-FISH. Mixed ploidy, n≥3 diploid/tetraploid cells in 10 karyotypes. d, Rearrangement graph showing chr4 chromothripsis in mPDAC S821, based on WGS. Haplotype-specific chromosome content loss confirmed by M-FISH (n=10/10 karyotypes). e, Age at tumor diagnosis of mice having cancers with (n=14) or without (n=23) complex/clustered chromosomal rearrangements (n≥10 CNAs/chromosome). Two-sided log-rank test.
Figure 2
Figure 2. Mutant KRAS gene dosage increase occurs early in PDAC evolution and drives metastasis.
a, KrasG12D gene dosage “states” defined by aCGH, WES and M-FISH (n=38 PK mice). Exemplary CNV-plot for each “state” on the right, y-axis, copy number b, Allele-specific KrasG12D mRNA expression in KrasG12D-iGD (n=26 mice) and KrasG12D-HET mPDACs (n=12 mice) by combined amplicon-based RNA-Seq and qRT-PCR. *P=0.02, two-sided Mann-Whitney test; bars, median. c, Codon-12 variant allele frequency of microdissected KRASG12 mutant hPanIN (n=20) by amplicon-based deep sequencing. H&E stains show histopathologic stages of microdissected hPanINs. Scale bars, 50 µm. d, Macro-/micro-metastasis prevalence in KrasG12D-HET (n=12) vs. KrasG12D-iGD (n=26) mPDACs. (***P=0.001, two-sided Fisher’s exact test). Liver metastasis, H&E. Scale bars, 150 µm (top) and 50 µm (bottom); square, zoom-in area. e, KrasG12D-HET mPDAC amplify alternative oncogenes (Myc, Nfkb2 or Yap1) to intensify partial aspects of Ras downstream signaling. Focal, focal amplification; Arm, arm-level amplification. f, Amplification of MYC, NFKB2 or YAP1 in KRASMUT human PDAC. Note, these amplified genes can not only collaborate with KRASMUT-Het but also with KRASMUT-iGD. Data from.
Figure 3
Figure 3. Cdkn2a alteration “states” dictate distinct evolutionary PDAC trajectories.
a, Chr4 alteration types involving Cdkn2a by aCGH/M-FISH (n=38 PK mice). Complex rearrangements, n≥10 CNAs/chromosome. Examplary CNV plots on the right; y-axis, copy number. b, Translocations affecting chr4/Cdkn2a in mPDAC-R1035 by M-FISH (10/10 karyotypes). c, Prevalence of KrasG12D-iGD in mPDAC with homozygously (ΔHOM, n=27) vs. wild-type/heterozygously (ΔHET/WT, n=11) deleted Cdkn2a/Ncruc. ***P=0.001, two-sided Fisher’s exact test, OR 15.3, 95% CI 2.8-83.9. d, KRAS variant allele frequencies in human PDAC with wild-type/heterozygously (n=56) vs. homozygously deleted (n=38) CDKN2A. Data from. ***P≤0.001, two-sided Mann-Whitney test; bars, median. e, Sequential order of Cdkn2a and KrasG12D alterations. Chr4 and chr6 CNA/LOH patterns (based on aCGH,WES) of primary mPDACs (n=13 PK mice) and associated metastases (n=25). For seven mPDACs and 16 associated metastases the order of genetic events (dots) could be reconstructed. Bifurcations, divergent evolution of clones; lines, lengths do not represent evolutionary distances; P, primary tumor; Li/Lu/LN, liver/lung/lymph node metastasis. f, Detailed chr4/chr6 CNV/LOH profiles for mPDAC5320 primary/metastases. Cdkn2a deletions are identical in all lesions (y-axis, copy number). SNP frequency analysis by WES shows distinct chr6 SNP patterns in metastases and a composite picture in the primary, showing convergent evolution of different KrasG12D-iGD-gains upon Cdkn2aΔHOM. Scheme, combined interpretation of WES/aCGH data.
Figure 4
Figure 4. Defined allelic states and/or combinations of hallmark PDAC tumor-suppressor alterations license oncogenic dosage variation.
Types and frequencies of KrasG12D gene dosage gains and Cdkn2a inactivations, defined by aCGH and amplicon-based KrasG12D sequencing in PDAC mouse models expressing pancreas-specific KrasG12D alone (PK) or in combination with engineered Cdkn2aΔHOM (PKC), Trp53ΔHOM (PKP) or Tgfbr2ΔHET/HOM (PKT) inactivation.
Figure 5
Figure 5. Integrative analyses of PDAC genomics, transcriptomics, cellular phenotypes and histopathologies link molecular, morphologic and clinical disease characteristics.
a, Unbiased hierarchical clustering of primary mPDAC culture transcriptomes (PK mice). Cell morphology, histopathological grading, KrasG12D mRNA expression, genetic KrasG12D status and presence/absence of metastasis integrated below. b, Selected gene sets from gene-set enrichment analysis of clusters C2 vs. C1. (full list in Supplementary Table 13,14). c, mPDAC cultures with mesenchymal/epithelial morphology from clusters C1/C2, respectively. 100x magnification; squares, zoom-in area. d, KrasG12D-allele-specific mRNA levels in mPDAC transcriptional clusters, combined amplicon-based RNA-Seq and qRT-PCR (C2a/b/c/C1, n=5/7/6/15 mice). P=1.9*10-6, two-sided Pearson correlation; bars, median. e, CRISPR/Cas9-mediated multiplexed somatic inactivation of PDAC-relevant tumor suppressors by electroporation-based transfection to achieve low-frequency mosaicism and clonal tumor outgrowth. Differential trypsinization separates epithelial/mesenchymal cells in mPDACs with mixed morphologies (100x magnification; squares, zoom-in area). CRISPR/Cas9-induced indel signatures are identical in epithelial/mesenchymal pairs (Extended data Fig. 8), indicating common cell of origin. Total Kras mRNA levels in epithelial/mesenchymal pairs (qRT-PCR, normalized to Gapdh, n=2 technical replicates). Bars, mean; error bars, SEM. f, mPDAC histophathological grading in transcriptional clusters (C2a/b/c/C1, n=4/7/6/15, single section per mPDAC). Representative sections (H&E) shown. *Benjamini-Hochberg-adj. P≤0.05, **P=0.005; two-sided Fisher’s exact test; scale bars, 150µm. g, Simplified model of PDAC evolution reconciling molecular, morphologic and clinical disease characteristics. KRASG12D-iGD gain or alternative oncogenic amplifications (Myc/Yap1/Nfkb2) are critical for early disease progression. Different oncogenic gains and dosages evolve along distinct evolutionary routes, licensed by defined allelic states (heterozygous/homozygous) and/or combinations of hallmark tumor-suppressor alterations. For simplicity, only the prototype tumor suppressor gene CDKN2A is shown. Not visualized: TP53ΔHOM loss, also promoting KRASMUT-iGD, or TGFBR2ΔHET/HOM inactivation, supporting evolution through CDKN2AHET/KRASMUT-HET trajectories. Depicted alternative trajectories are typical, but not completely exclusive, e.g. MYC or NFKB2 amplifications, which drive KRASMUT-HET cancers, can also cooperate with KRASMUT-iGD. Major aspects of a cancer´s biology/phenotype are linked to differential evolution.

Comment in

References

    1. Rahib L, et al. Projecting cancer incidence and deaths to 2030: the unexpected burden of thyroid, liver, and pancreas cancers in the United States. Cancer Res. 2014;74:2913–2921. doi: 10.1158/0008-5472.CAN-14-0155. - DOI - PubMed
    1. Jones S, et al. Core signaling pathways in human pancreatic cancers revealed by global genomic analyses. Science. 2008;321:1801–1806. doi: 10.1126/science.1164368. - DOI - PMC - PubMed
    1. Campbell PJ, et al. The patterns and dynamics of genomic instability in metastatic pancreatic cancer. Nature. 2010;467:1109–1113. doi: 10.1038/nature09460. - DOI - PMC - PubMed
    1. Biankin AV, et al. Pancreatic cancer genomes reveal aberrations in axon guidance pathway genes. Nature. 2012;491:399–405. doi: 10.1038/nature11547. - DOI - PMC - PubMed
    1. Waddell N, et al. Whole genomes redefine the mutational landscape of pancreatic cancer. Nature. 2015;518:495–501. doi: 10.1038/nature14169. - DOI - PMC - PubMed

Publication types

MeSH terms