. 2018 Jan 24;13(1):e0190791.
doi: 10.1371/journal.pone.0190791. eCollection 2018.

Testing spatial heterogeneity with stock assessment models

Affiliations

Testing spatial heterogeneity with stock assessment models

Ernesto Jardim et al. PLoS One. .

Abstract

This paper describes a methodology that combines meta-population theory and stock assessment models to gain insights about spatial heterogeneity of the meta-population in an operational time frame. The methodology was tested with stochastic simulations for different degrees of connectivity between sub-populations and applied to two case studies, North Sea cod (Gadus morua) and Northeast Atlantic sardine (Sardina pilchardus). Considering that the biological components of a population can be partitioned into discrete spatial units, we extended this idea into a property of additivity of sub-population abundances. If the additivity results hold true for putative sub-populations, then assessment results based on sub-populations will provide information to develop and monitor the implementation of finer scale/local management. The simulation study confirmed that when sub-populations are independent and not too heterogeneous with regards to productivity, the sum of stock assessment model estimates of sub-populations' SSB is similar to the SSB estimates of the meta-population. It also showed that a strong diffusion process can be detected and that the stronger the connection between SSB and recruitment, the better the diffusion process will be detected. On the other hand it showed that weak to moderate diffusion processes are not easy to identify and large differences between sub-populations productivities may be confounded with weak diffusion processes. The application to North Sea cod and Atlantic sardine exemplified how much insight can be gained. In both cases the results obtained were sufficiently robust to support the regional analysis.


Conflict of interest statement

Competing Interests: The authors have declared that no competing interests exist.

Figures

Fig 1
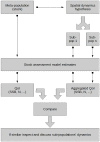
Fig 1. Method’s workflow.
From top to bottom, the meta-population is broken down into subpopulations based on a spatial dynamics hypothesis; stock assessment models are fitted and quantities of interest (QoI) derived for the meta-population and the sub-populations; the QoIs of the two scenarios are compared and if considered similar the analysis proceeds with the inspection and discussion of the sub-populations’ dynamics.
Fig 2
Fig 2. North Sea cod meta-population distribution area and sub-populations.
The areas used to split the meta-population into putative sub-populations: Southern (mid gray), Northwestern (dark gray) and Viking (light gray).
Fig 3
Fig 3. Northeast Atlantic sardine meta-population distribution area and sub-populations.
The areas used to split the meta-population into putative sub-populations: Bay of Biscay sub-population (purple), Northwest sub-population (blue) and South sub-population (green). Ellipses refer to persistent recruitment hot spots. Arrows refer to potential migration paths between sub-populations.
Fig 4
Fig 4. Simulation study results based on the spawning stock biomass (SSB) root median square deviation (RMSD, Eq 3).
The top row shows results for the case based on North Sea cod dynamics, the bottom row for the Northeast Atlantic sardine. The left column refers to RMSD as a function of the diffusion level and the central column as a function of stock’s productivity (average steepness), for dependent sub-populations (OM D). The light gray lines are smoothers fitted to each diffusion level to help visualization. These results are presented relative to the 0.7 average steepness and for each diffusion level (legend in the plot). Levels of 0.5 − 0.5 refer to a weak diffusion, where the population has the same age distribution in both sub-populations, while a value of 0.0 − 1.0 refers to the strongest diffusion process, where all recruits are in one area and all adults in another area. The right column shows RMSD as a function of productivity differences between independent sub-populations (OM I).
Fig 5
Fig 5. Estimates of spawning stock biomass (SSB) for North Sea cod.
The left top figure refers to spawning stock biomass and the left bottom to recruitment. In both cases points show the median values and vertical lines represent 95% confidence intervals. The right panel shows the stock recruitment plot and model fits, to the meta-population and each sub-population.
Fig 6
Fig 6. Fishing mortality surface.
Fitted to the North Sea cod meta-population and each of the three sub-populations.
Fig 7
Fig 7. Estimates of spawning stock biomass (SSB) for the Northeast Atlantic sardine.
The left top figure refers to spawning stock biomass and the left bottom to recruitment. In both cases points show the median values and vertical lines represent 95% confidence intervals. The right panel shows the stock recruitment plot and model fits, to the meta-population and each sub-population.
Fig 8
Fig 8. Fishing mortality surface.
Fitted to the Iberian sardine meta-population and each of the three sub-populations.

References

    1. Beverton RJH, Holt SJ. On the Dynamics of Exploitated Fish Populations. The Blackburn Press; 1957.
    1. Hilborn R, Walters CJ. Quantitative Fisheries Stock Assessment. Choice, Dynamics & Uncertainty. Kluwer Academic Publishers; 1992.
    1. Quinn TJ, Deriso RB. Quantitative Fish Dynamics. Oxford University Press; 1999.
    1. Jennings S, Kaiser MJ, Reynolds JD. Marine Fisheries Ecology. Blakwell Publishing; 2001.
    1. Haddon M. Modelling and Quantitative Methods in Fisheries. 2nd ed Chapman and Hall/CRC; 2011.

Publication types

LinkOut - more resources