

Towards the description of livestock mobility in Sahelian Africa: Some results from a survey in Mauritania
- PMID: 29364989
- PMCID: PMC5783398
- DOI: 10.1371/journal.pone.0191565
Towards the description of livestock mobility in Sahelian Africa: Some results from a survey in Mauritania
Abstract
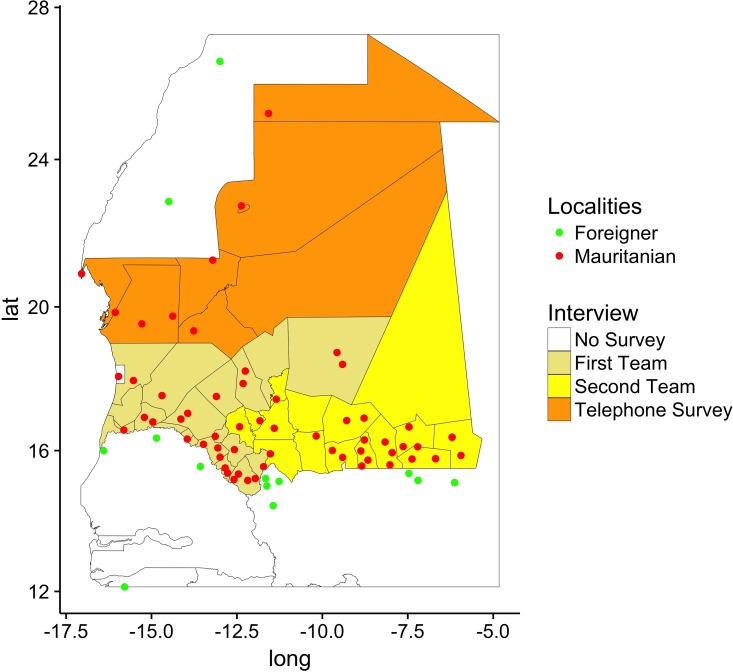
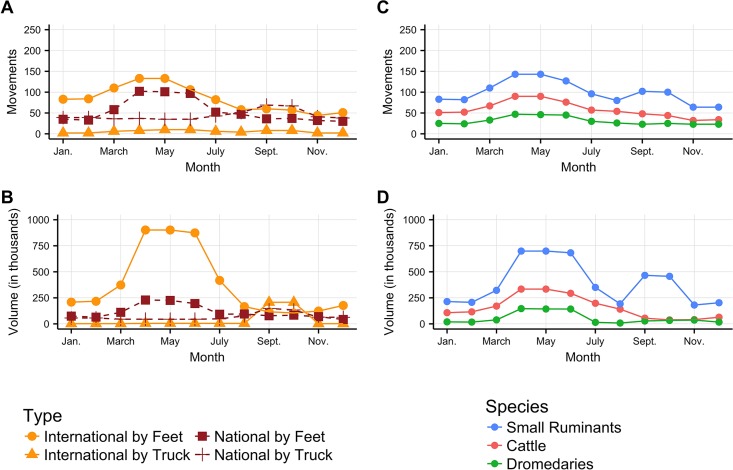
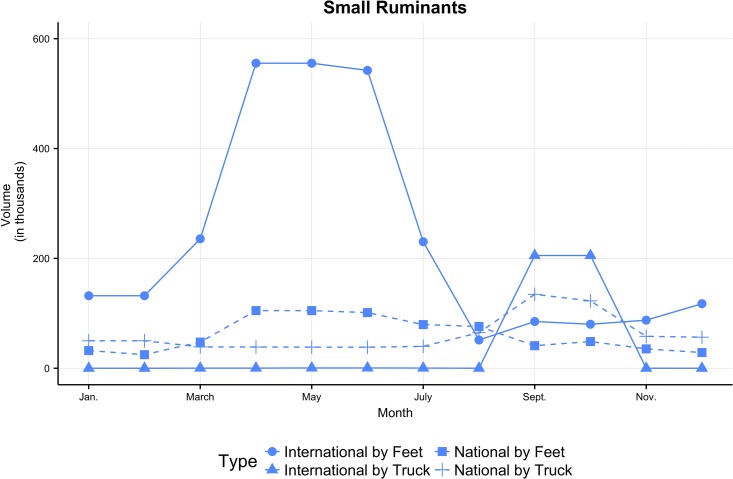
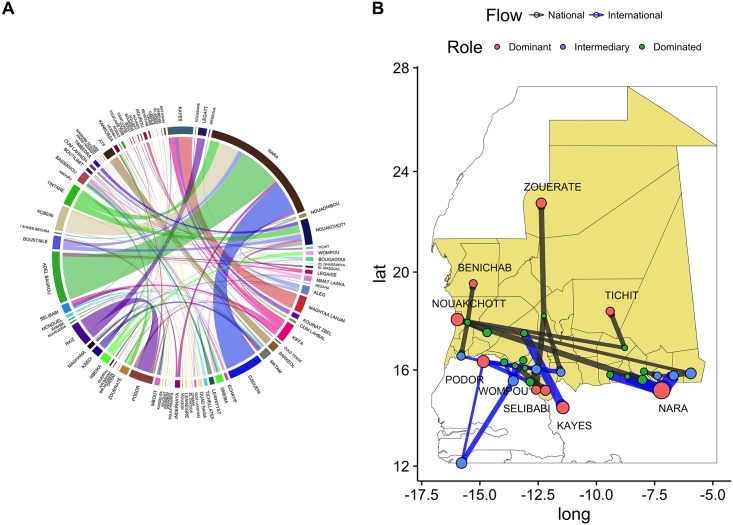
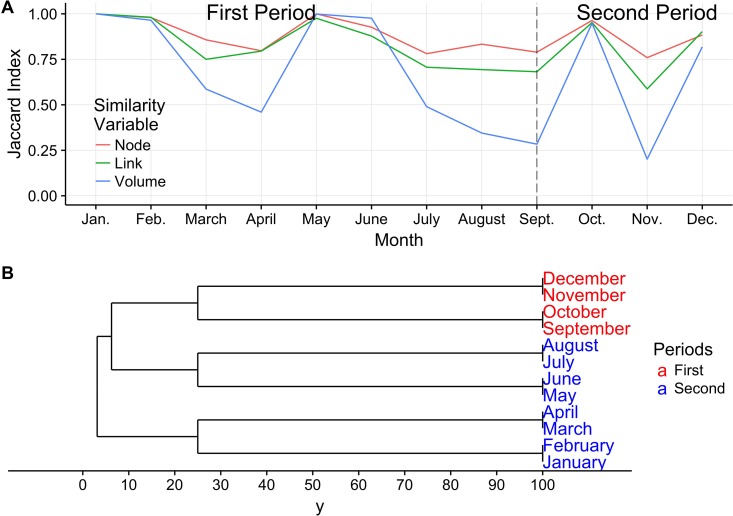
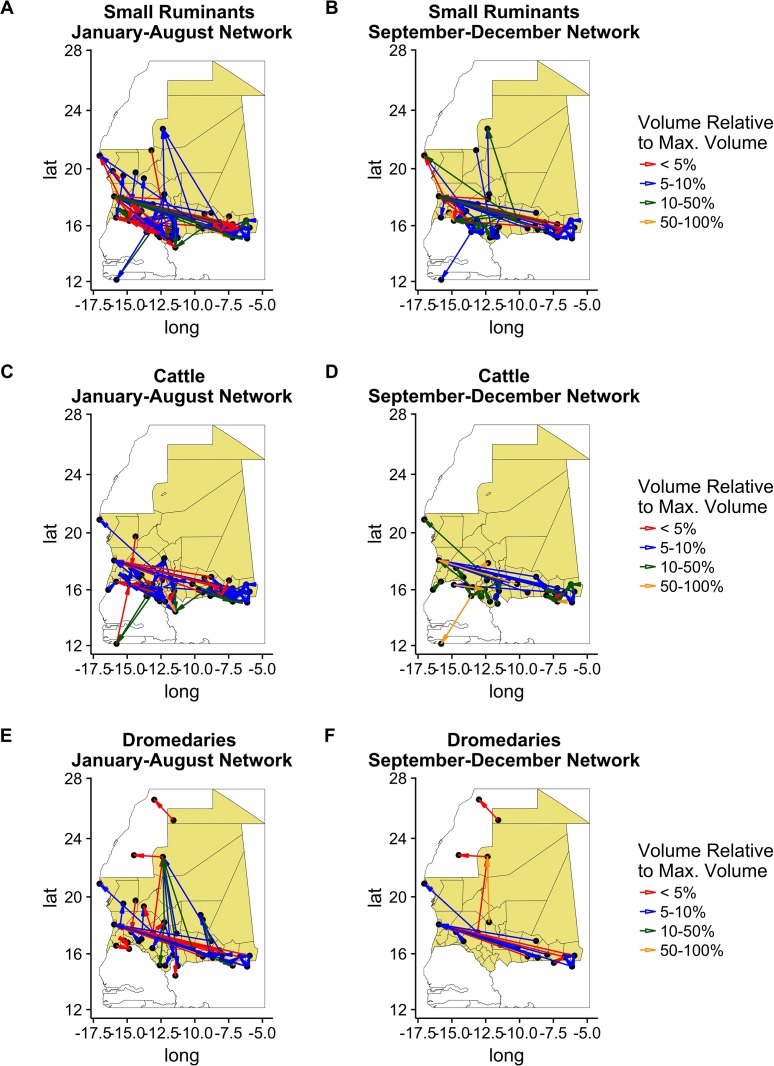
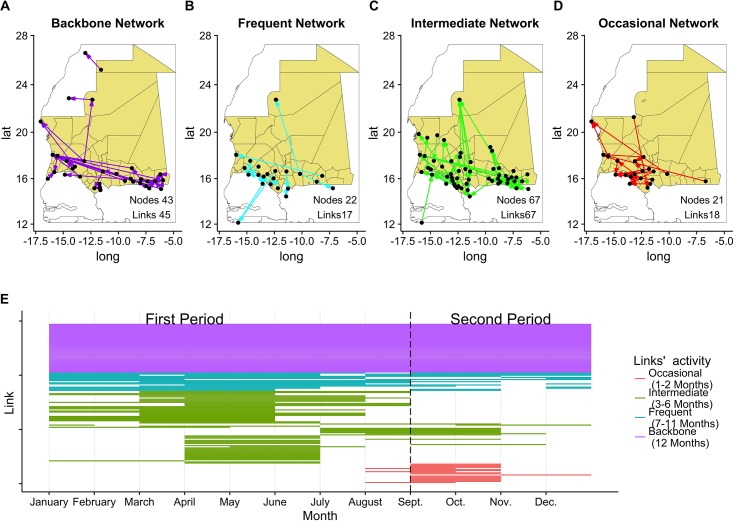
Understanding spatio-temporal patterns of host mobility is a key factor to prevent and control animal and human diseases. This is utterly important in low-income countries, where animal disease epidemics have strong socio-economic impacts. In this article we analyzed a livestock mobility database, whose data have been collected by the Centre National d'Elevage et de Recherches Vétérinaires (CNERV) Mauritania, to describe its patterns and temporal evolution. Data were collected through phone and face-to-face interviews in almost all the regions in Mauritania over a period of roughly two weeks during June 2015. The analysis has shown the existence of two mobility patterns throughout the year: the first related to routine movements from January to August; the second strictly connected to the religious festivity of Tabaski that in 2014 occurred at the beginning of October. These mobility patterns are different in terms of animals involved (fewer cattle and dromedaries are traded around Tabaski), the means of transportation (the volume of animals moved by truck raises around Tabaski) and destinations (most of the animals are traded nationally around Tabaski). Due to the differences between these two periods, public health officers, researchers and other stakeholders should take account of the time of the year when implementing vaccination campaigns or creating surveillance networks.
Conflict of interest statement
Figures
References
-
- Bajardi P, Barrat A, Savini L, Colizza V. Optimizing surveillance for livestock disease spreading through animal movements. Journal of The Royal Society Interface. 2012;9(76):2814–2825. doi: 10.1098/rsif.2012.0289 - DOI - PMC - PubMed
-
- Keeling MJ, Woolhouse MEJ, Shaw DJ, Matthews L, Chase-Topping M, Haydon DT, et al. Dynamics of the 2001 UK foot and mouth epidemic: Stochastic dispersal in a heterogeneous landscape. Science. 2001;294(5543):813–817. doi: 10.1126/science.1065973 - DOI - PubMed
-
- Kiss IZ, Green DM, Kao RR. The network of sheep movements within Great Britain: network properties and their implications for infectious disease spread. Journal of the Royal Society, Interface / the Royal Society. 2006;3(10):669–677. doi: 10.1098/rsif.2006.0129 - DOI - PMC - PubMed
-
- Kao RR, Danon L, Green DM, Kiss IZ. Demographic structure and pathogen dynamics on the network of livestock movements in Great Britain. Proc R Soc B. 2006;273(1597):1999–2007. doi: 10.1098/rspb.2006.3505 - DOI - PMC - PubMed
-
- Dutta BL, Ezanno P, Vergu E. Characteristics of the spatio-temporal network of cattle movements in France over a 5-year period. Preventive Veterinary Medicine. 2014;117(1):79–94. doi: 10.1016/j.prevetmed.2014.09.005 - DOI - PubMed
Publication types
MeSH terms
LinkOut - more resources
Full Text Sources
Other Literature Sources
