Case Reports
. 2018 Jul 1;110(7):787-790.
doi: 10.1093/jnci/djx277.

Immune-Active Microenvironment in Small Cell Carcinoma of the Ovary, Hypercalcemic Type: Rationale for Immune Checkpoint Blockade

Affiliations
Case Reports

Immune-Active Microenvironment in Small Cell Carcinoma of the Ovary, Hypercalcemic Type: Rationale for Immune Checkpoint Blockade

Petar Jelinic et al. J Natl Cancer Inst. .

Abstract

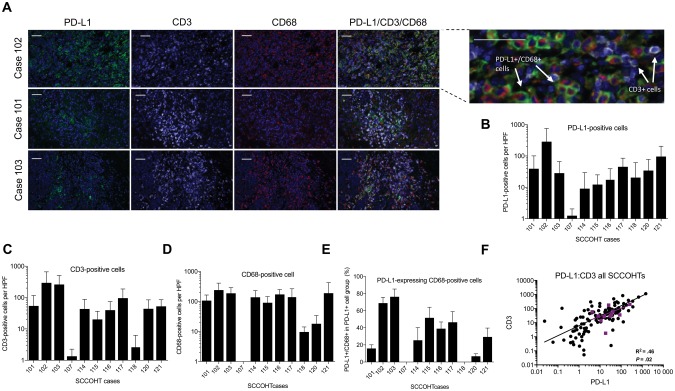
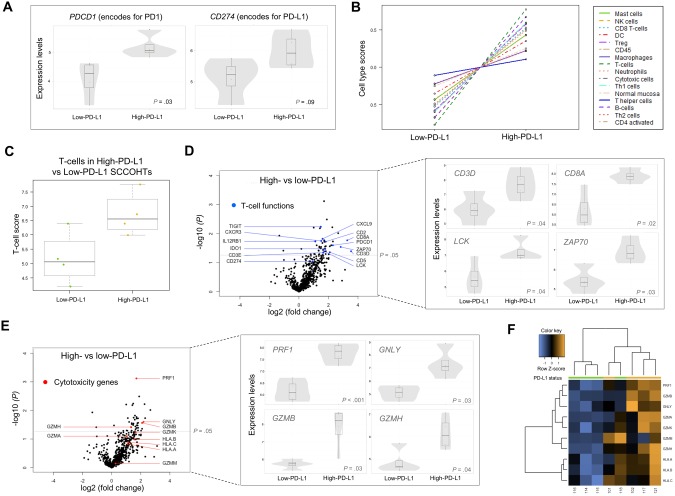
Small cell carcinoma of the ovary, hypercalcemic type (SCCOHT), is a highly aggressive monogenic cancer driven by SMARCA4 mutations. Here, we report responses to anti-PD1 immunotherapy in four patients and characterize the immune landscape of SCCOHT tumors using quantitative immunofluorescence and gene expression profiling. Unexpectedly for a low mutation burden cancer, the majority of the tumors (eight of 11 cases) demonstrated PD-L1 expression with strong associated T-cell infiltration (R2 = 0.60-0.95). PD-L1 expression was detected in both tumor and stromal cells, with macrophages being the most abundant PD-L1-positive cells in some tumors (three of 11 cases). Transcriptional profiling revealed increased expression of genes related to Th1 and cytotoxic cell function in PD-L1-high tumors, suggesting that PD-L1 acts as a pathway of adaptive immune resistance in SCCOHT. These findings suggest that although SCCOHT are low-mutational burden tumors, their immunogenic microenvironment resembles the landscape of tumors that respond well to treatment with PD-1/PD-L1 blockade.


Figures

Figure 1.
Figure 1.
Small cell carcinoma of the ovary, hypercalcemic type (SCCOHT), exhibit immune-active tumor microenvironment. A) Immunohistochemistry triple-staining with the PD-L1, CD3, and CD68 antibodies of three representative SCCOHT cases. Enlarged outset demonstrates merged triple-stain, showing overlap of PD-L1- and CD68-positive cells but not CD3-positive cells. Scale bars = 50 µm. B) PD-L1-positive, C) CD3-positive, and D) CD68-positive cell counts per high-power field (HPF). The y-axis indicates number of marker-positive cells, and the x-axis indicates SCCOHT cases. Error bars represent one SD per 10 HPFs. E) Percentage of CD68+ cells out of all PD-L1-expressing cells. The y-axis indicates percentage of PD-L1-expressing macrophages, and the x-axis indicates SCCOHT cases. Error bars represent one SD per 10 HPFs. F) Correlation of PD-L1 and CD3 expression in all SCCOHT cases. Each black dot represents an individual HPF. Each purple square represents the mean of 10 HPFs for each case, and Pearson correlation is shown for these cases. All statistical tests were two-sided. HPF = high-power field; SCCOHT = small cell carcinoma of the ovary, hypercalcemic type.
Figure 2.
Figure 2.
PD-L1 expression is associated with T cell-related gene expression in small cell carcinoma of the ovary, hypercalcemic type (SCCOHT). A) Normalized gene expression of PDCD1 (encoding for PD1) and CD274 (encoding for PD-L1) in the high-PD-L1 vs low-PD-L1 cases. Box plots superimposed on violin plots in figures (A), (D), and (E) represent differential gene expression. Boxplot center lines represent tumor medians, box limits are the interquartile range from 25% and 75%, and whiskers represent the extent of tumors out to 1.5 times the interquartile range. The gray shading of the violin plots represents the estimated distribution of the expression values. Dots represent individual cases. B) Relative abundance of specific cell types in high-PD-L1 vs low-PD-L1 cases. Cell type scores are mean centered based on deconvolution of cell type–specific gene sets. C) T-cell scores in the high-PD-L1 vs low-PD-L1 group. D and E) Volcano plots of differentially expressed genes showing the T-cell-related genes (blue dots) and cytotoxicity genes (red dots), respectively. Expression of representative genes are shown to the right of each plot. Statistically significant genes are shown above the dashed line on the volcano plots (P = .05), and individual genes are shown adjacent. F) Unsupervised clustering of cytotoxicity-related and MHC class I genes for high-PD-L1 and low-PD-L1 cases. PD-L1 group is indicated by the color bar at the top of the figure (green: low-PD-L1; orange: high-PD-L1). All P values were calculated using the Benjamini-Yekutieli method. All statistical tests were two-sided. MHC = major histocompatibility complex.

References

    1. Young RH, Oliva E, Scully RE.. Small cell carcinoma of the ovary, hypercalcemic type. A clinicopathological analysis of 150 cases. Am J Surg Pathol. 1994;1811:1102–1116.10.1097/00000478-199411000-00004 - DOI - PubMed
    1. Jelinic P, Mueller JJ, Olvera N et al. , . Recurrent SMARCA4 mutations in small cell carcinoma of the ovary. Nat Genet. 2014;465:424–426.10.1038/ng.2922 - DOI - PMC - PubMed
    1. Ramos P, Karnezis AN, Craig DW et al. , . Small cell carcinoma of the ovary, hypercalcemic type, displays frequent inactivating germline and somatic mutations in SMARCA4. Nat Genet. 2014;465:427–429.10.1038/ng.2928 - DOI - PMC - PubMed
    1. Witkowski L, Carrot-Zhang J, Albrecht S et al. , . Germline and somatic SMARCA4 mutations characterize small cell carcinoma of the ovary, hypercalcemic type. Nat Genet. 2014;465:438–443.10.1038/ng.2931 - DOI - PubMed
    1. Jelinic P, Schlappe BA, Conlon N et al. , . Concomitant loss of SMARCA2 and SMARCA4 expression in small cell carcinoma of the ovary, hypercalcemic type. Mod Pathol. 2016;291:60–66.10.1038/modpathol.2015.129 - DOI - PMC - PubMed

Publication types

MeSH terms