. 2018 Jan 23;2(2):126-141.
doi: 10.1182/bloodadvances.2017011072.

Immune rebound associates with a favorable clinical response to autologous HSCT in systemic sclerosis patients

Affiliations

Immune rebound associates with a favorable clinical response to autologous HSCT in systemic sclerosis patients

Lucas C M Arruda et al. Blood Adv. .

Abstract

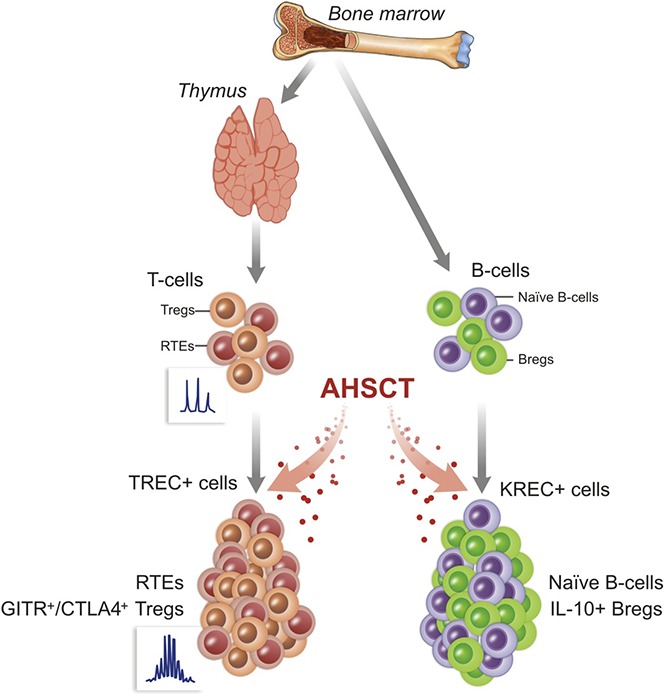
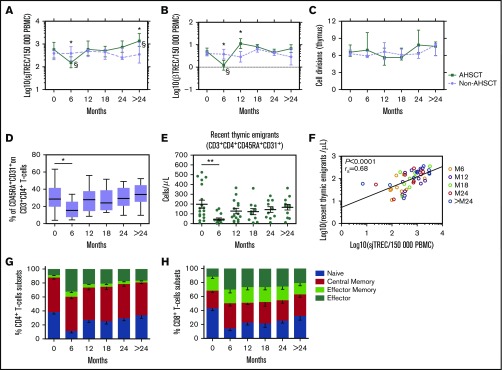
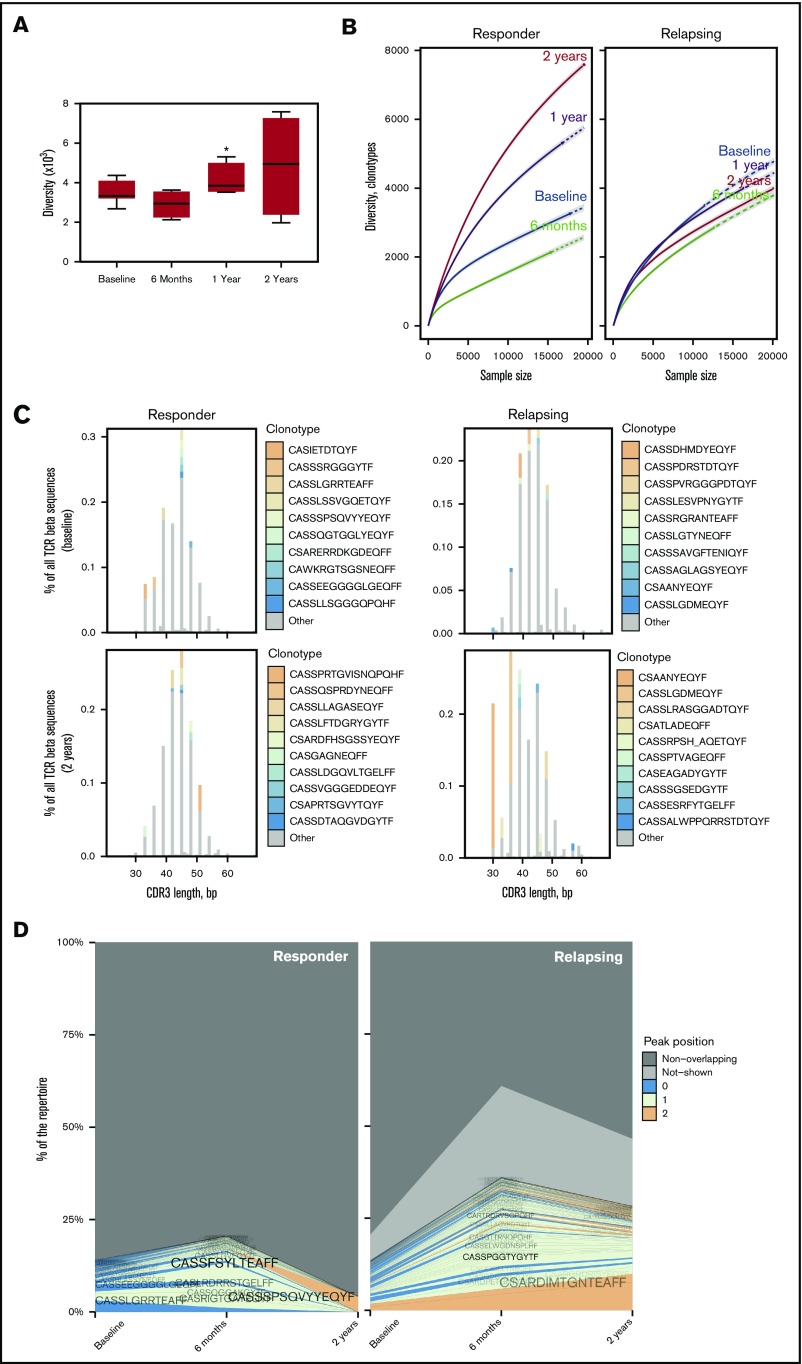
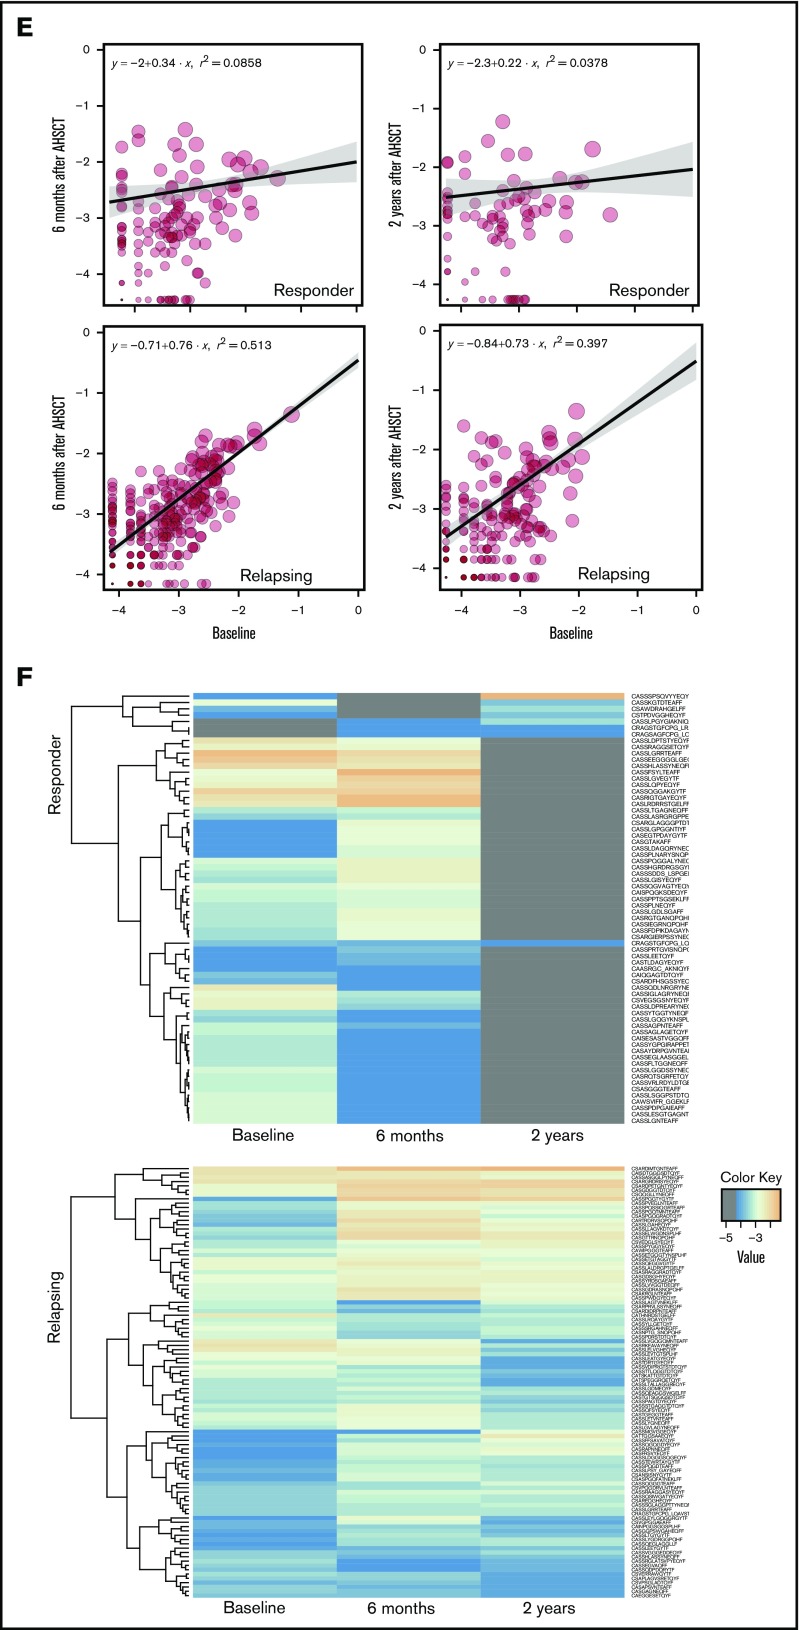
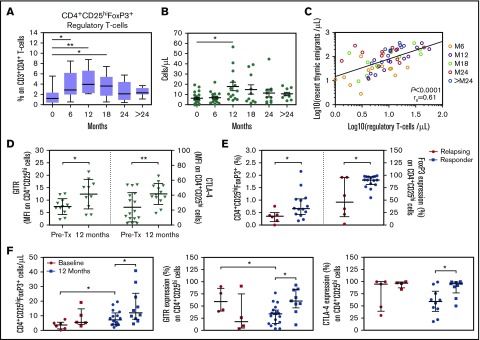
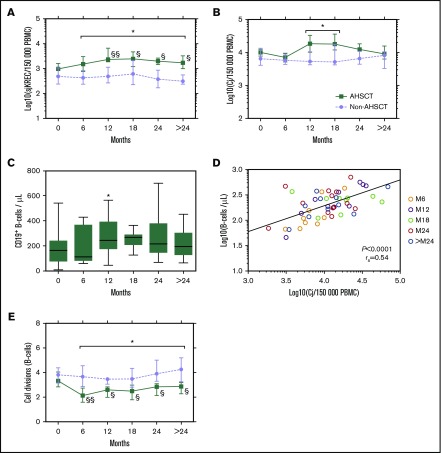
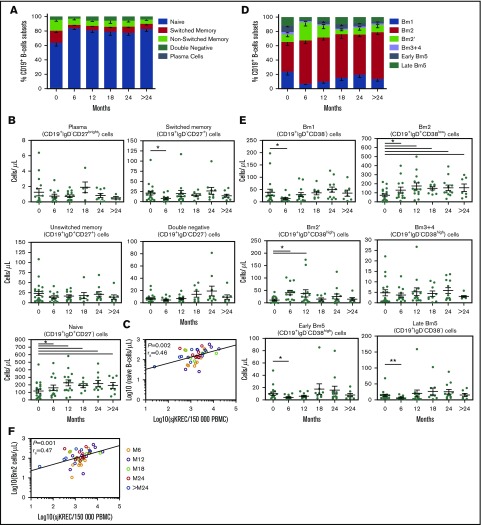
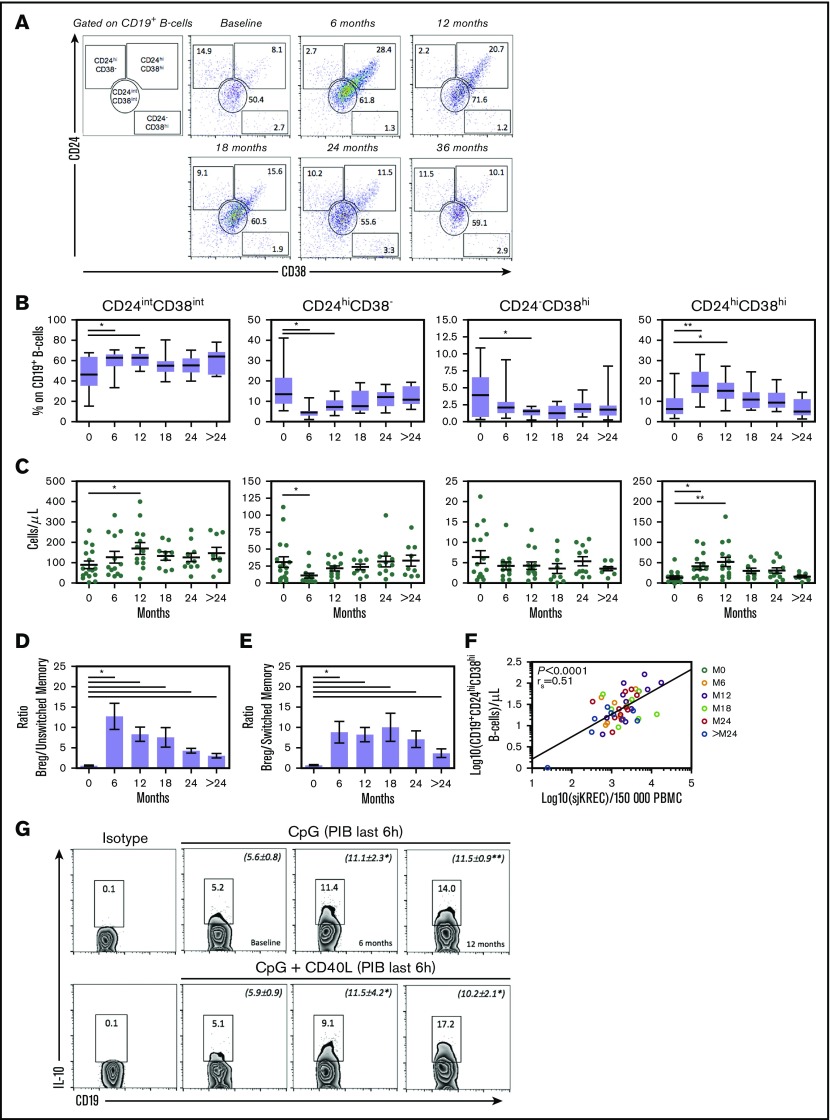
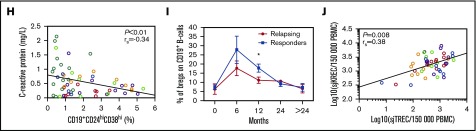
To evaluate the immunological mechanisms associated with clinical outcomes after autologous hematopoietic stem cell transplantation (AHSCT), focusing on regulatory T- (Treg) and B- (Breg) cell immune reconstitution, 31 systemic sclerosis (SSc) patients underwent simultaneous clinical and immunological evaluations over 36-month posttransplantation follow-up. Patients were retrospectively grouped into responders (n = 25) and nonresponders (n = 6), according to clinical response after AHSCT. Thymic function and B-cell neogenesis were respectively assessed by quantification of DNA excision circles generated during T- and B-cell receptor rearrangements. At the 1-year post-AHSCT evaluation of the total set of transplanted SSc patients, thymic rebound led to renewal of the immune system, with higher T-cell receptor (TCR) diversity, positive correlation between recent thymic emigrant and Treg counts, and higher expression of CTLA-4 and GITR on Tregs, when compared with pretransplant levels. In parallel, increased bone marrow output of newly generated naive B-cells, starting at 6 months after AHSCT, renovated the B-cell populations in peripheral blood. At 6 and 12 months after AHSCT, Bregs increased and produced higher interleukin-10 levels than before transplant. When the nonresponder patients were evaluated separately, Treg and Breg counts did not increase after AHSCT, and high TCR repertoire overlap between pre- and posttransplant periods indicated maintenance of underlying disease mechanisms. These data suggest that clinical improvement of SSc patients is related to increased counts of newly generated Tregs and Bregs after AHSCT as a result of coordinated thymic and bone marrow rebound.


Conflict of interest statement

Conflict-of-interest disclosure: The authors declare no competing financial interests.

Figures

None
Graphical abstract
Figure 1.
Figure 1.
Exportation of thymic-derived newly generated naive T cells correlates with posttransplantation thymic recovery. Median (± IQR) of (A) sjTREC and (B) βTREC values as measured by quantitative RT-PCR analysis on PBMC genomic DNA at baseline (0 months, pretransplant) and at the following time points in transplanted (AHSCT, n = 26 patients at baseline, n = 15 at 6 and 12 months, and n = 11 at 18, 24, and >24 months) and nontransplanted (non-AHSCT, n = 14 patients at baseline and at 6 months, n = 13 at 12 months, and n = 8 at 18, 24, and >24 months) SSc patients. The results were expressed by log10 in 150 000 PBMCs. (C) Intrathymic T-cell division (n) as calculated using following formula: n = LOG(sjTREC/βTREC)/LOG2. *P < .05, AHSCT vs non-AHSCT (Mann-Whitney U test). §P < .05, §§P < .01 comparing posttransplant values to baseline (Wilcoxon’s). Panels D-H include transplanted patients only. (D) Percentage of CD45RA and CD31 coexpression by CD3+CD4+ T cells immunophenotyped by flow cytometry. The boundaries of the boxes indicate the 25th and 75th percentiles; the lines within the boxes indicate the median, and the whiskers mark the 10th and the 90th percentiles. (E) Mean (± SE) of RTEs absolute values (cells per microliter). *P < .05; **P < .01 comparing posttransplant values to baseline (Wilcoxon’s). (F) Correlation between absolute values of CD3+CD4+CD31+CD45+ T cells and sjTREC values (Spearman’s). Mean (± SE) percentage of Naive (CD27+CD45RO), Central Memory (CD27+CD45RO+), Effector Memory (CD27-CD45RO+), and Effector (CD27CD45RO) (G) CD4+ and (H) CD8+ T cells.
Figure 2.
Figure 2.
Low clonotype overlap and high TCR diversity are related to favorable clinical response to AHSCT. (A) Comparisons of the observed TCR repertoire diversity based on unique clonotypes (n = 8 transplanted SSc patients at baseline, n = 5 at 6 months, n = 4 at 12 months, and n = 5 at 24 months). The boundaries of the boxes indicate the 25th and 75th percentiles; the lines within the boxes indicate the median, and the whiskers mark the 10th and the 90th percentiles. *P < .05 comparing posttransplant values with baseline (Wilcoxon’s). (B) Rarefaction analysis of repertoire samples from a representative responder (patient P6, left) and nonresponder (patient P5, right) patient. Number of unique clonotypes in a subsample is plotted against its size (number of TCR cDNA molecules). Solid and dashed lines mark interpolated and extrapolated regions of rarefaction curves, respectively, and points mark exact sample size and diversity. Shaded areas mark 95% confidence intervals. (C) Representative spectratype profile of a responder (patient P8, left) and nonresponder (patient P3, right) patient at baseline (upper panels) and at 2 years after AHSCT (lower panels). Panels display distribution of clonotype frequency by CDR3 length. Most abundant clonotypes are explicitly shown. The nonresponder patient did not achieve a Gaussian distribution even at later periods after transplant. (D) Clonotype tracking stackplot shows details for highly frequent clonotypes shared between baseline and posttransplant time points. Overlapping clonotype shows average frequencies of a responder (patient P6, left) and a nonresponder (patient P5, right) patient. Clonotypes are colored by the peak position of their abundance profile. Other low-frequency clonotypes that were observed in both samples are marked as “Not-shown” and the remaining clonotypes are marked as “Non-overlapping.” (E) Representative joint clonotype abundance scatter plot of a responder (patient P1, upper panels) and nonresponder (patient P5, lower panels) SSc patient, showing the overlap between baseline and 6 months (left panels) as well as between baseline and 2 years (right panels). The main frame contains a scatter plot of clonotype abundances (overlapping clonotypes only) and a linear regression. Point size is scaled to the geometric mean of clonotype frequency in both samples. Scatter plot axes represent log10 clonotype frequencies in each sample. R2 represents squared Pearson’s correlation coefficient. (F) Clonotype tracking heat map of a responder (patient P6, left) and nonresponder (patient P5, right) patient showing joint clonotype abundances. For the responder patients, the most frequent clonotypes at baseline disappear at 2 years posttransplant.
Figure 2.
Figure 2.
Low clonotype overlap and high TCR diversity are related to favorable clinical response to AHSCT. (A) Comparisons of the observed TCR repertoire diversity based on unique clonotypes (n = 8 transplanted SSc patients at baseline, n = 5 at 6 months, n = 4 at 12 months, and n = 5 at 24 months). The boundaries of the boxes indicate the 25th and 75th percentiles; the lines within the boxes indicate the median, and the whiskers mark the 10th and the 90th percentiles. *P < .05 comparing posttransplant values with baseline (Wilcoxon’s). (B) Rarefaction analysis of repertoire samples from a representative responder (patient P6, left) and nonresponder (patient P5, right) patient. Number of unique clonotypes in a subsample is plotted against its size (number of TCR cDNA molecules). Solid and dashed lines mark interpolated and extrapolated regions of rarefaction curves, respectively, and points mark exact sample size and diversity. Shaded areas mark 95% confidence intervals. (C) Representative spectratype profile of a responder (patient P8, left) and nonresponder (patient P3, right) patient at baseline (upper panels) and at 2 years after AHSCT (lower panels). Panels display distribution of clonotype frequency by CDR3 length. Most abundant clonotypes are explicitly shown. The nonresponder patient did not achieve a Gaussian distribution even at later periods after transplant. (D) Clonotype tracking stackplot shows details for highly frequent clonotypes shared between baseline and posttransplant time points. Overlapping clonotype shows average frequencies of a responder (patient P6, left) and a nonresponder (patient P5, right) patient. Clonotypes are colored by the peak position of their abundance profile. Other low-frequency clonotypes that were observed in both samples are marked as “Not-shown” and the remaining clonotypes are marked as “Non-overlapping.” (E) Representative joint clonotype abundance scatter plot of a responder (patient P1, upper panels) and nonresponder (patient P5, lower panels) SSc patient, showing the overlap between baseline and 6 months (left panels) as well as between baseline and 2 years (right panels). The main frame contains a scatter plot of clonotype abundances (overlapping clonotypes only) and a linear regression. Point size is scaled to the geometric mean of clonotype frequency in both samples. Scatter plot axes represent log10 clonotype frequencies in each sample. R2 represents squared Pearson’s correlation coefficient. (F) Clonotype tracking heat map of a responder (patient P6, left) and nonresponder (patient P5, right) patient showing joint clonotype abundances. For the responder patients, the most frequent clonotypes at baseline disappear at 2 years posttransplant.
Figure 3.
Figure 3.
Increased natural Tregs after AHSCT correlate with thymic function and are associated with clinical response. (A) Percentage of CD4+CD25highFoxP3+ Tregs within CD3+CD4+ T cells and (B) Treg absolute values at baseline (0 months, pretransplant) and following time points in the transplanted patients immunophenotyped by flow cytometry. N = 26 transplanted patients at baseline, n = 15 at 6 and 12 months, and n = 11 at 18, 24, and >24 months. The boundaries of the boxes indicate the 25th and 75th percentiles; lines within the boxes indicate the median, and the whiskers mark the 10th and the 90th percentiles. Plots show mean ± SE. *P < .05; **P < .01 comparing posttransplant values to baseline (Wilcoxon’s). (C) Correlation between the absolute values of RTEs and Tregs (Spearman’s). (D) GITR (left) and CTLA-4 (right) median of fluorescence intensity (MFI) expression by CD4+CD25high Tregs at baseline (Pre-Tx) and 12 months posttransplant. *P < .05; **P < .01 comparing posttransplant values to baseline (Wilcoxon’s). (E) Median (± IQR) baseline percentage of (left) CD4+CD25hiFoxP3+ Tregs and (right) FoxP3 expression by CD4+CD25hi Tregs in nonresponder patients (red) after AHSCT or in responder patients (blue). *P < .05 comparing groups (Mann-Whitney U test). (F) Median (± IQR) baseline and 12-month Treg counts and GITR/CTLA-4 expressions by CD4+CD25hi Tregs in nonresponder patients after AHSCT or in responder patients. *P < .05 comparing groups (Mann-Whitney U test) and *P < .05 comparing posttransplant values to baseline (Wilcoxon’s).
Figure 4.
Figure 4.
Increased output of newly generated B cells result in reduced B-cell replication in the periphery. Median (± IQR) of (A) sjKREC and (B) Cj values as measured by quantitative RT-PCR analysis on PBMC genomic DNA at baseline (0 months, pretransplant) and at the following time points in transplanted (AHSCT, n = 26 patients at baseline, n = 15 at 6 and 12 months, and n = 11 at 18, 24, and >24 months) and nontransplanted (non-AHSCT, n = 14 patients at baseline and 6 months, n = 13 at 12 months, and n = 8 at 18, 24, and >24 months) SSc patients. The results were expressed by log10 in 150 000 PBMCs. Panels C and D include transplanted patients only. (C) Quantification of CD19+ B cells by FACS. The boundaries of the boxes indicate the 25th and 75th percentiles; the lines within the boxes indicate the median, and the whiskers mark the 10th and the 90th percentiles. *P < .05 comparing posttransplant values to baseline (Wilcoxon’s). (D) Spearman’s correlation between B-cells count and Cj values. (E) Median (± IQR) number of B-cells division in the peripheral blood (n) as calculated using following formula: n = LOG(Cj/sjKREC)/LOG2. *P < .05, AHSCT vs non-AHSCT (Mann-Whitney U test). §P < .05; §§P < .01 comparing posttransplant values to baseline (Wilcoxon’s).
Figure 5.
Figure 5.
Increased output of bone marrow-derived naive B cells after AHSCT. (A) Mean (± SE) frequency of CD27brightIgD plasma cells, CD27+IgD switched memory, CD27+IgD+ nonswitched memory, CD27IgD+ naive, and CD27IgD double-negative B cells immunophenotyped by flow cytometry at baseline (0 months, pretransplant) and following time points. (B) Quantification of the B-cell subpopulations absolute values. *P < .05 comparing posttransplant values to baseline (Wilcoxon’s). (C) Correlation between naive B-cells count and sjKREC values (Spearman’s). (D) Mean (± SE) frequency of CD38IgD+ Bm1, CD38lowIgD+ Bm2, CD38highIgD+ Bm2′, CD38highIgD Bm3+4, CD38lowIgD early Bm5, and CD38IgD late Bm5 B cells immunophenotyped by flow cytometry at baseline and following time points. (E) Quantification of the B-cell subpopulations absolute values. *P < .05; **P < .01 comparing posttransplant values to baseline (Wilcoxon’s). (F) Correlation between Bm2 B-cells count and sjKREC values (Spearman’s). N = 18 transplanted patients at baseline, n = 14 at 6 and 12 months, n = 9 at 18 months, n = 12 at 24 months, and n = 7 at >24 months.
Figure 6.
Figure 6.
Increased output of IL-10–producing Bregs after AHSCT. (A) Gating strategy of 1 representative patient showing the frequency of CD24hiCD38, CD24intCD38int, CD24CD38hi memory, and CD24hiCD38hi Bregs immunophenotyped by flow cytometry at baseline (0 months, pretransplant) and following time points. Quantification of the B-cell subpopulations frequency (B) and absolute values (C) are shown in panel A. The boundaries of the boxes indicate the 25th and 75th percentiles; the lines within the boxes indicate the median, and the whiskers mark the 10th and the 90th percentiles. Plots show mean ± SE. *P < .05; **P < .01 comparing posttransplant values with baseline (Wilcoxon’s). Mean ± SE changes on (D) Breg/CD19+CD27+IgD+ Unswitched memory and on (E) Breg/CD19+CD27+IgD Switched memory ratios. *P < .05 comparing posttransplant values to baseline (Wilcoxon’s). N = 17 transplanted patients at baseline, n = 14 at 6 and 12 months, and n = 9 at 18, 24, and >24 months. (F) Correlation between Bregs and sjKREC values (Spearman’s). (G) Whole PBMCs from AHSCT patients at baseline, 6 months, and 12 months posttransplant were cultured for 18 hours with CpG or CpG and rhCD40L followed by restimulation with phorbol myristate acetate + ionomycin + BFA (PIB) in the last 6 hours of culture, fixed, permeabilized, and intracellular IL-10 assessed in CD19+ B cells by flow cytometry. The position of all gates was determined using isotype-matched control mAb staining. Negative controls consisted of PBMCs cultured in the presence of CpG control and BFA. These data are representative of those obtained in 6 independent experiments, with numbers representing the frequency of IL-10–producing B10 cells. Quantifications (mean ± SE) are expressed in parentheses. *P < .05; **P < .01 comparing posttransplant values with baseline (Wilcoxon’s). (H) Correlation between CD19+CD24hiCD38hi Bregs and the C-reactive protein levels (Spearman’s). (I) Responder patients after AHSCT presented higher Breg percentage at 12 months after transplant than nonresponder patients. *P < .05 comparing groups with each other (Mann-Whitney U test). (J) Correlation between sjKREC and sjTREC (Spearman’s).
Figure 6.
Figure 6.
Increased output of IL-10–producing Bregs after AHSCT. (A) Gating strategy of 1 representative patient showing the frequency of CD24hiCD38, CD24intCD38int, CD24CD38hi memory, and CD24hiCD38hi Bregs immunophenotyped by flow cytometry at baseline (0 months, pretransplant) and following time points. Quantification of the B-cell subpopulations frequency (B) and absolute values (C) are shown in panel A. The boundaries of the boxes indicate the 25th and 75th percentiles; the lines within the boxes indicate the median, and the whiskers mark the 10th and the 90th percentiles. Plots show mean ± SE. *P < .05; **P < .01 comparing posttransplant values with baseline (Wilcoxon’s). Mean ± SE changes on (D) Breg/CD19+CD27+IgD+ Unswitched memory and on (E) Breg/CD19+CD27+IgD Switched memory ratios. *P < .05 comparing posttransplant values to baseline (Wilcoxon’s). N = 17 transplanted patients at baseline, n = 14 at 6 and 12 months, and n = 9 at 18, 24, and >24 months. (F) Correlation between Bregs and sjKREC values (Spearman’s). (G) Whole PBMCs from AHSCT patients at baseline, 6 months, and 12 months posttransplant were cultured for 18 hours with CpG or CpG and rhCD40L followed by restimulation with phorbol myristate acetate + ionomycin + BFA (PIB) in the last 6 hours of culture, fixed, permeabilized, and intracellular IL-10 assessed in CD19+ B cells by flow cytometry. The position of all gates was determined using isotype-matched control mAb staining. Negative controls consisted of PBMCs cultured in the presence of CpG control and BFA. These data are representative of those obtained in 6 independent experiments, with numbers representing the frequency of IL-10–producing B10 cells. Quantifications (mean ± SE) are expressed in parentheses. *P < .05; **P < .01 comparing posttransplant values with baseline (Wilcoxon’s). (H) Correlation between CD19+CD24hiCD38hi Bregs and the C-reactive protein levels (Spearman’s). (I) Responder patients after AHSCT presented higher Breg percentage at 12 months after transplant than nonresponder patients. *P < .05 comparing groups with each other (Mann-Whitney U test). (J) Correlation between sjKREC and sjTREC (Spearman’s).

References

    1. Denton CP, Khanna D. Systemic sclerosis. Lancet. 2017;390(10103):1685-1699. - PubMed
    1. Gabrielli A, Avvedimento EV, Krieg T. Scleroderma. N Engl J Med. 2009;360(19):1989-2003. - PubMed
    1. Nannini C, West CP, Erwin PJ, Matteson EL. Effects of cyclophosphamide on pulmonary function in patients with scleroderma and interstitial lung disease: a systematic review and meta-analysis of randomized controlled trials and observational prospective cohort studies. Arthritis Res Ther. 2008;10(5):R124. - PMC - PubMed
    1. Tashkin DP, Elashoff R, Clements PJ, et al. ; Scleroderma Lung Study Research Group. Cyclophosphamide versus placebo in scleroderma lung disease. N Engl J Med. 2006;354(25):2655-2666. - PubMed
    1. Tashkin DP, Roth MD, Clements PJ, et al. ; Sclerodema Lung Study II Investigators. Mycophenolate mofetil versus oral cyclophosphamide in scleroderma-related interstitial lung disease (SLS II): a randomised controlled, double-blind, parallel group trial. Lancet Respir Med. 2016;4(9):708-719. - PMC - PubMed

Publication types

MeSH terms